Incomes are rising rapidly in the United States. According to estimates from the U.S. Census Bureau, the national median household income was nearly $75,000 in 2022, up from about $69,700 in 2021. The 7.2% increase was the largest recorded year-over-year since at least the mid-1990s.
While the typical American household is earning more than ever before, incomes have not been rising fast enough to offset inflation. Throughout 2022, the average rate of inflation hit a 40-year high of 8%, four times the Federal Reserve’s 2% target rate. Accounting for the rising cost of living, real incomes in the U.S. fell by nearly 5% between 2019 and 2022.
While no one has been spared from surging prices, Americans on the low end of the income spectrum have bore the brunt. During inflationary periods, higher-income Americans can cut back on spending and reduce the impact of rising costs. Meanwhile, lower earning Americans, who spend a larger share of their income on necessities such as food, housing, and gas, cannot.
With a median household income of $73,035, Texas has a relatively high-earning population. Still, there are many parts of the state where the typical household earns far less than the statewide median.
Using five-year estimates from the U.S. Census Bureau’s 2022 American Community Survey, 24/7 Wall St. identified the 35 poorest counties in Texas. Counties in the state are ranked on median household income. Population, poverty, and unemployment data are also five-year estimates from the 2022 ACS.
Among the counties on this list, median household incomes are anywhere from about $25,300 to nearly $45,700 below the statewide median. In many of these counties, levels of financial hardship are underscored by widespread poverty. In all but two counties on this list, the share of residents living below the poverty line exceeds the 13.9% statewide poverty rate.
In most of these places, lower than average incomes are attributable not only to low-paying jobs, but also to a lack of employment opportunities. According to the ACS, the average unemployment rate in Texas over the last five years stands at 5.2%. In 22 of the 35 counties on this list, the five-year average jobless rate exceeds the statewide average, and in some cases, is in the double-digits.
These are the poorest counties in Texas.
35. Brewster County

- Median household income: $47,747
- Poverty rate: 15.7%
- 5-yr. avg. unemployment rate: 3.0%
- Population: 9,454
34. Cottle County
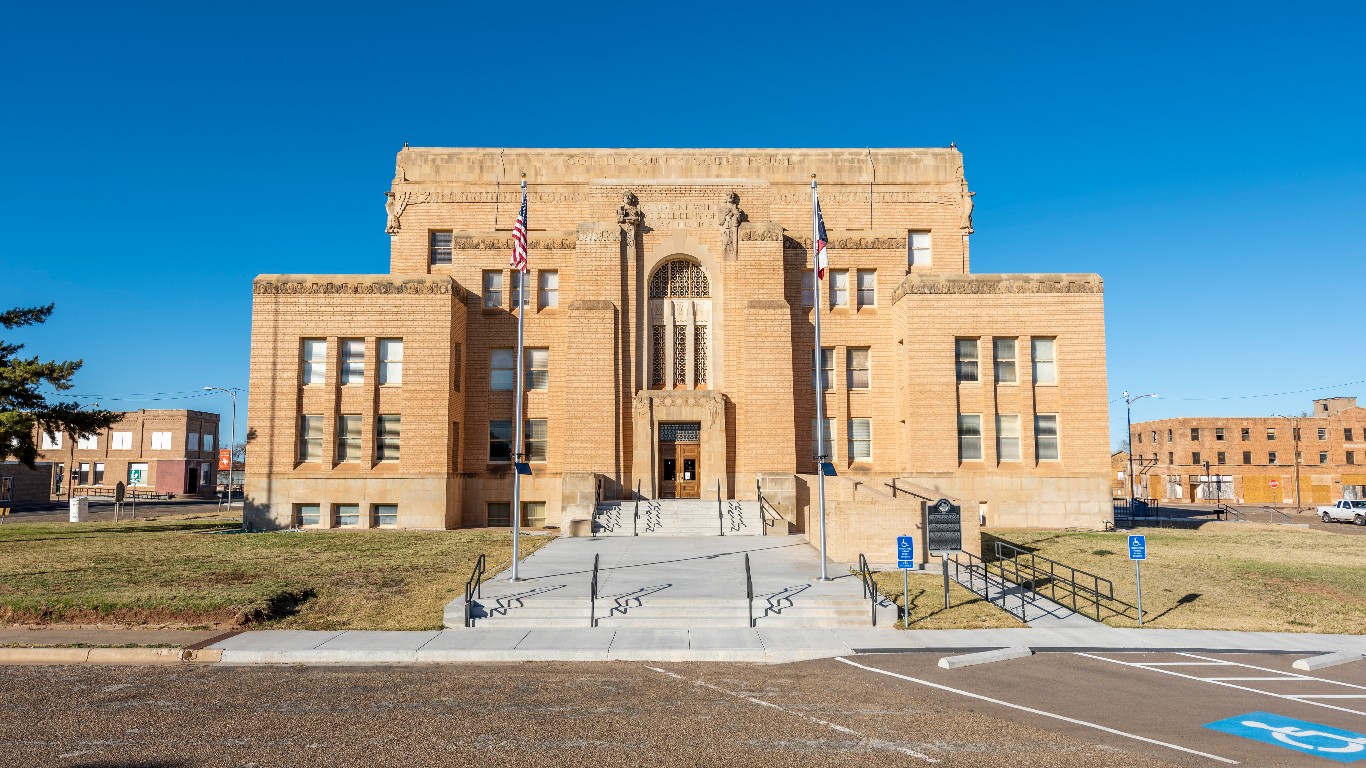
- Median household income: $47,625
- Poverty rate: 24.1%
- 5-yr. avg. unemployment rate: 4.1%
- Population: 1,647
33. Nolan County

- Median household income: $47,437
- Poverty rate: 15.5%
- 5-yr. avg. unemployment rate: 6.6%
- Population: 14,657
32. Cameron County

- Median household income: $47,435
- Poverty rate: 25.3%
- 5-yr. avg. unemployment rate: 5.7%
- Population: 421,854
31. Walker County
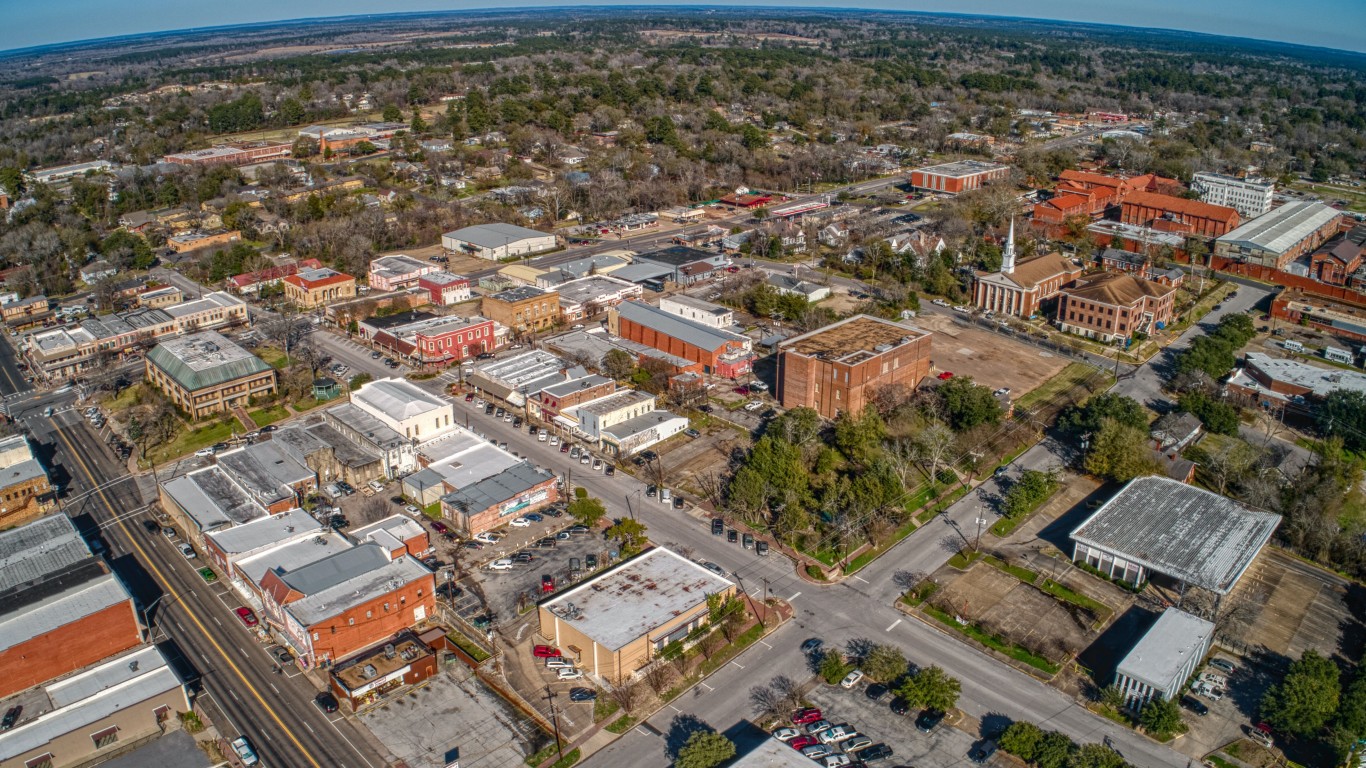
- Median household income: $47,193
- Poverty rate: 19.5%
- 5-yr. avg. unemployment rate: 7.0%
- Population: 77,182
30. Sabine County
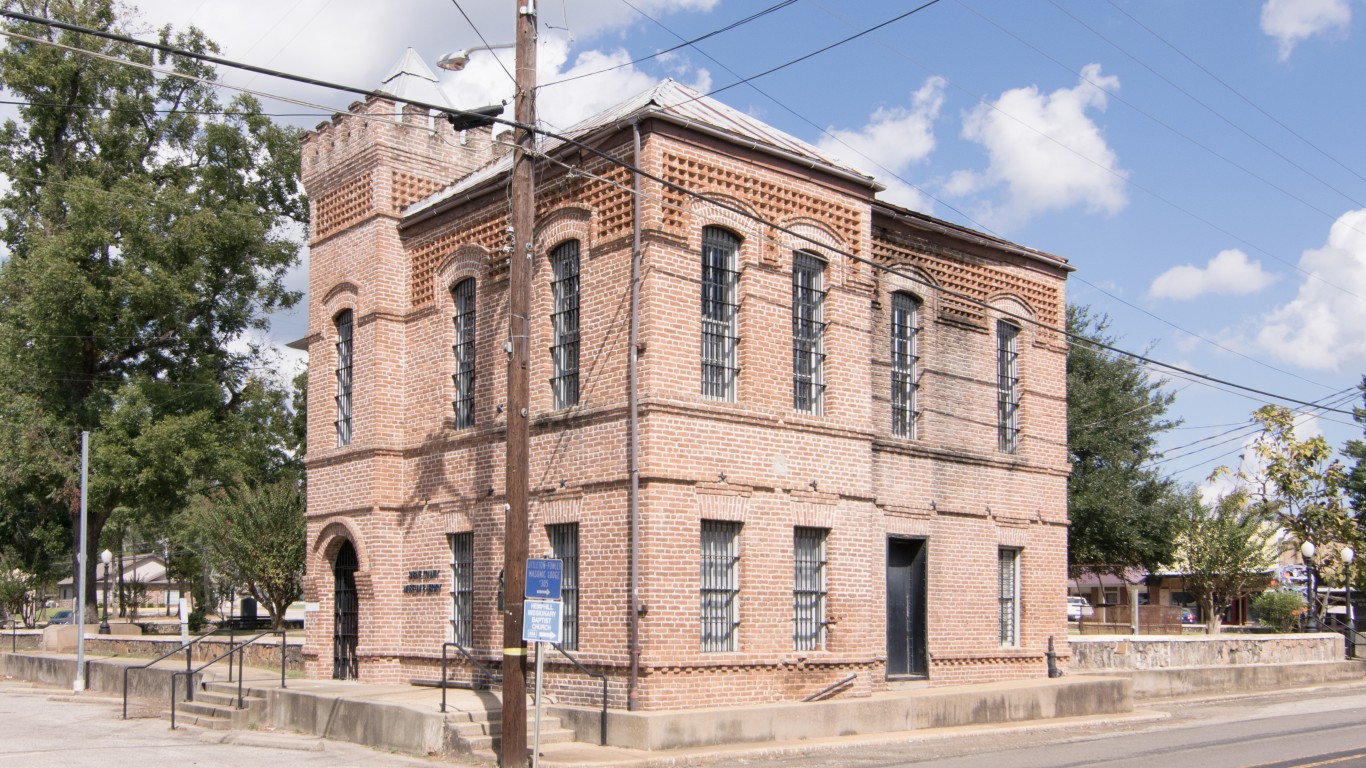
- Median household income: $47,061
- Poverty rate: 17.3%
- 5-yr. avg. unemployment rate: 8.4%
- Population: 9,980
29. Real County

- Median household income: $46,842
- Poverty rate: 24.5%
- 5-yr. avg. unemployment rate: 1.6%
- Population: 2,830
28. Dickens County

- Median household income: $46,638
- Poverty rate: 12.3%
- 5-yr. avg. unemployment rate: 9.7%
- Population: 1,570
27. Jim Wells County
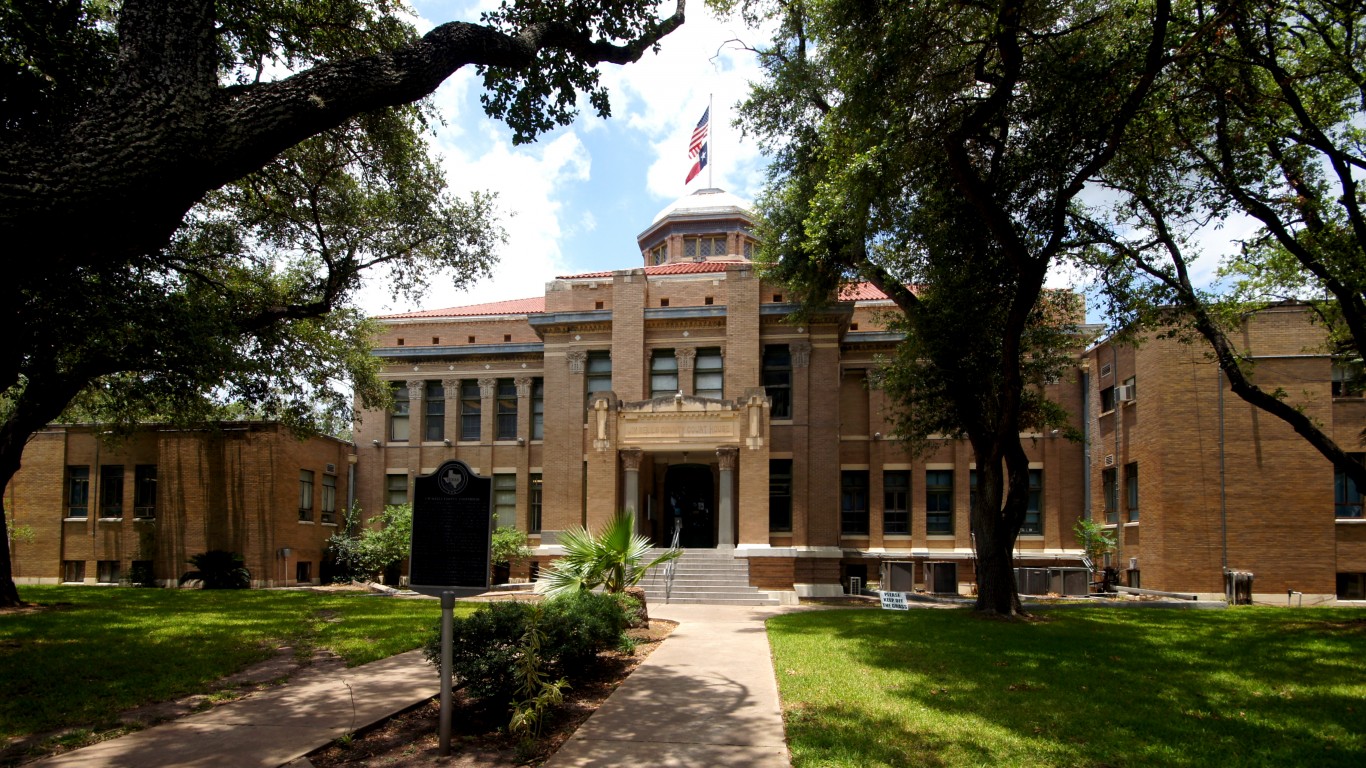
- Median household income: $46,626
- Poverty rate: 22.6%
- 5-yr. avg. unemployment rate: 5.2%
- Population: 39,060
26. San Augustine County
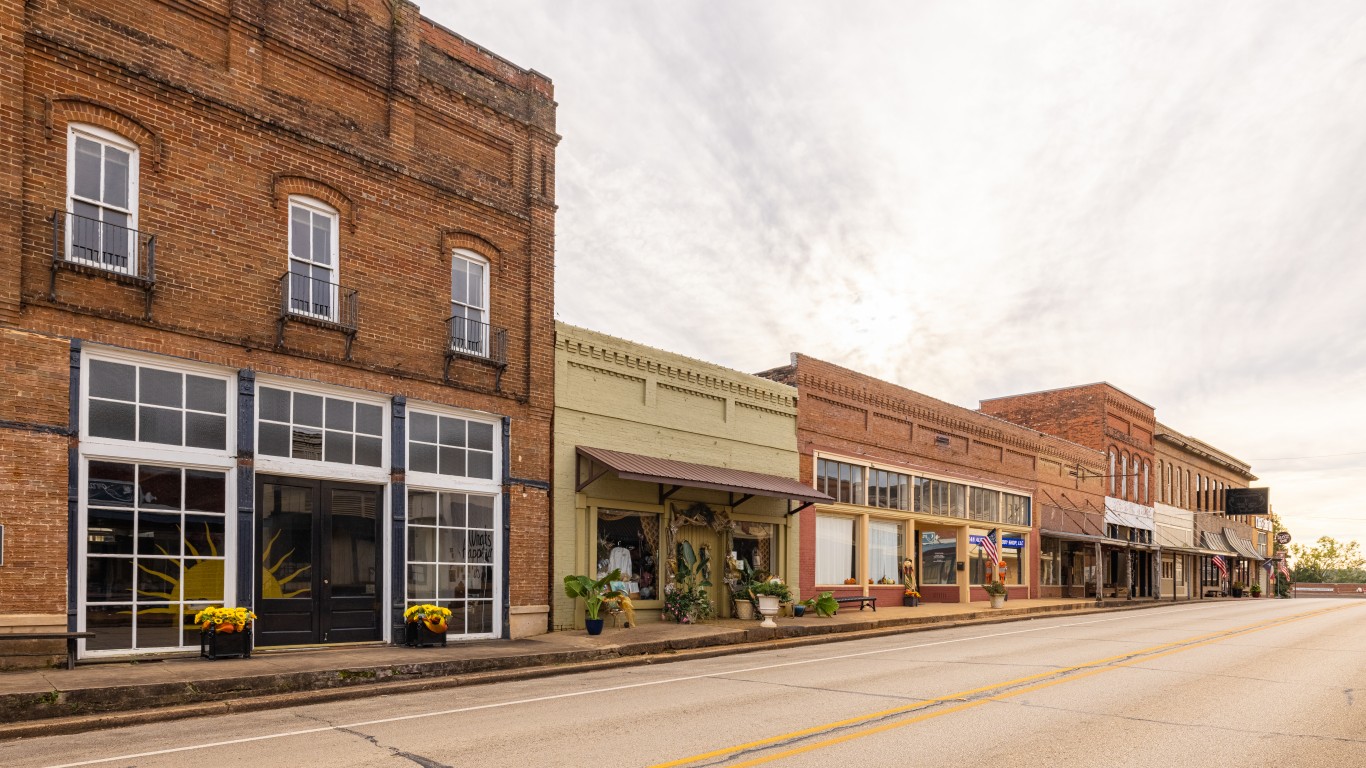
- Median household income: $45,888
- Poverty rate: 27.3%
- 5-yr. avg. unemployment rate: 10.3%
- Population: 7,920
25. Kenedy County
- Median household income: $45,455
- Poverty rate: 2.6%
- 5-yr. avg. unemployment rate: 0.0%
- Population: 116
24. Dawson County
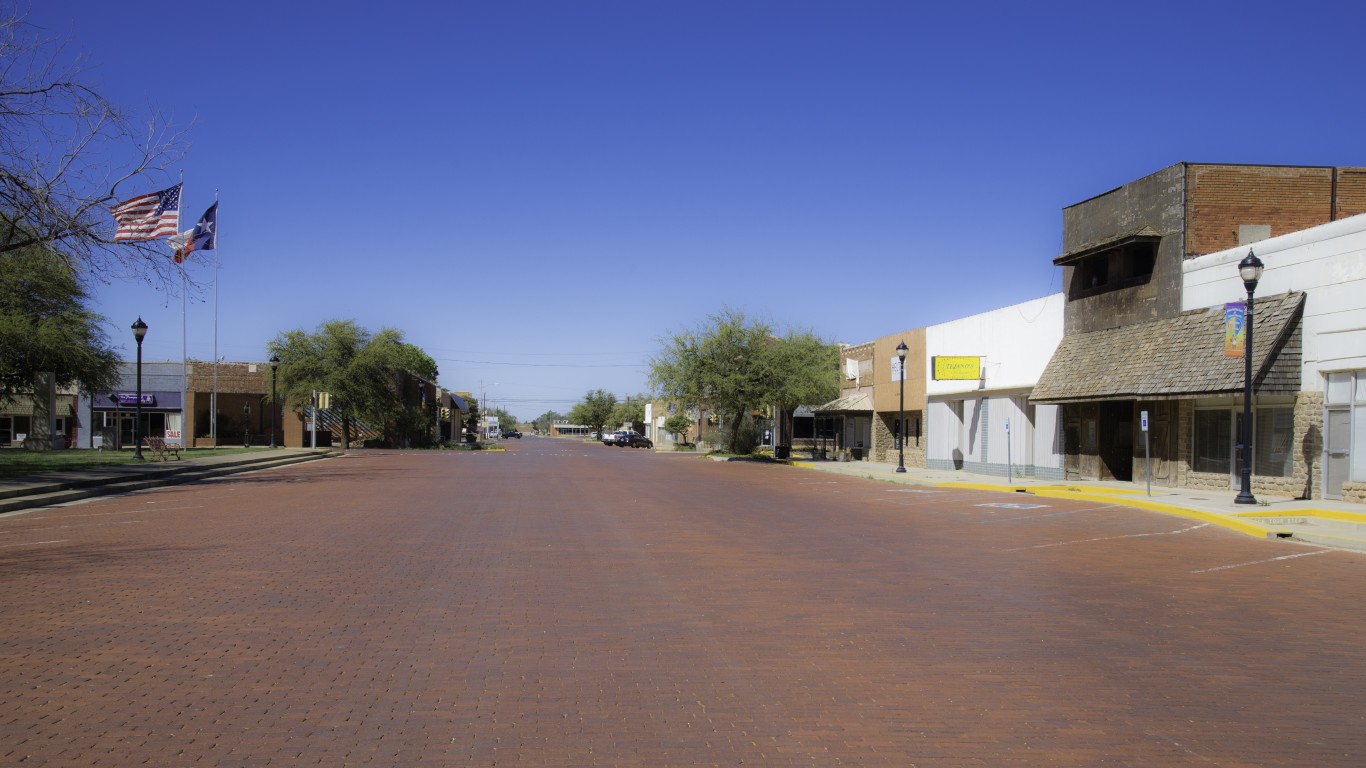
- Median household income: $45,268
- Poverty rate: 24.8%
- 5-yr. avg. unemployment rate: 9.5%
- Population: 12,342
23. Falls County
- Median household income: $45,172
- Poverty rate: 15.8%
- 5-yr. avg. unemployment rate: 7.4%
- Population: 17,013
22. Stephens County
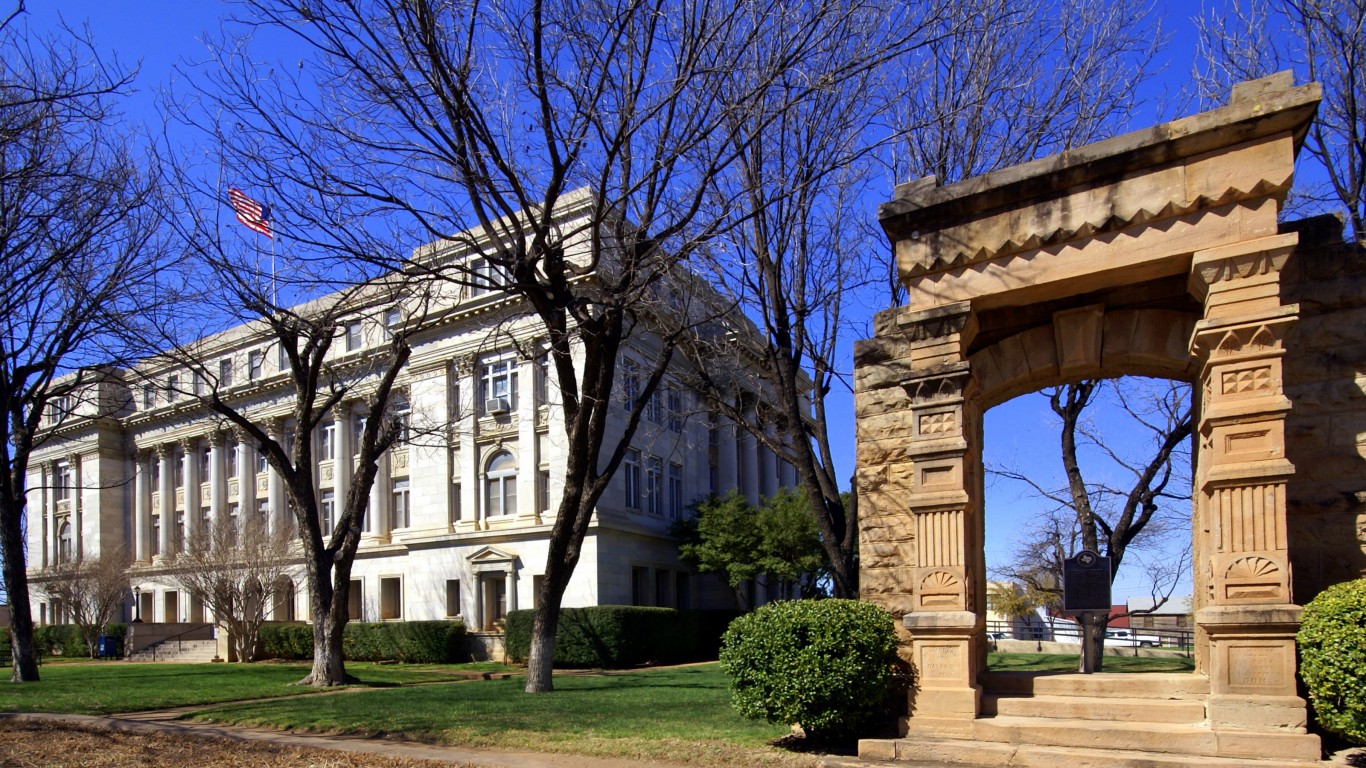
- Median household income: $44,712
- Poverty rate: 16.7%
- 5-yr. avg. unemployment rate: 8.6%
- Population: 9,260
21. Red River County
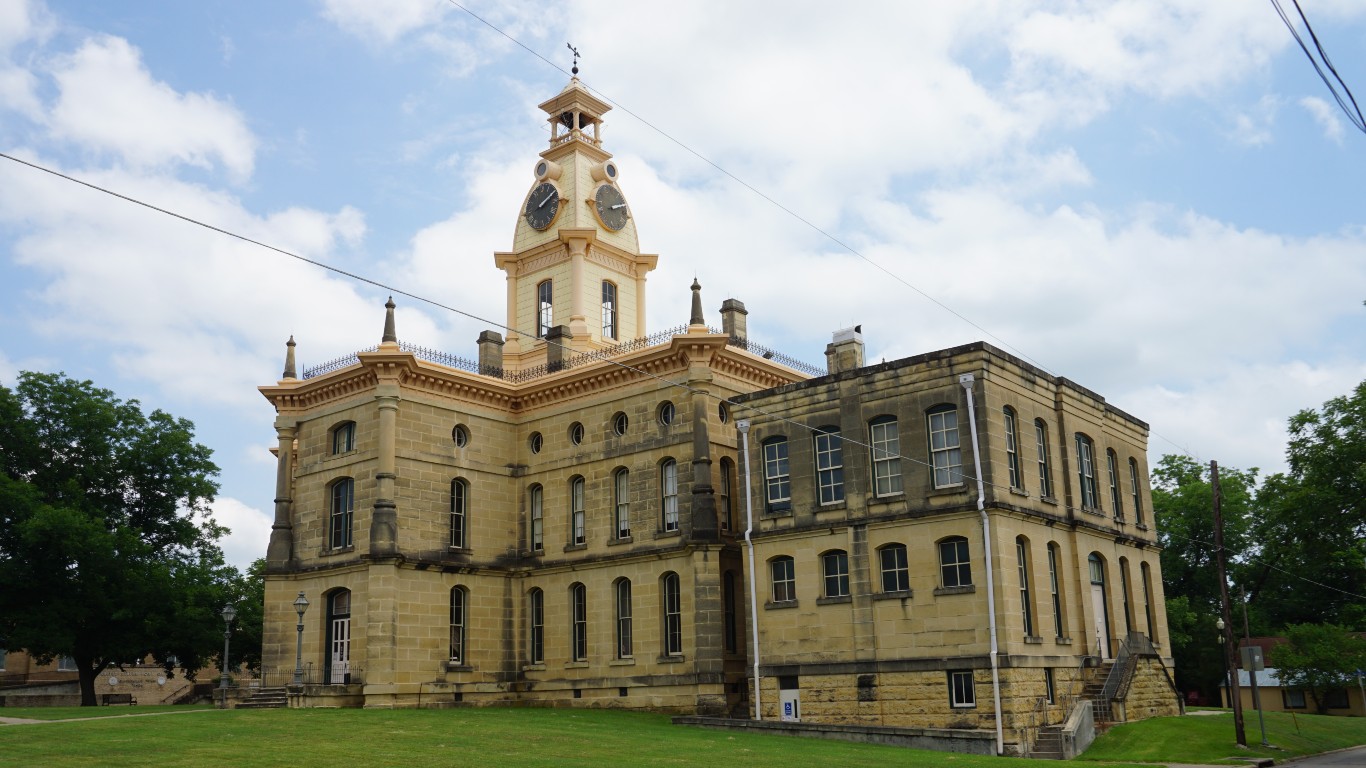
- Median household income: $44,583
- Poverty rate: 20.2%
- 5-yr. avg. unemployment rate: 3.8%
- Population: 11,627
20. Hall County
- Median household income: $43,873
- Poverty rate: 18.6%
- 5-yr. avg. unemployment rate: 7.5%
- Population: 2,847
19. Willacy County
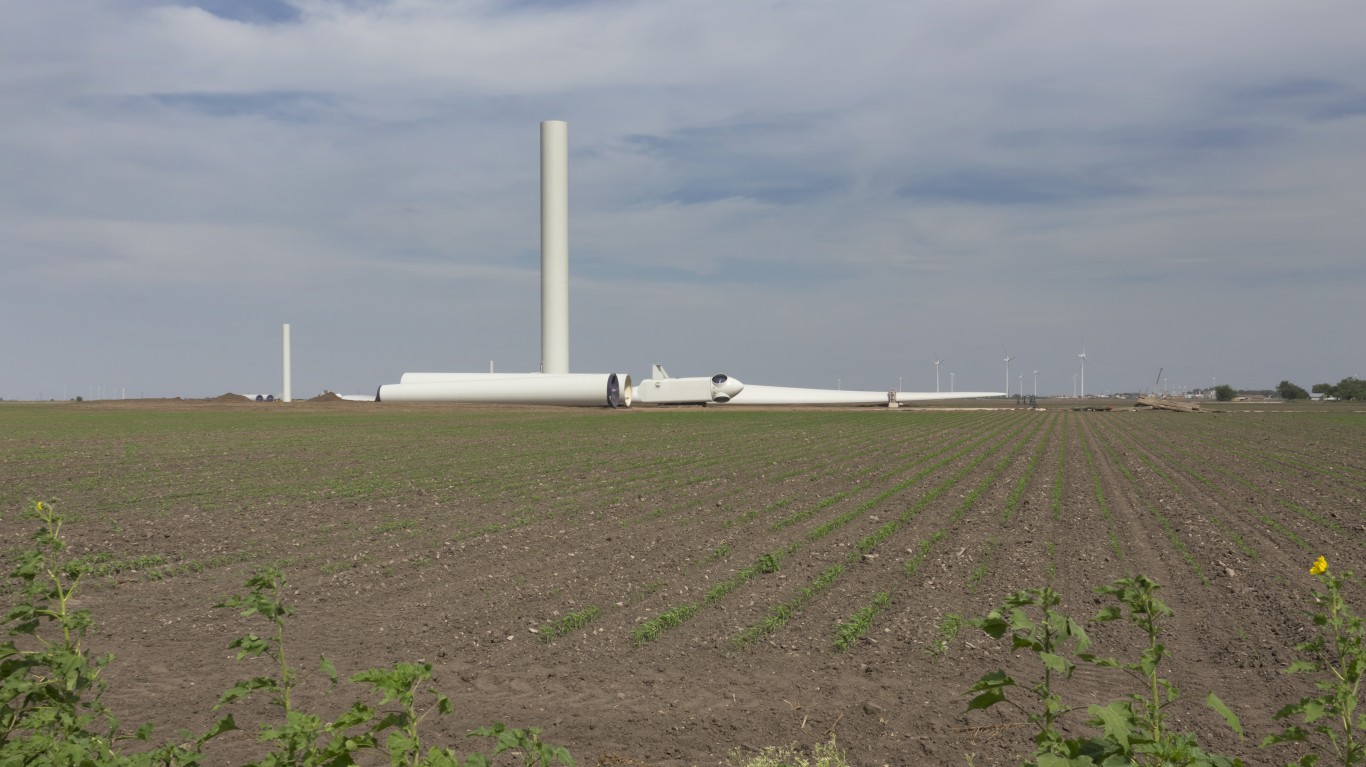
- Median household income: $42,839
- Poverty rate: 26.6%
- 5-yr. avg. unemployment rate: 8.7%
- Population: 20,308
18. Terry County

- Median household income: $42,694
- Poverty rate: 22.4%
- 5-yr. avg. unemployment rate: 4.8%
- Population: 11,816
17. Jim Hogg County
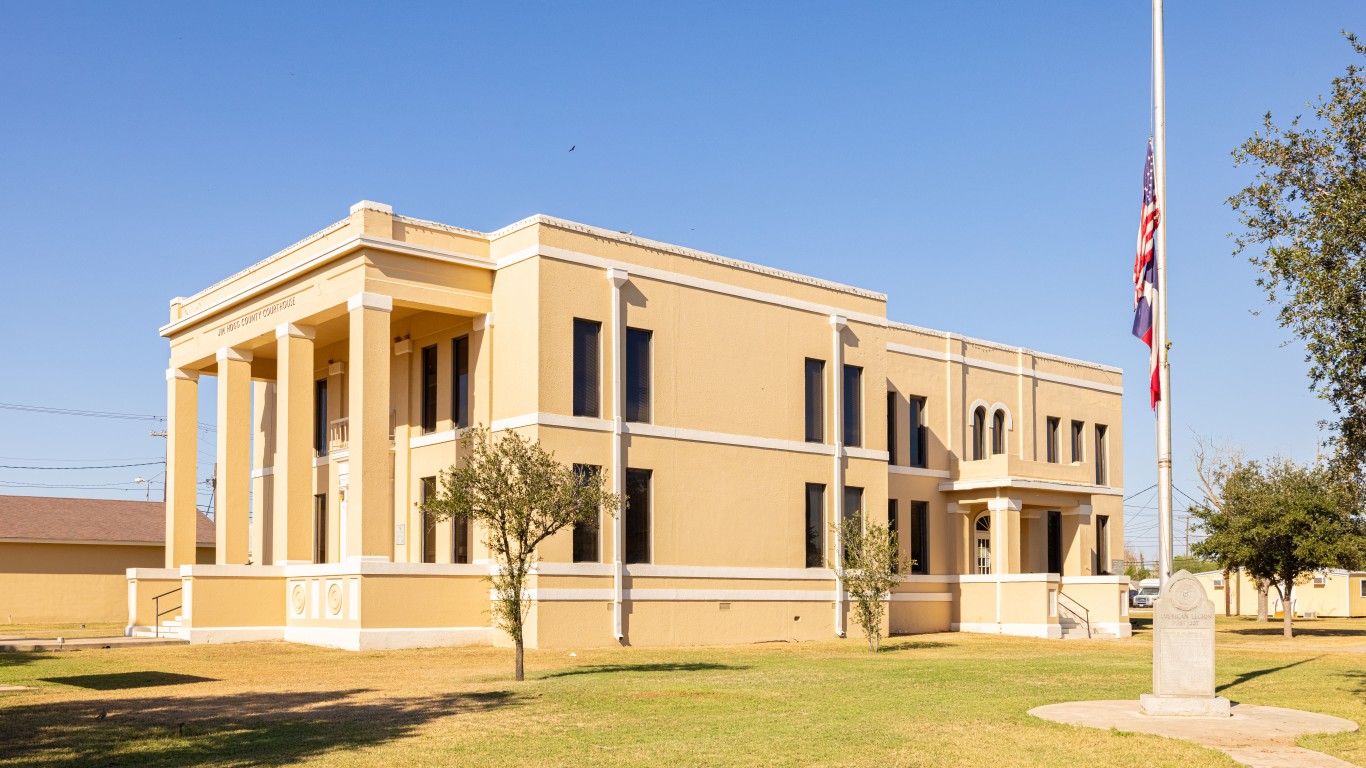
- Median household income: $42,292
- Poverty rate: 29.0%
- 5-yr. avg. unemployment rate: 4.5%
- Population: 4,830
16. Foard County
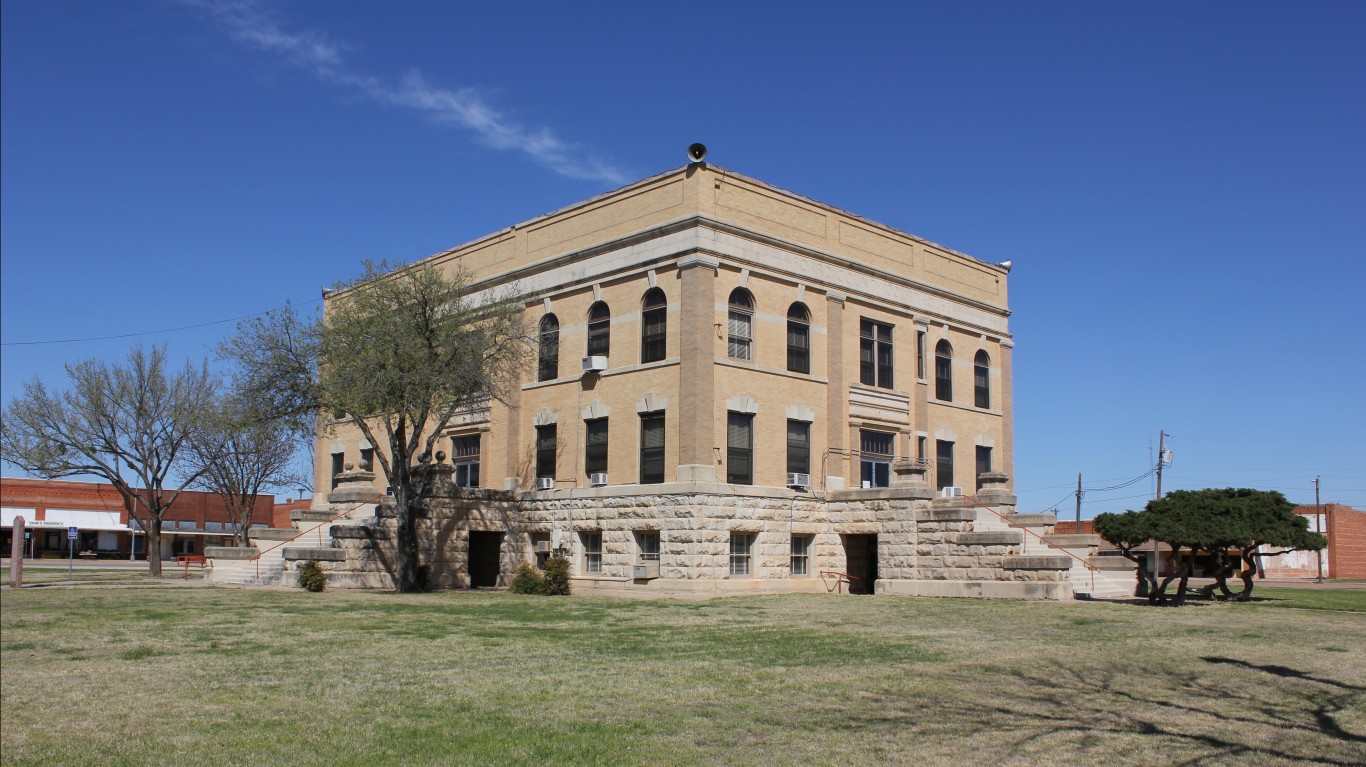
- Median household income: $41,944
- Poverty rate: 22.1%
- 5-yr. avg. unemployment rate: 5.9%
- Population: 1,075
15. Cochran County
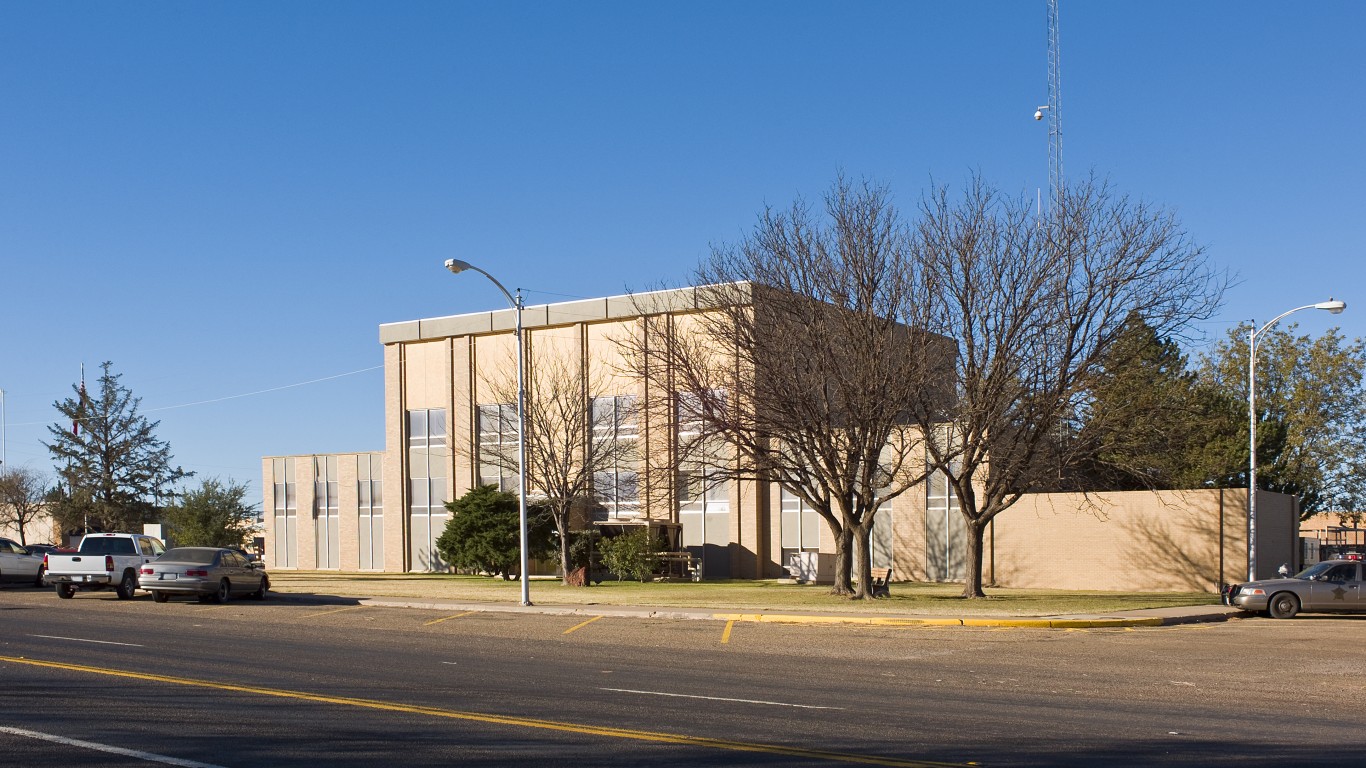
- Median household income: $41,597
- Poverty rate: 25.8%
- 5-yr. avg. unemployment rate: 7.1%
- Population: 2,529
14. Menard County
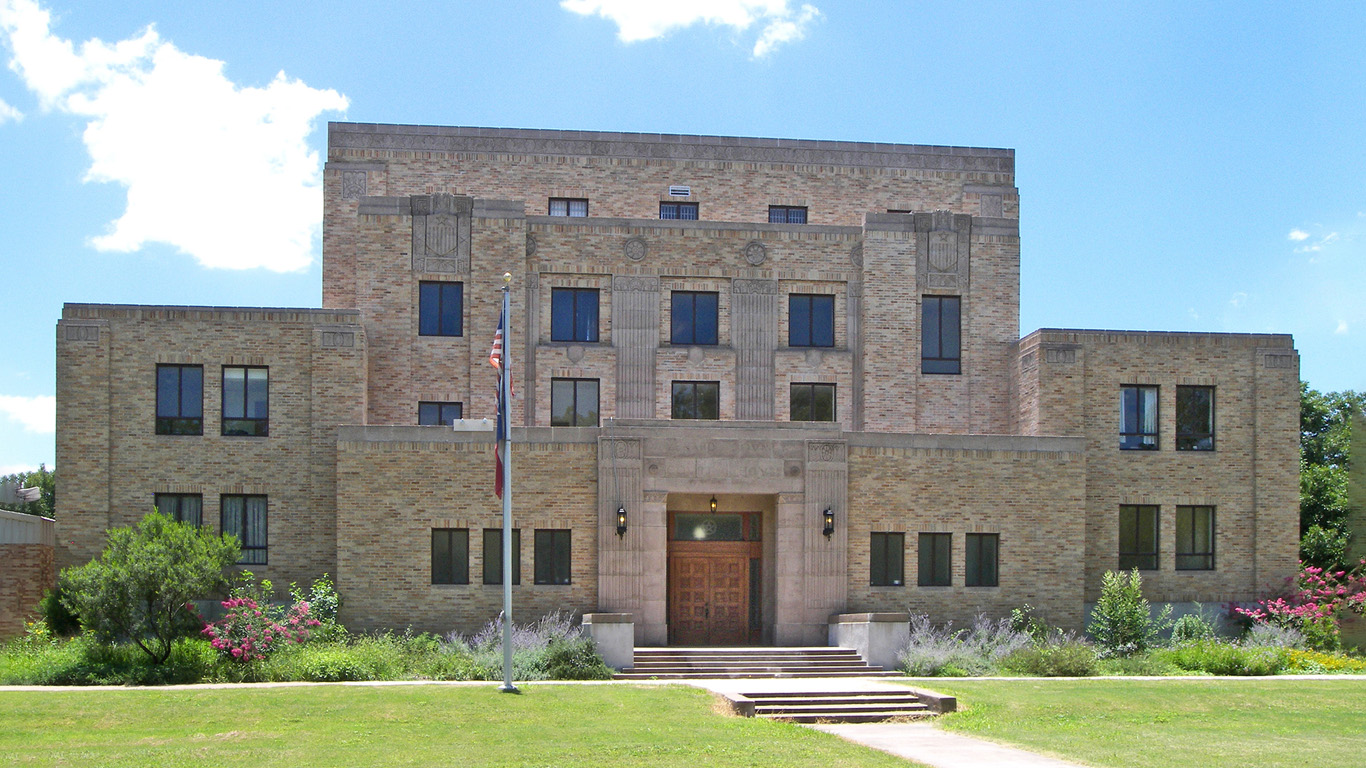
- Median household income: $40,945
- Poverty rate: 22.5%
- 5-yr. avg. unemployment rate: 14.3%
- Population: 1,964
13. Edwards County
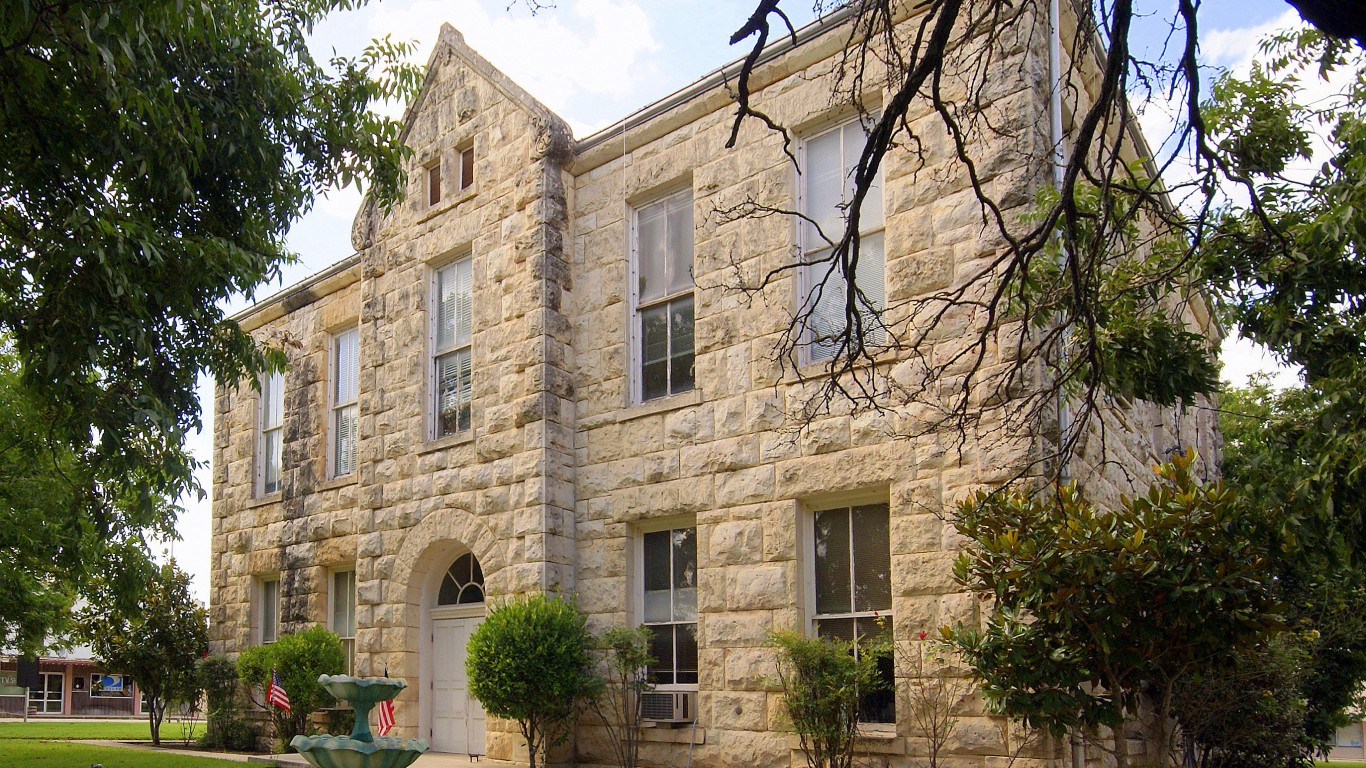
- Median household income: $40,809
- Poverty rate: 23.4%
- 5-yr. avg. unemployment rate: 0.0%
- Population: 1,380
12. Swisher County
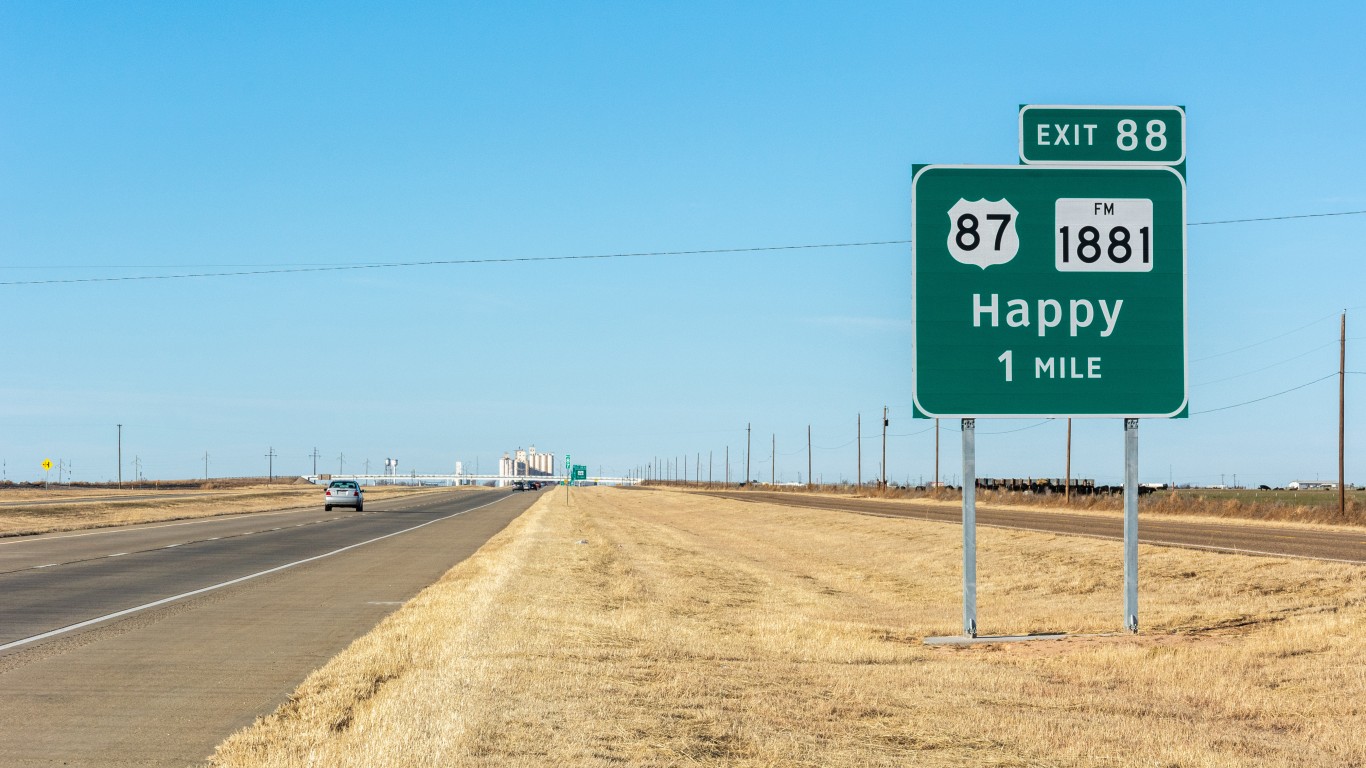
- Median household income: $40,290
- Poverty rate: 29.5%
- 5-yr. avg. unemployment rate: 5.2%
- Population: 6,989
11. Coke County
- Median household income: $40,230
- Poverty rate: 16.5%
- 5-yr. avg. unemployment rate: 3.0%
- Population: 3,305
10. Newton County
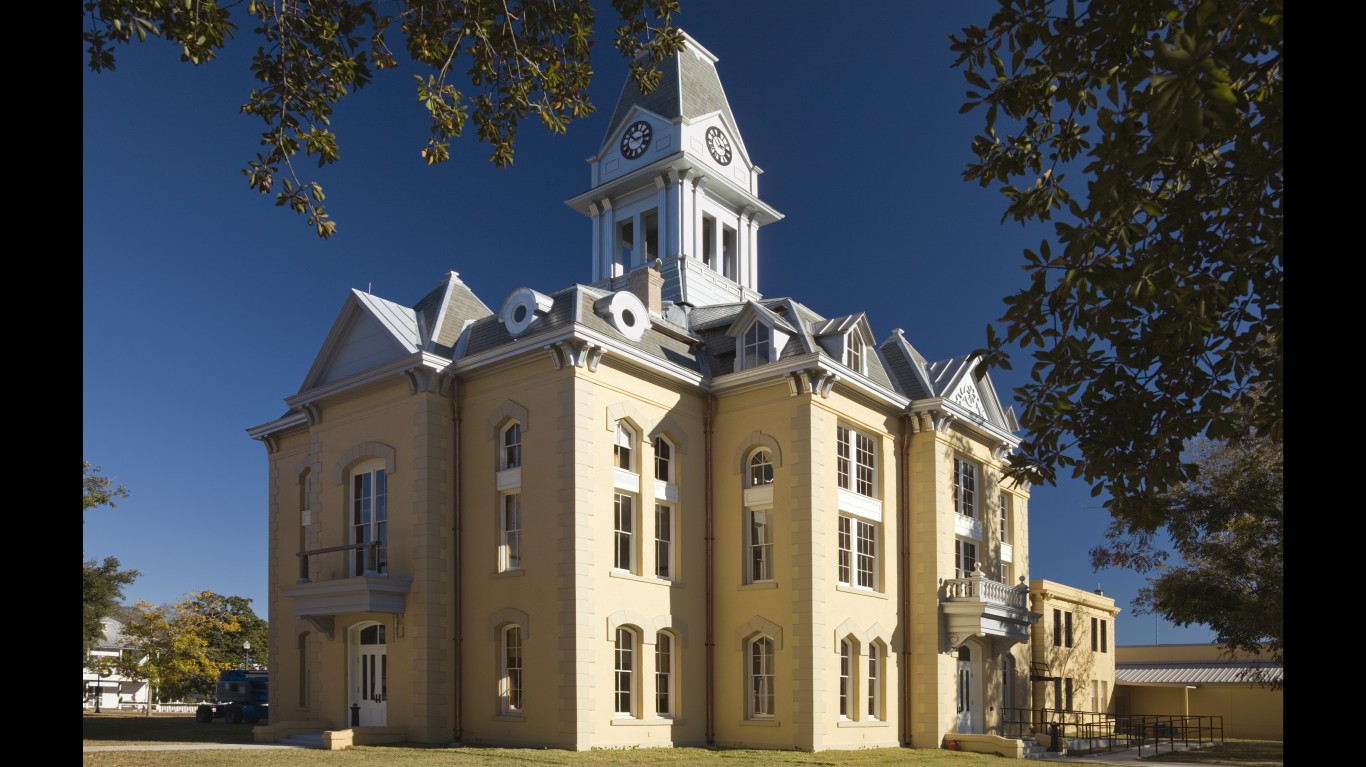
- Median household income: $38,871
- Poverty rate: 24.2%
- 5-yr. avg. unemployment rate: 10.6%
- Population: 12,333
9. Jeff Davis County
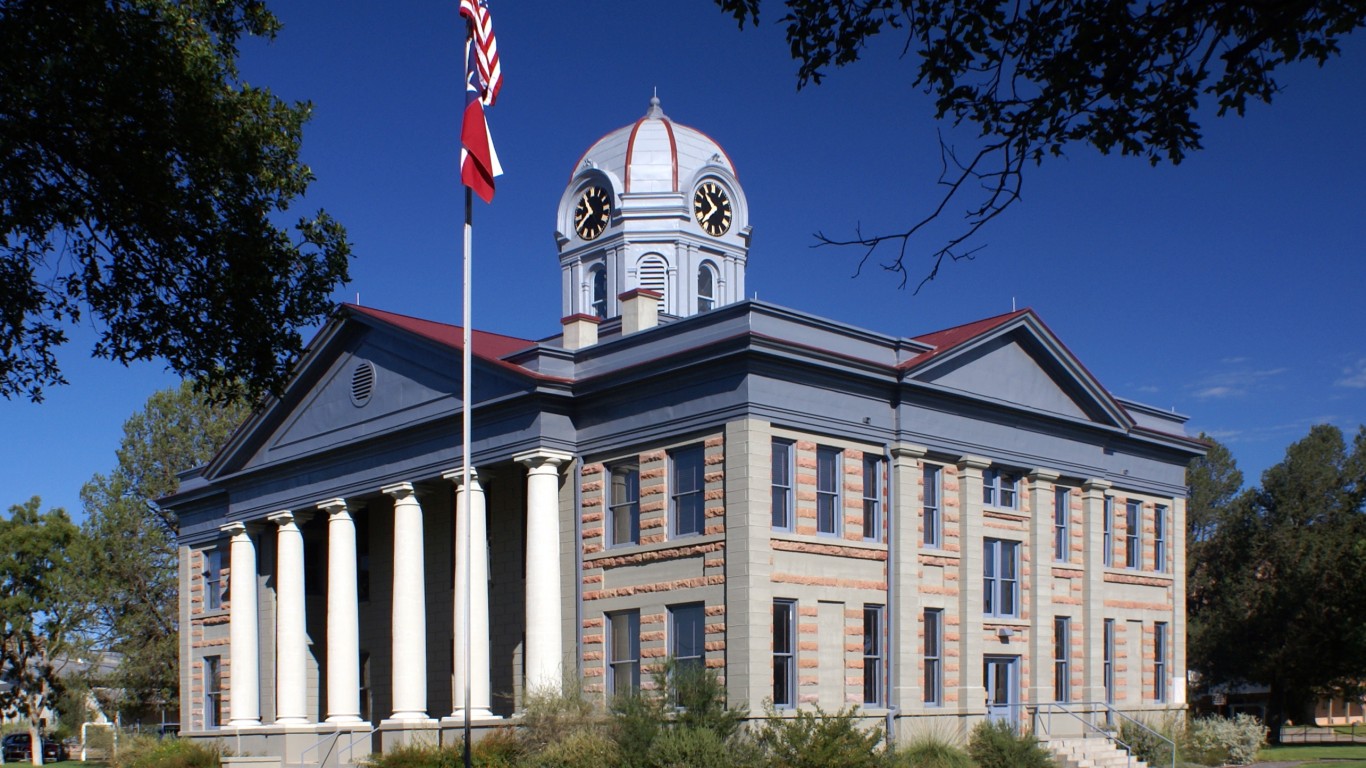
- Median household income: $38,125
- Poverty rate: 24.6%
- 5-yr. avg. unemployment rate: 0.0%
- Population: 1,992
8. Starr County
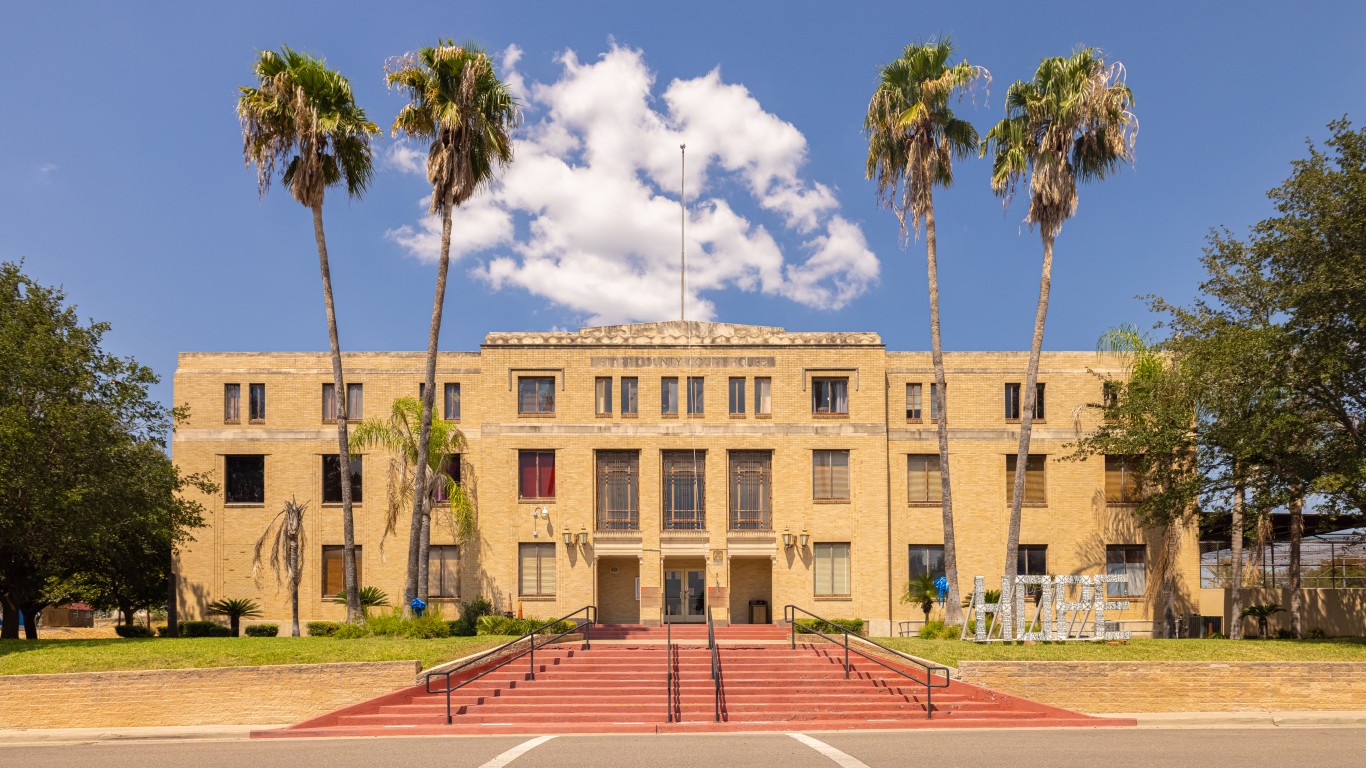
- Median household income: $35,979
- Poverty rate: 33.5%
- 5-yr. avg. unemployment rate: 11.5%
- Population: 65,716
7. Culberson County
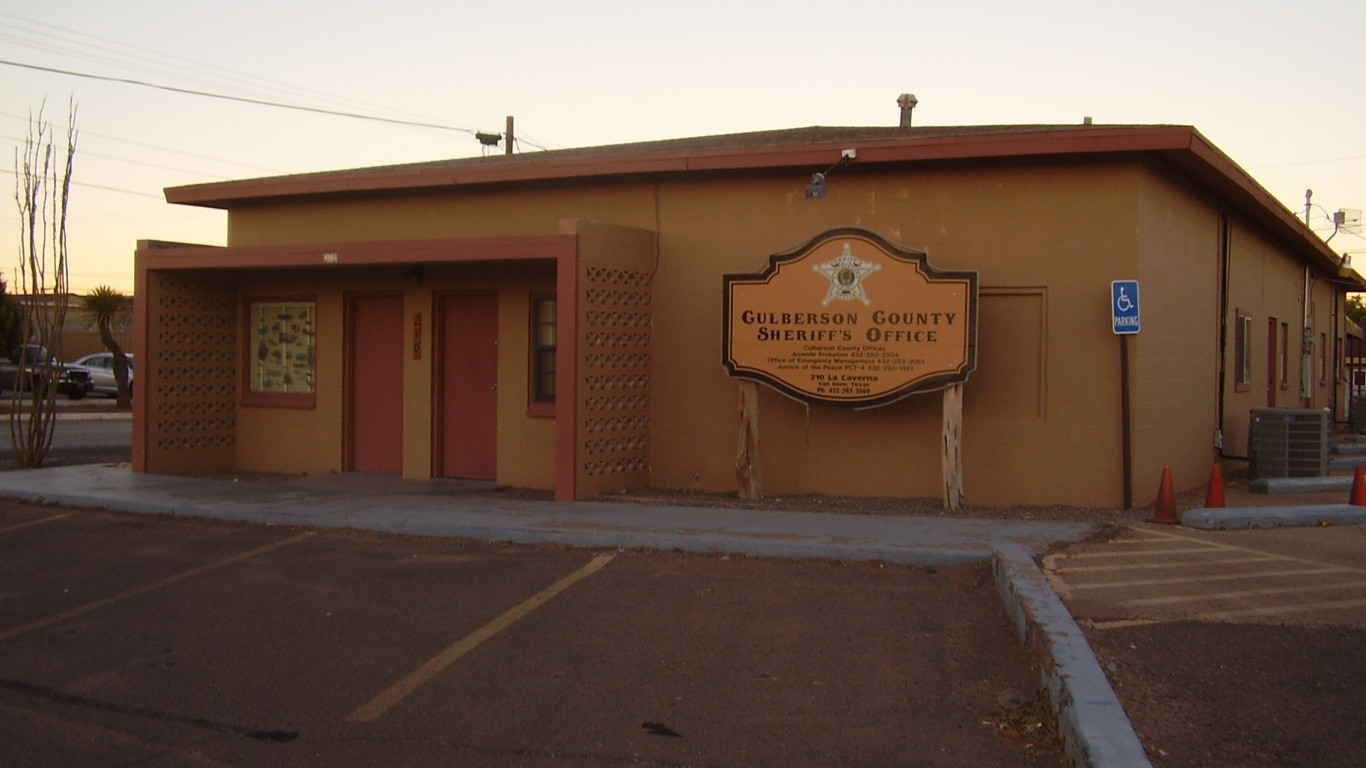
- Median household income: $35,924
- Poverty rate: 22.2%
- 5-yr. avg. unemployment rate: 10.1%
- Population: 2,181
6. Briscoe County
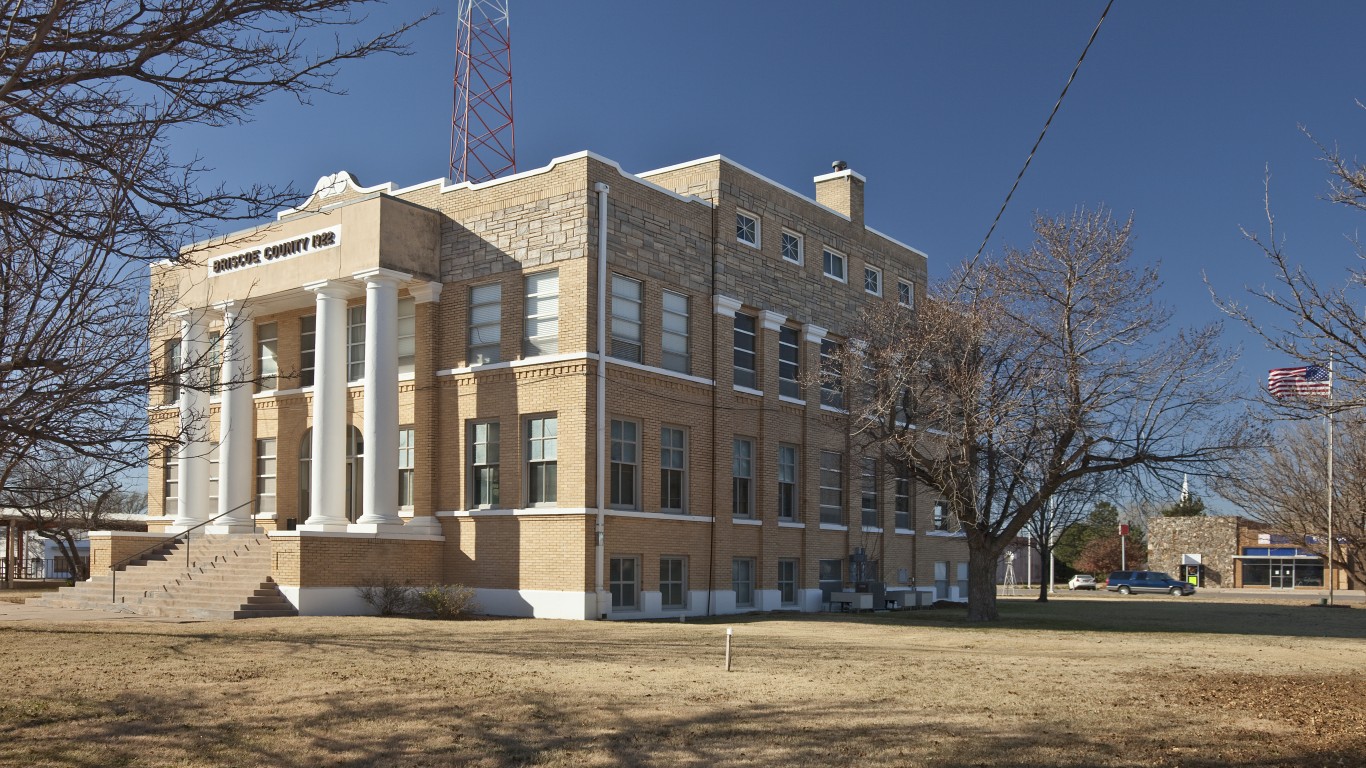
- Median household income: $35,446
- Poverty rate: 24.4%
- 5-yr. avg. unemployment rate: 3.3%
- Population: 1,290
5. Hudspeth County
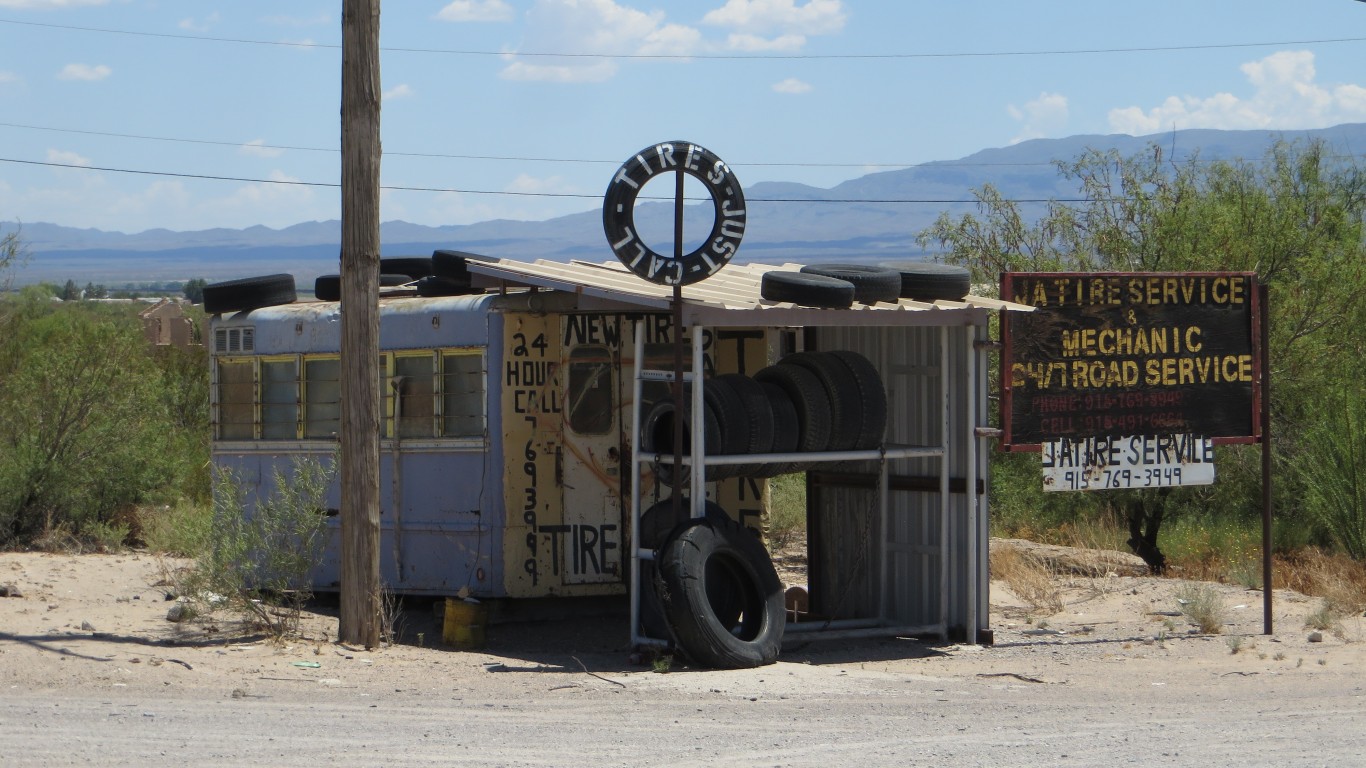
- Median household income: $35,163
- Poverty rate: 25.4%
- 5-yr. avg. unemployment rate: 8.2%
- Population: 3,329
4. Zapata County
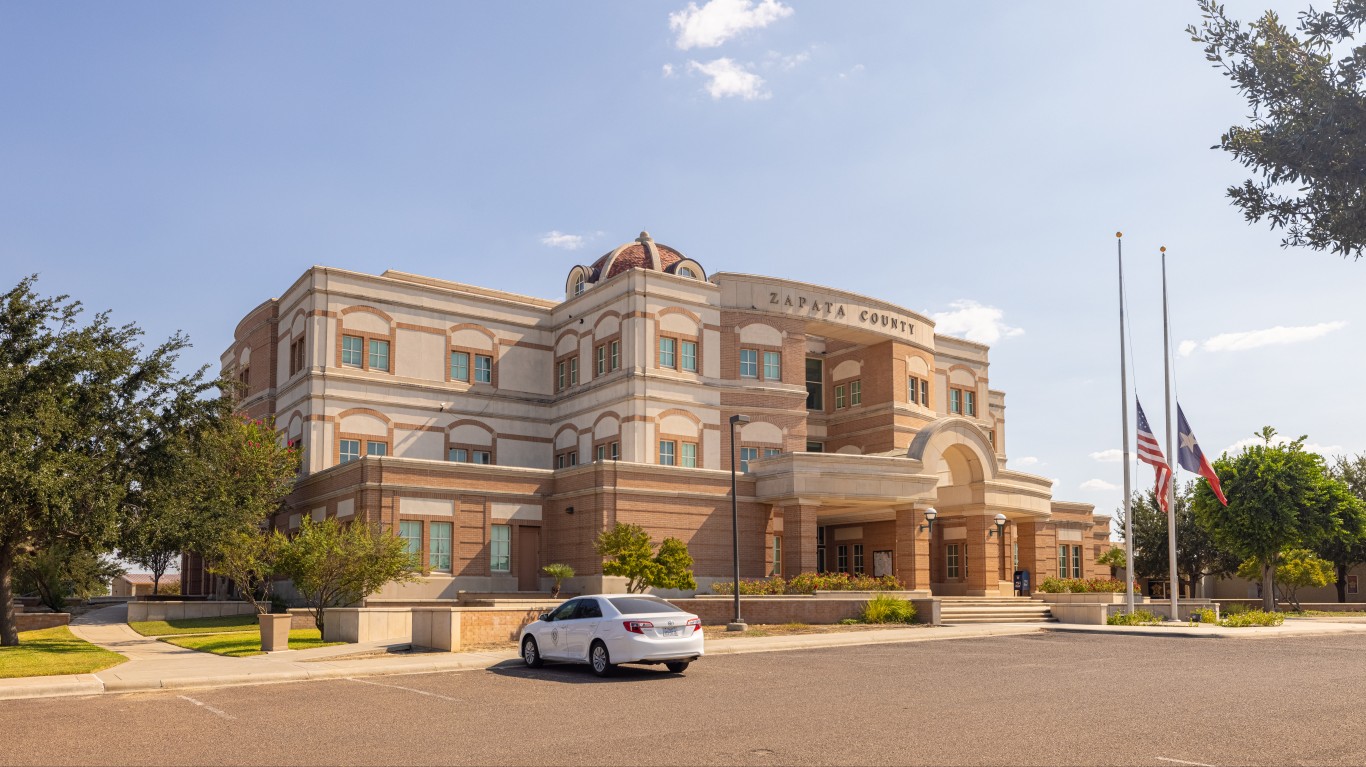
- Median household income: $35,061
- Poverty rate: 37.2%
- 5-yr. avg. unemployment rate: 8.1%
- Population: 13,896
3. Brooks County
- Median household income: $30,566
- Poverty rate: 33.2%
- 5-yr. avg. unemployment rate: 2.1%
- Population: 7,059
2. Presidio County
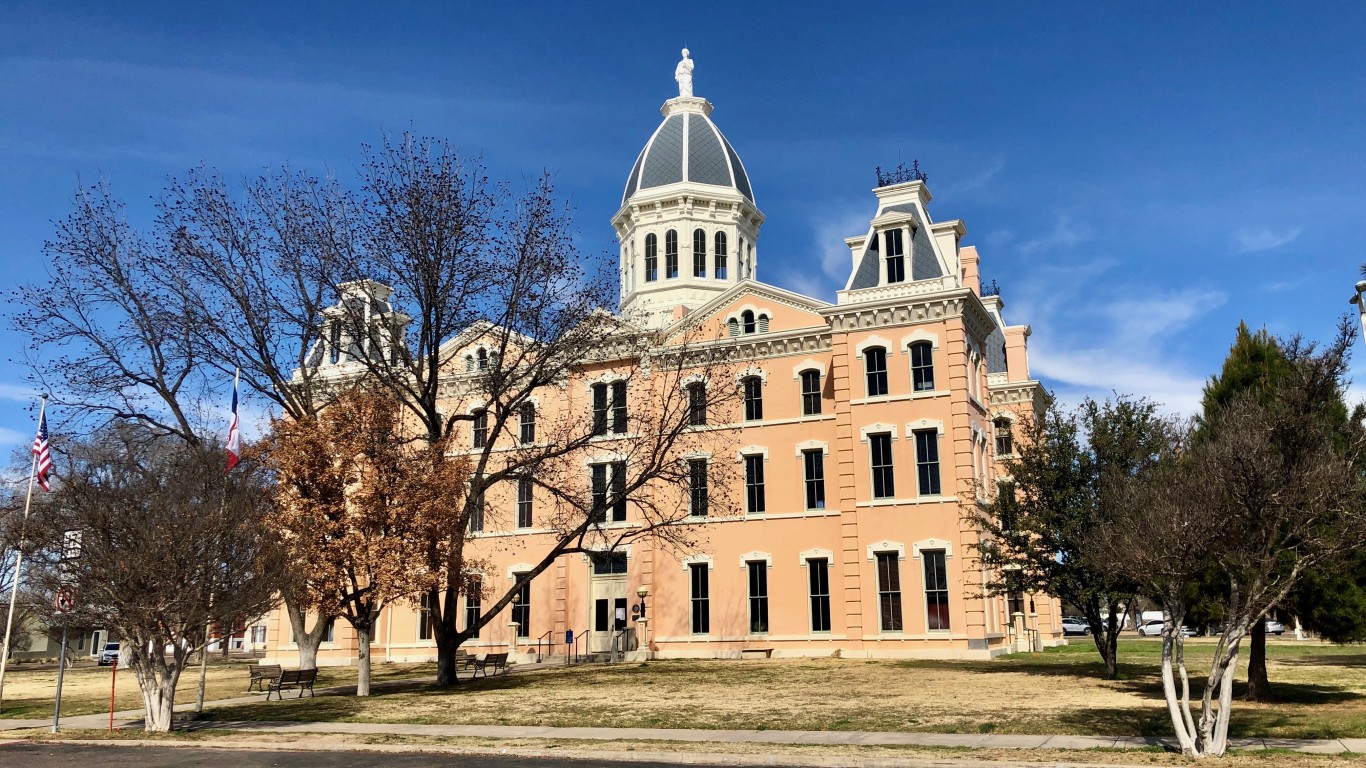
- Median household income: $29,012
- Poverty rate: 40.0%
- 5-yr. avg. unemployment rate: 12.3%
- Population: 6,168
1. Dimmit County
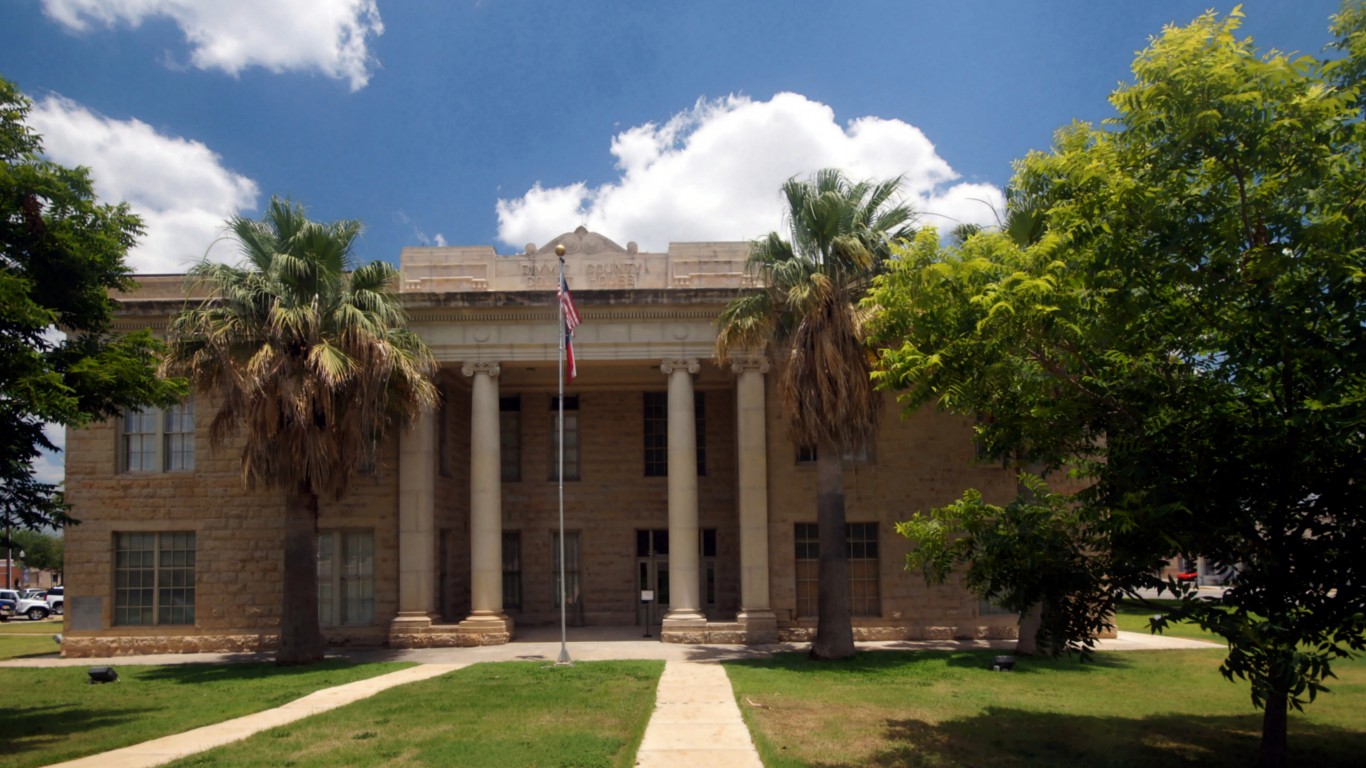
- Median household income: $27,374
- Poverty rate: 43.6%
- 5-yr. avg. unemployment rate: 4.7%
- Population: 8,672
| Rank | County | Median household income ($) | Poverty rate (%) | 5-yr. avg. unemployment rate (%) |
|---|---|---|---|---|
| 1 | Dimmit, Texas | 27,374 | 43.6 | 4.7 |
| 2 | Presidio, Texas | 29,012 | 40.0 | 12.3 |
| 3 | Brooks, Texas | 30,566 | 33.2 | 2.1 |
| 4 | Zapata, Texas | 35,061 | 37.2 | 8.1 |
| 5 | Hudspeth, Texas | 35,163 | 25.4 | 8.2 |
| 6 | Briscoe, Texas | 35,446 | 24.4 | 3.3 |
| 7 | Culberson, Texas | 35,924 | 22.2 | 10.1 |
| 8 | Starr, Texas | 35,979 | 33.5 | 11.5 |
| 9 | Jeff Davis, Texas | 38,125 | 24.6 | 0.0 |
| 10 | Newton, Texas | 38,871 | 24.2 | 10.6 |
| 11 | Coke, Texas | 40,230 | 16.5 | 3.0 |
| 12 | Swisher, Texas | 40,290 | 29.5 | 5.2 |
| 13 | Edwards, Texas | 40,809 | 23.4 | 0.0 |
| 14 | Menard, Texas | 40,945 | 22.5 | 14.3 |
| 15 | Cochran, Texas | 41,597 | 25.8 | 7.1 |
| 16 | Foard, Texas | 41,944 | 22.1 | 5.9 |
| 17 | Jim Hogg, Texas | 42,292 | 29.0 | 4.5 |
| 18 | Terry, Texas | 42,694 | 22.4 | 4.8 |
| 19 | Willacy, Texas | 42,839 | 26.6 | 8.7 |
| 20 | Hall, Texas | 43,873 | 18.6 | 7.5 |
| 21 | Red River, Texas | 44,583 | 20.2 | 3.8 |
| 22 | Stephens, Texas | 44,712 | 16.7 | 8.6 |
| 23 | Falls, Texas | 45,172 | 15.8 | 7.4 |
| 24 | Dawson, Texas | 45,268 | 24.8 | 9.5 |
| 25 | Kenedy, Texas | 45,455 | 2.6 | 0.0 |
| 26 | San Augustine, Texas | 45,888 | 27.3 | 10.3 |
| 27 | Jim Wells, Texas | 46,626 | 22.6 | 5.2 |
| 28 | Dickens, Texas | 46,638 | 12.3 | 9.7 |
| 29 | Real, Texas | 46,842 | 24.5 | 1.6 |
| 30 | Sabine, Texas | 47,061 | 17.3 | 8.4 |
| 31 | Walker, Texas | 47,193 | 19.5 | 7.0 |
| 32 | Cameron, Texas | 47,435 | 25.3 | 5.7 |
| 33 | Nolan, Texas | 47,437 | 15.5 | 6.6 |
| 34 | Cottle, Texas | 47,625 | 24.1 | 4.1 |
| 35 | Brewster, Texas | 47,747 | 15.7 | 3.0 |
Are You Ahead, or Behind on Retirement? (sponsor)
If you’re one of the over 4 Million Americans set to retire this year, you may want to pay attention. Many people have worked their whole lives preparing to retire without ever knowing the answer to the most important question: are you ahead, or behind on your retirement goals?
Don’t make the same mistake. It’s an easy question to answer. A quick conversation with a financial advisor can help you unpack your savings, spending, and goals for your money. With SmartAsset’s free tool, you can connect with vetted financial advisors in minutes.
Why wait? Click here to get started today!
Thank you for reading! Have some feedback for us?
Contact the 24/7 Wall St. editorial team.
