Incomes are rising rapidly in the United States. According to estimates from the U.S. Census Bureau, the national median household income was nearly $75,000 in 2022, up from about $69,700 in 2021. The 7.2% increase was the largest recorded year-over-year since at least the mid-1990s.
While the typical American household is earning more than ever before, incomes have not been rising fast enough to offset inflation. Throughout 2022, the average rate of inflation hit a 40-year high of 8%, four times the Federal Reserve’s 2% target rate. Accounting for the rising cost of living, real incomes in the U.S. fell by nearly 5% between 2019 and 2022.
While no one has been spared from surging prices, Americans on the low end of the income spectrum have bore the brunt. During inflationary periods, higher-income Americans can cut back on spending and reduce the impact of rising costs. Meanwhile, lower earning Americans, who spend a larger share of their income on necessities such as food, housing, and gas, cannot.
With a median household income of $81,386, New York has one of the higher earning populations of any state. Still, there are many parts of the state where the typical household earns far less than the statewide median.
Using five-year estimates from the U.S. Census Bureau’s 2022 American Community Survey, 24/7 Wall St. identified the 35 poorest counties in New York. Counties in the state are ranked on median household income. Population, poverty, and unemployment data are also five-year estimates from the 2022 ACS.
Among the counties on this list, median household incomes are anywhere from about $12,500 to $34,400 below the statewide median. In some of these places, lower than average incomes are attributable not only to low-paying jobs, but also to a lack of employment opportunities. According to the ACS, the average unemployment rate in New York over the last five years stands at 6.2%. In several counties on this list, the five-year average jobless rate exceeds the statewide average, and in one, unemployment is in the double digits.
These are the poorest counties in New York.
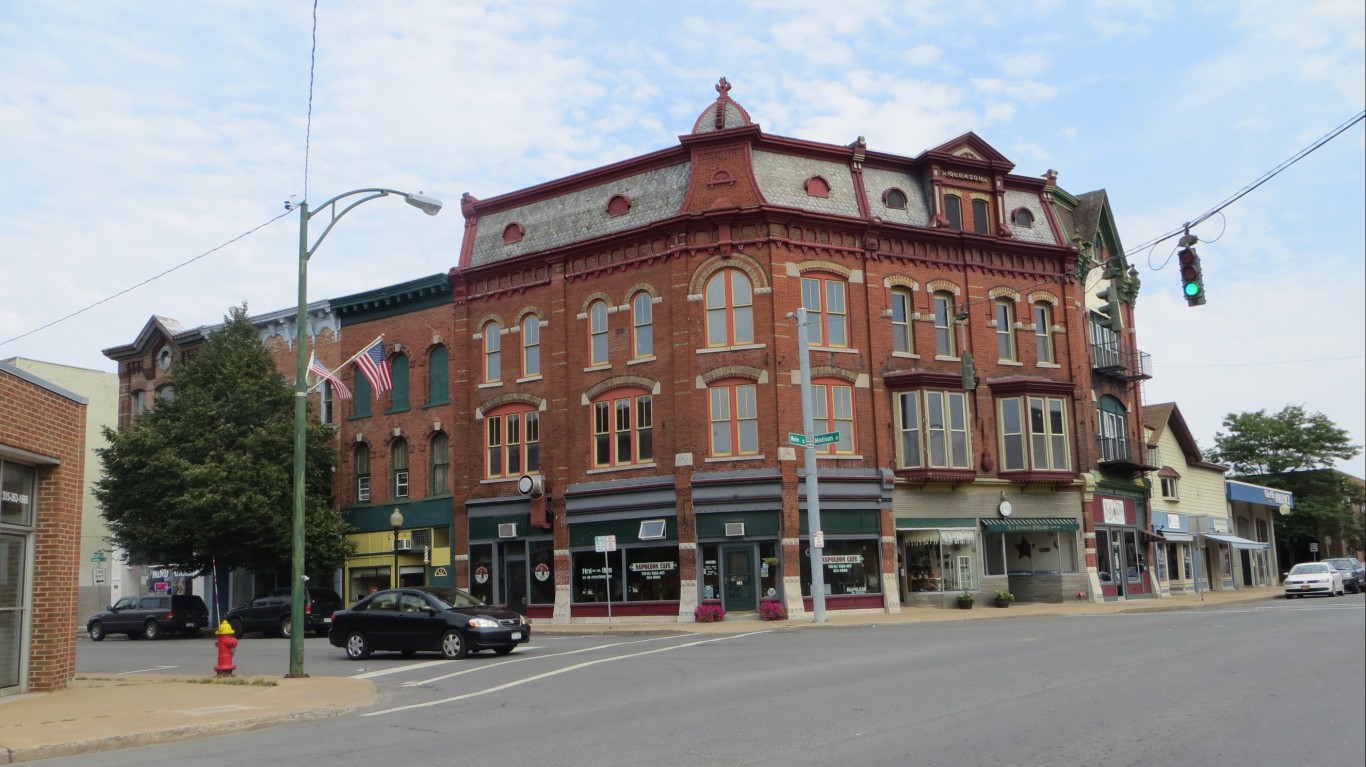
35. Madison County
- Median household income: $68,869
- Poverty rate: 9.5%
- 5-yr. avg. unemployment rate: 4.0%
- Population: 68,020
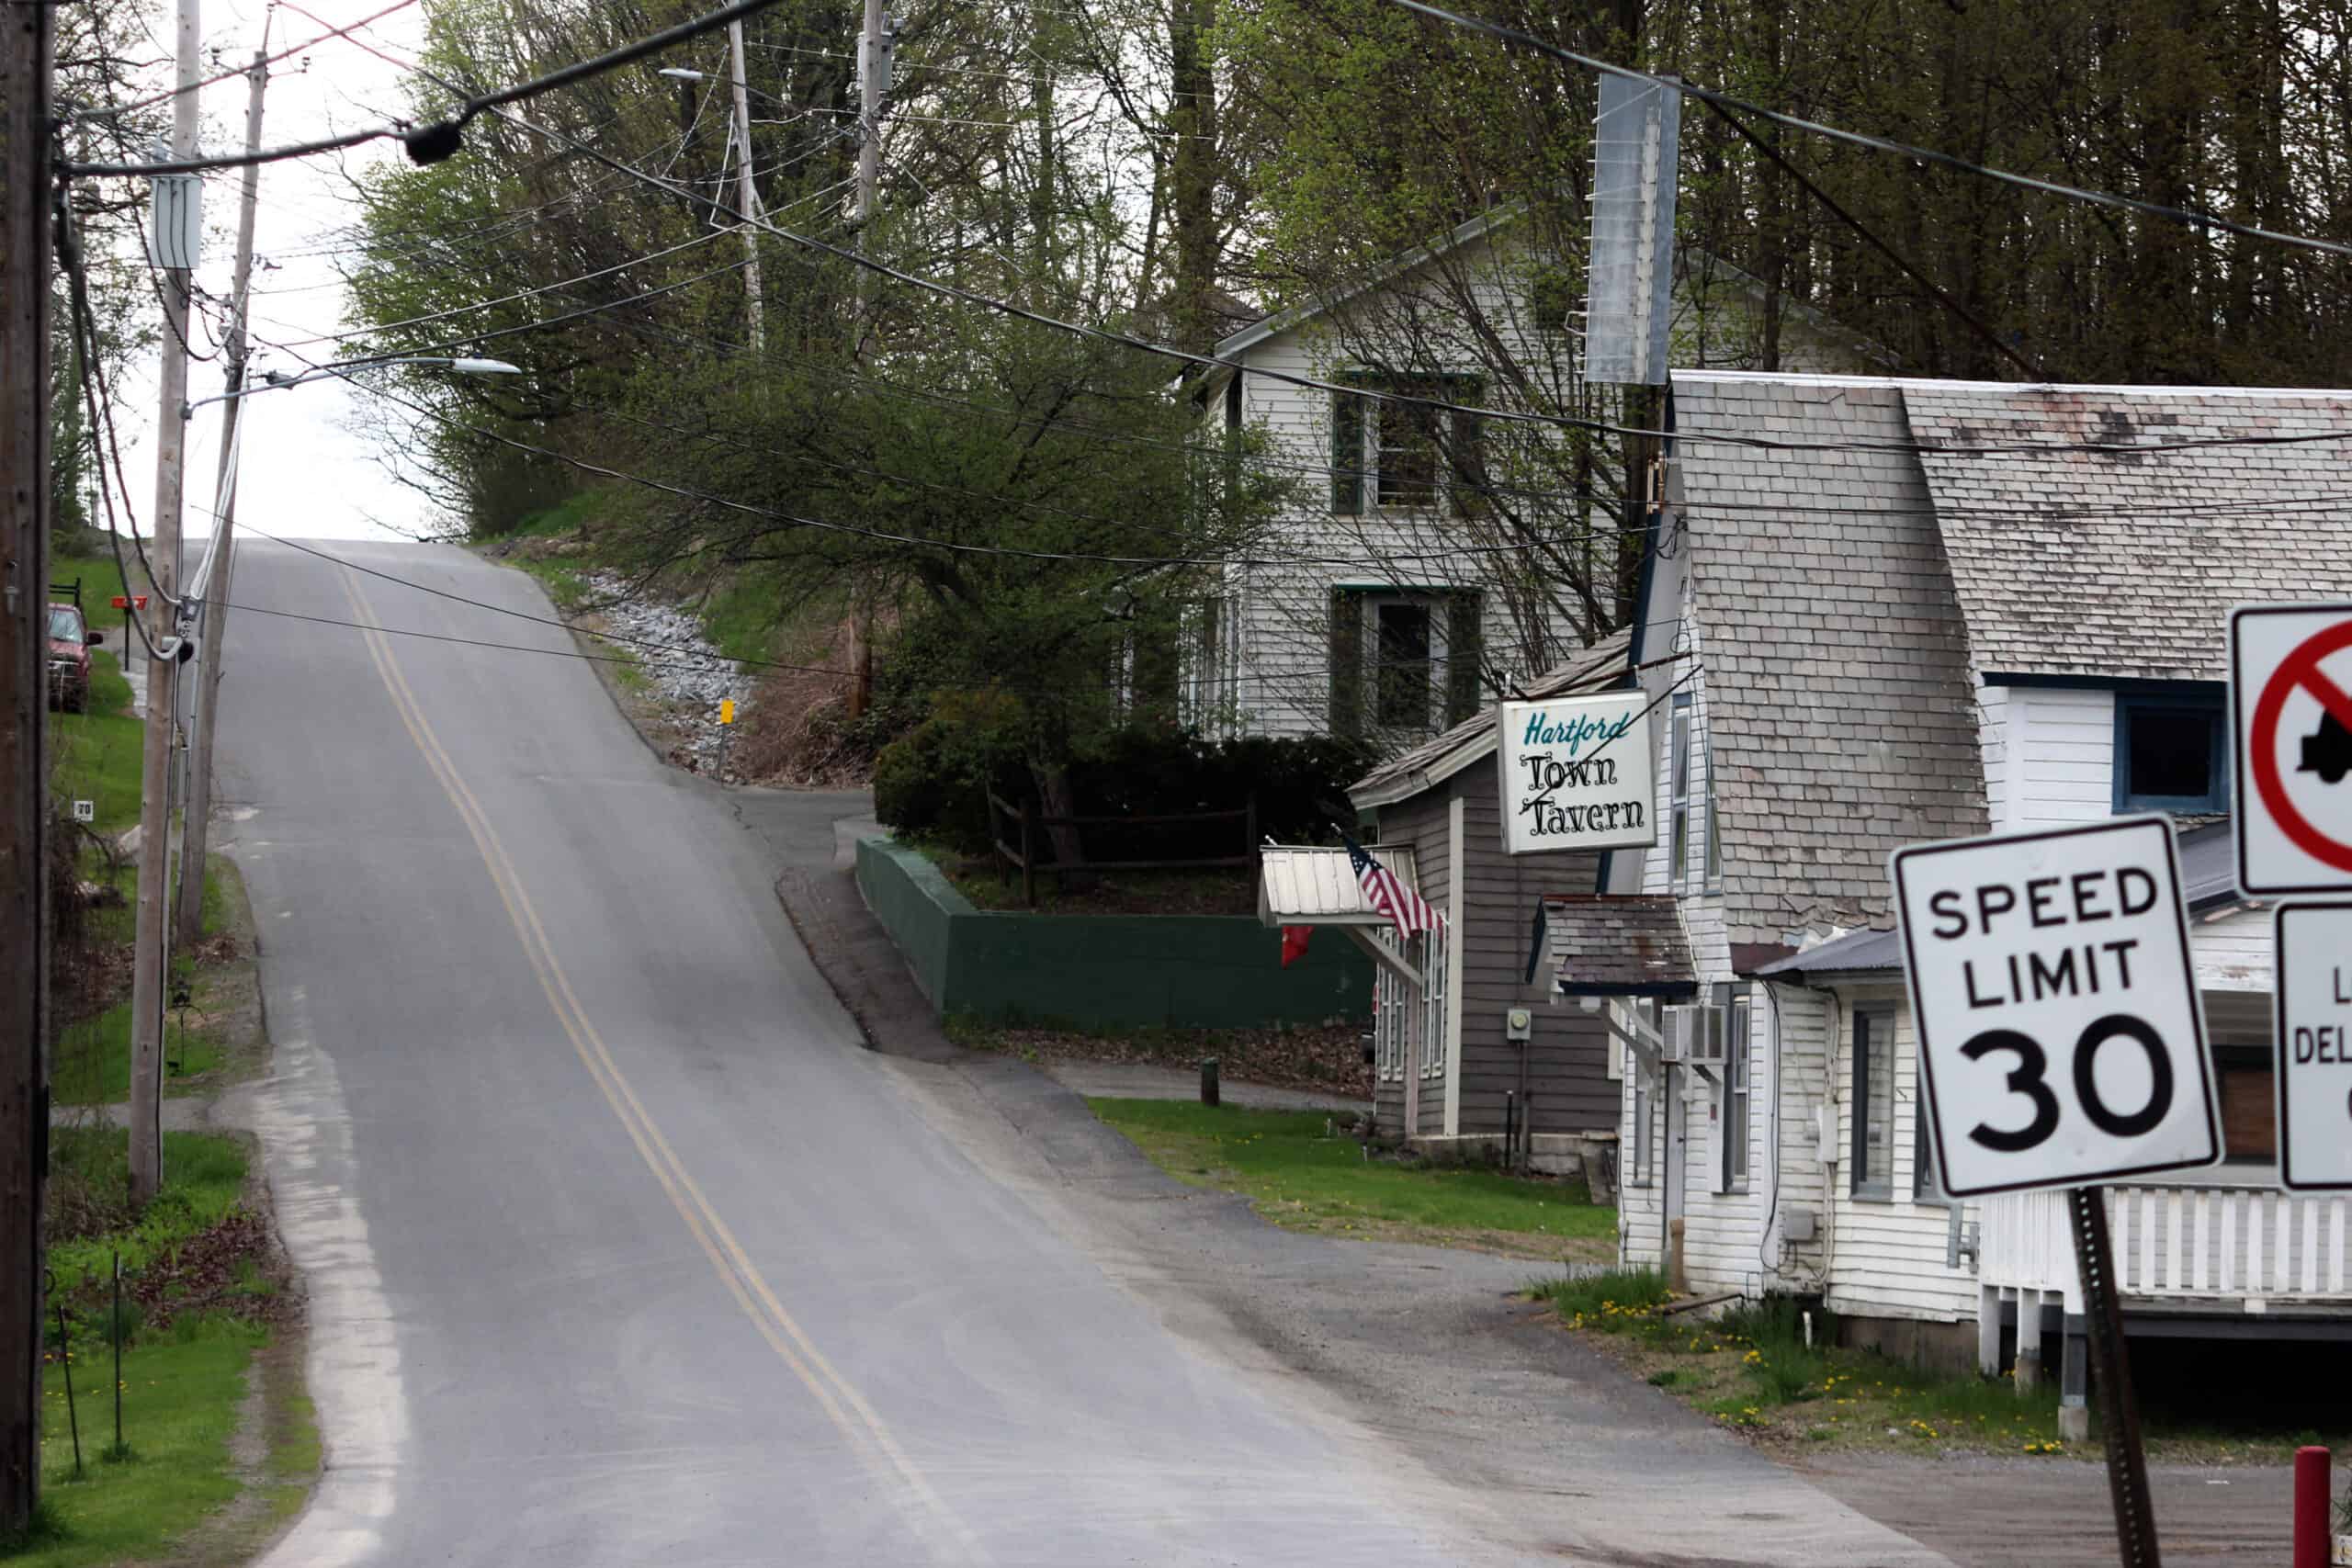
34. Washington County
- Median household income: $68,703
- Poverty rate: 11.4%
- 5-yr. avg. unemployment rate: 5.1%
- Population: 61,310
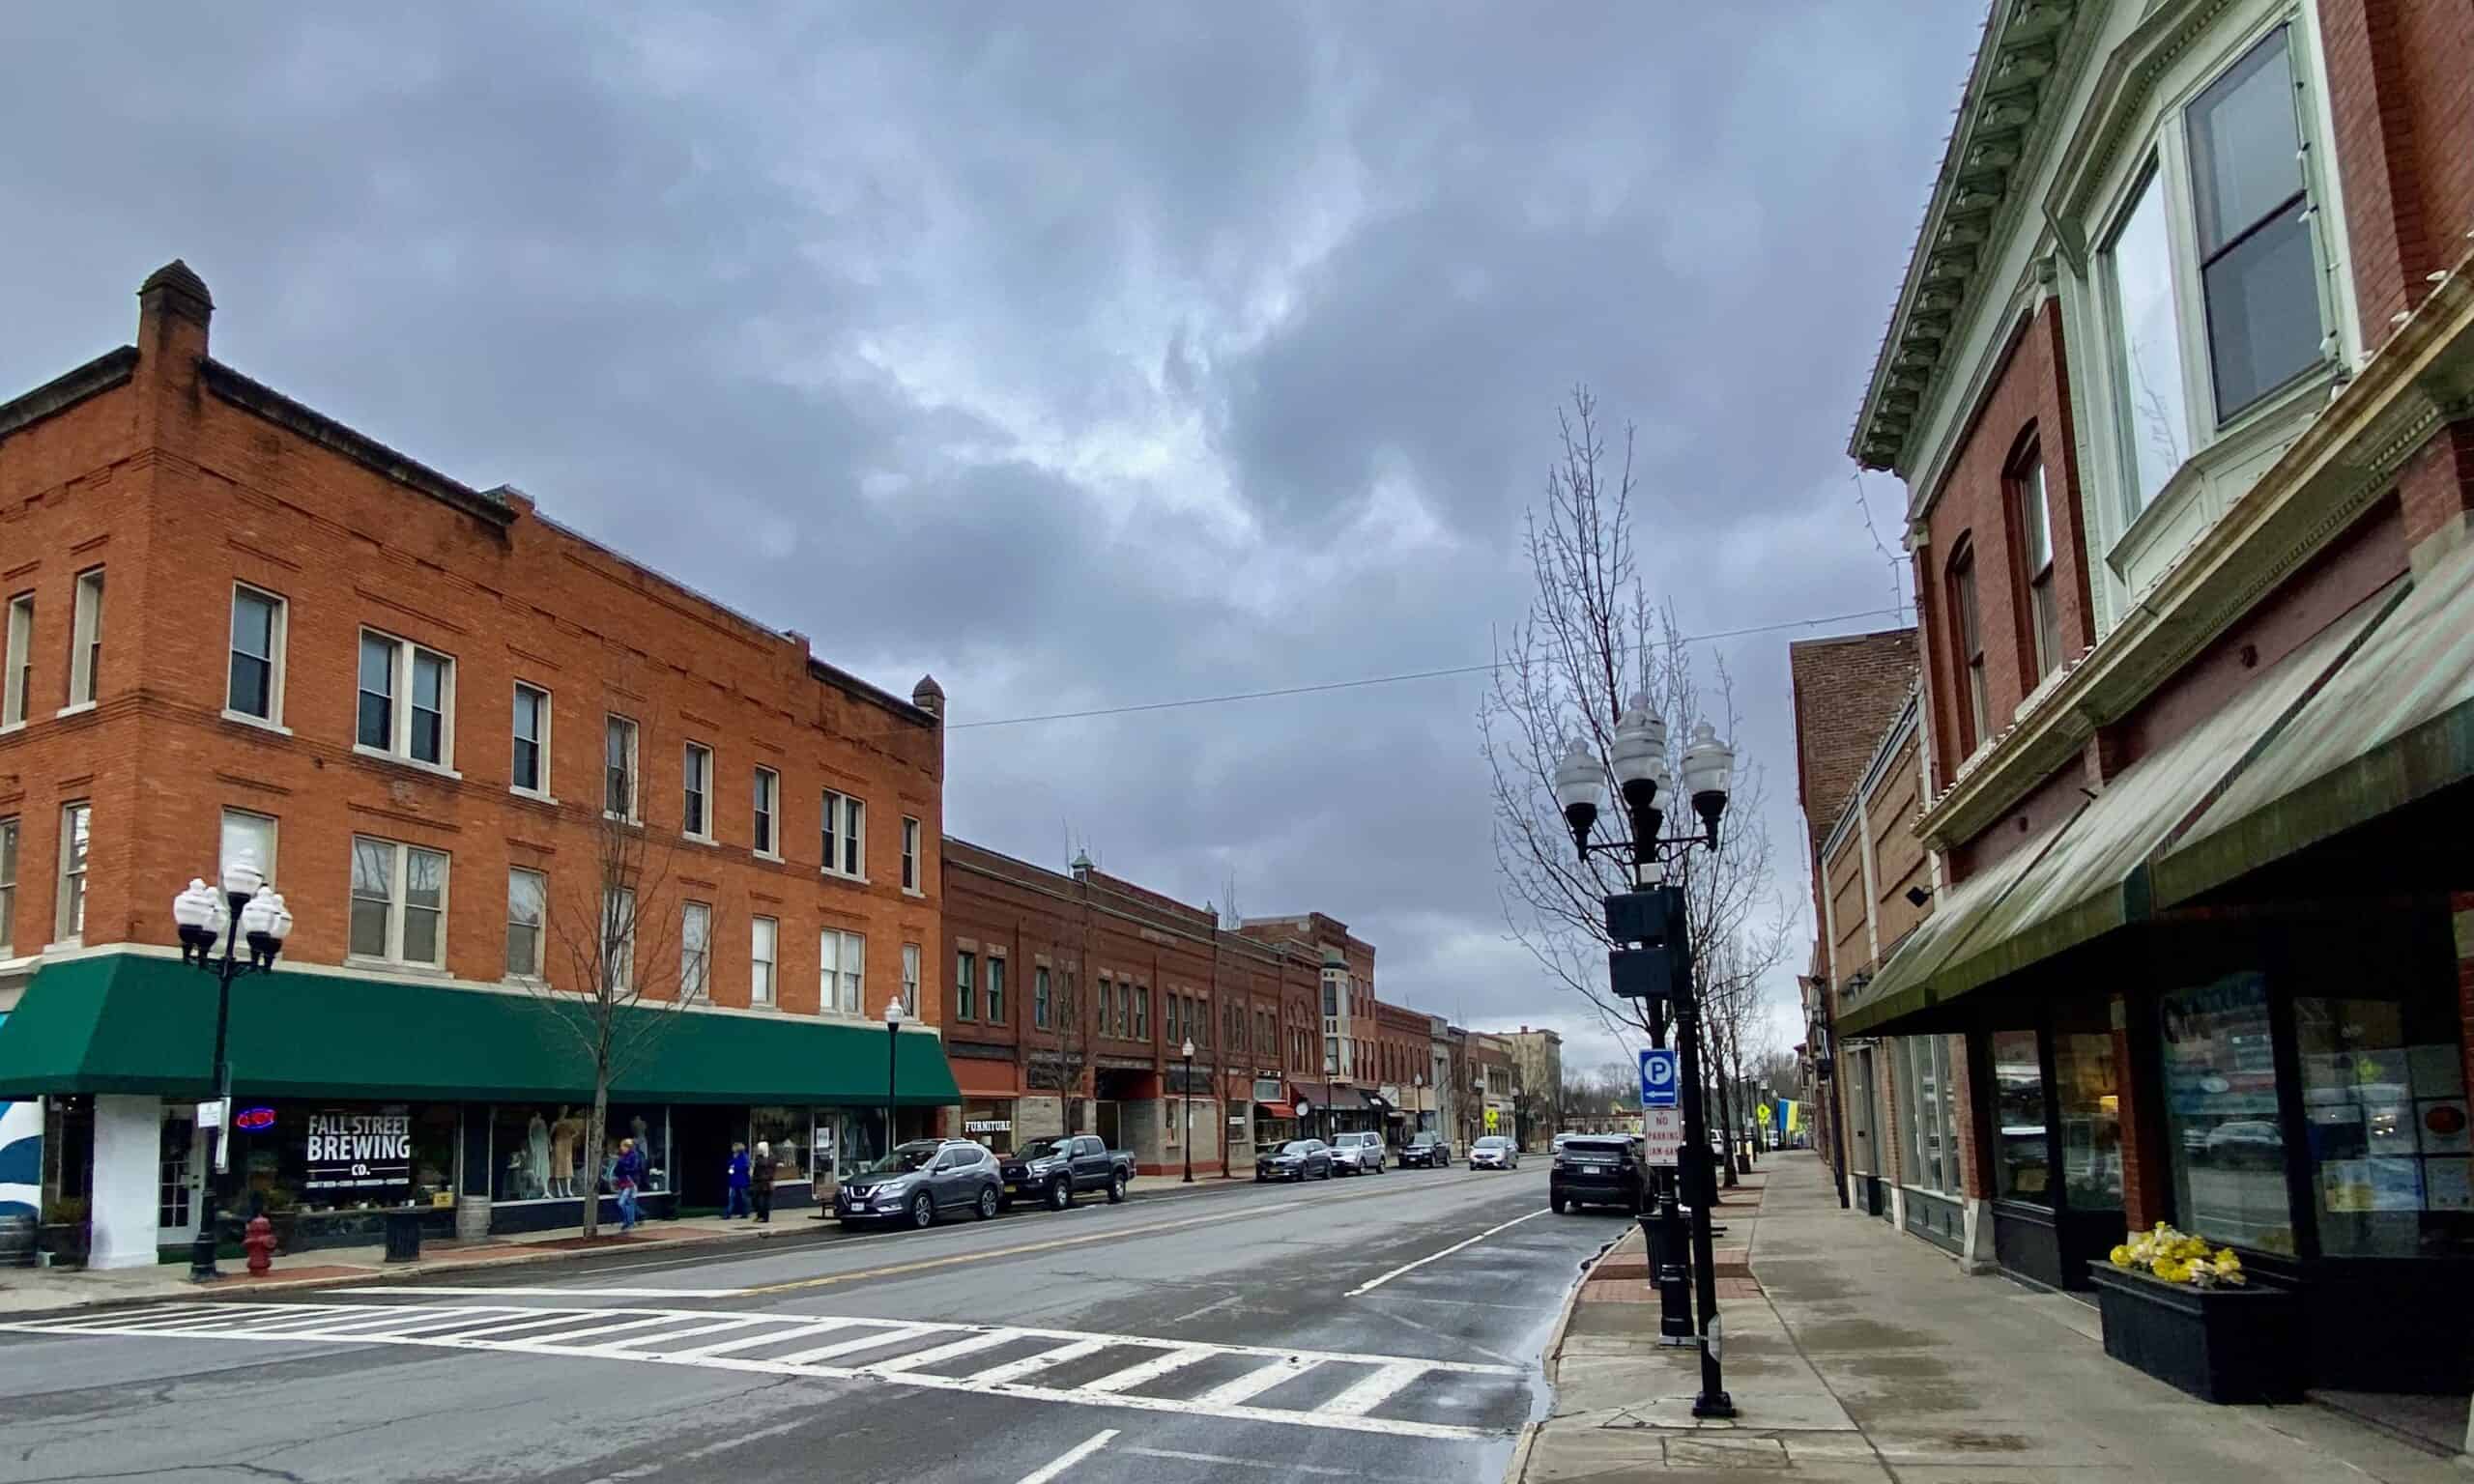
33. Genesee County
- Median household income: $68,178
- Poverty rate: 10.4%
- 5-yr. avg. unemployment rate: 4.7%
- Population: 58,204
32. Herkimer County

- Median household income: $68,104
- Poverty rate: 12.1%
- 5-yr. avg. unemployment rate: 4.2%
- Population: 60,293
31. Essex County

- Median household income: $68,090
- Poverty rate: 10.4%
- 5-yr. avg. unemployment rate: 5.1%
- Population: 37,314
30. Erie County

- Median household income: $68,014
- Poverty rate: 13.8%
- 5-yr. avg. unemployment rate: 4.9%
- Population: 951,232
29. Sullivan County

- Median household income: $67,841
- Poverty rate: 14.8%
- 5-yr. avg. unemployment rate: 7.2%
- Population: 78,725
28. Clinton County
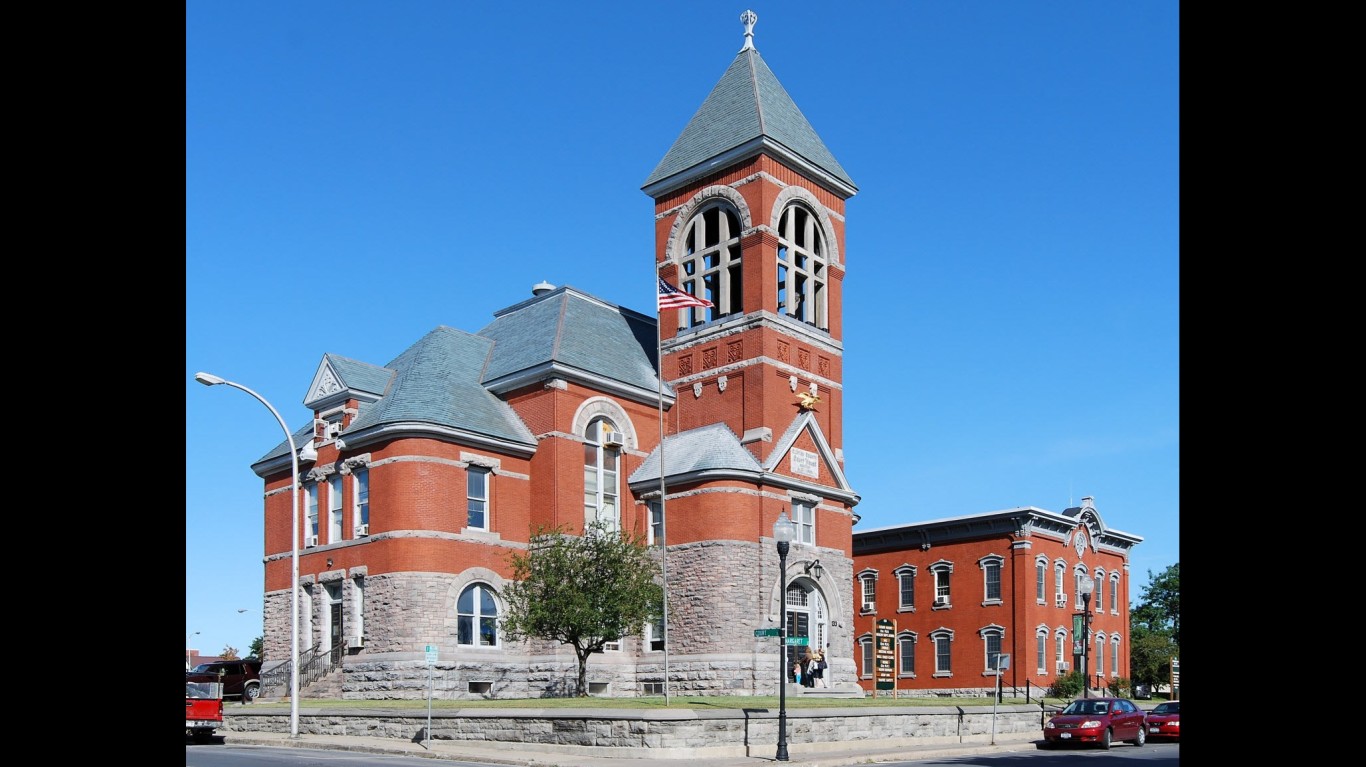
- Median household income: $67,097
- Poverty rate: 13.0%
- 5-yr. avg. unemployment rate: 4.6%
- Population: 79,839
27. Hamilton County

- Median household income: $66,891
- Poverty rate: 10.7%
- 5-yr. avg. unemployment rate: 4.9%
- Population: 5,090
26. Oneida County
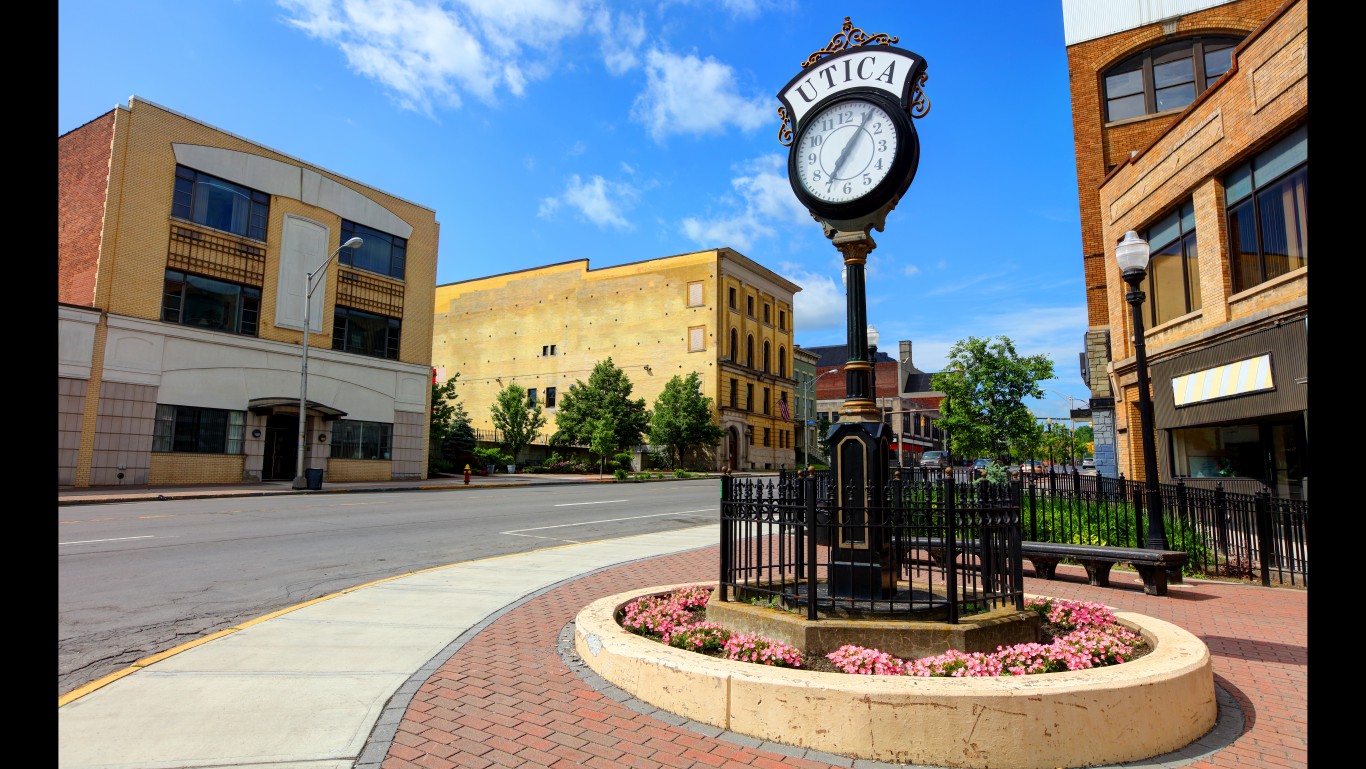
- Median household income: $66,402
- Poverty rate: 14.4%
- 5-yr. avg. unemployment rate: 4.4%
- Population: 231,055
25. Niagara County

- Median household income: $65,882
- Poverty rate: 13.0%
- 5-yr. avg. unemployment rate: 5.8%
- Population: 212,230
24. Otsego County

- Median household income: $65,778
- Poverty rate: 13.0%
- 5-yr. avg. unemployment rate: 4.9%
- Population: 59,678
23. Wyoming County
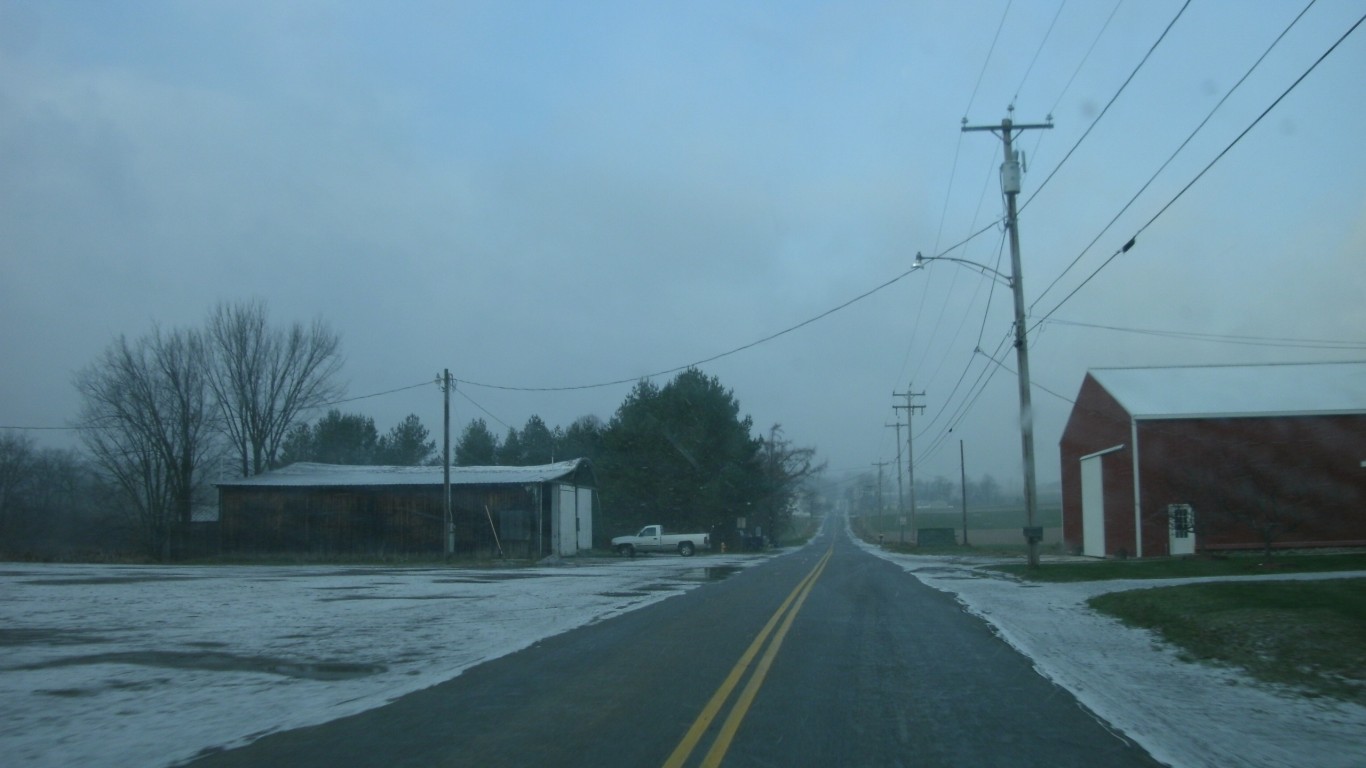
- Median household income: $65,066
- Poverty rate: 10.7%
- 5-yr. avg. unemployment rate: 4.1%
- Population: 40,338
22. Oswego County

- Median household income: $65,054
- Poverty rate: 17.1%
- 5-yr. avg. unemployment rate: 7.3%
- Population: 118,037
21. Cortland County

- Median household income: $65,029
- Poverty rate: 12.9%
- 5-yr. avg. unemployment rate: 5.4%
- Population: 46,755
20. Lewis County
- Median household income: $64,401
- Poverty rate: 13.1%
- 5-yr. avg. unemployment rate: 5.1%
- Population: 26,690
19. Seneca County
- Median household income: $64,050
- Poverty rate: 13.1%
- 5-yr. avg. unemployment rate: 4.5%
- Population: 33,651
18. Yates County
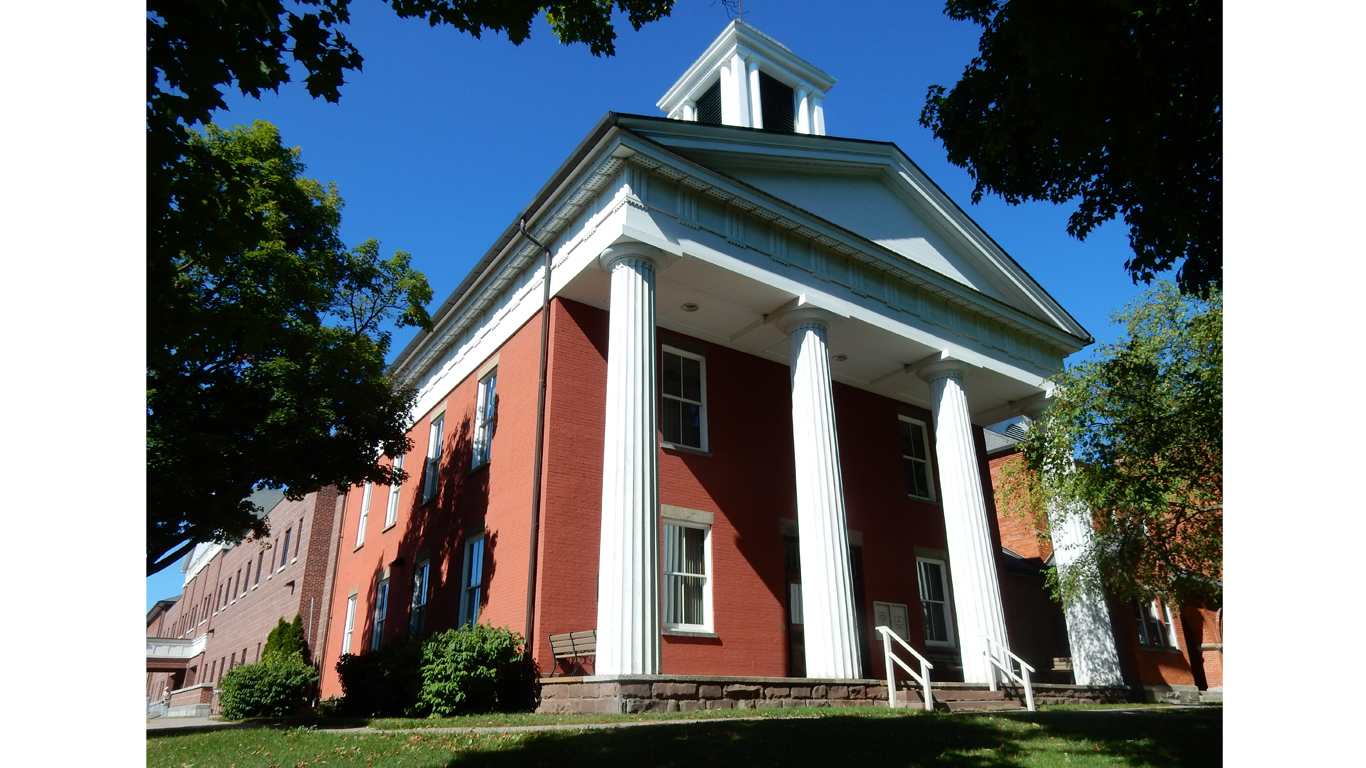
- Median household income: $63,974
- Poverty rate: 14.2%
- 5-yr. avg. unemployment rate: 3.2%
- Population: 24,713
17. Cayuga County
- Median household income: $63,227
- Poverty rate: 13.5%
- 5-yr. avg. unemployment rate: 4.3%
- Population: 76,171
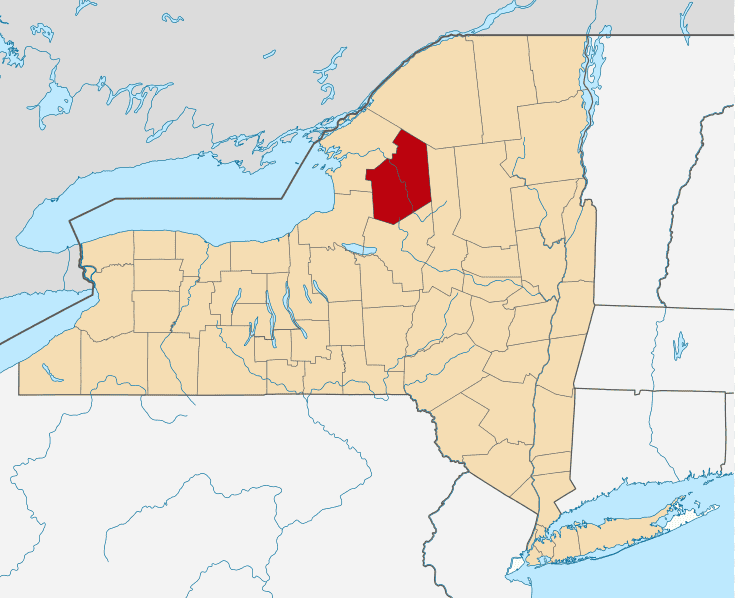
16. Jefferson County
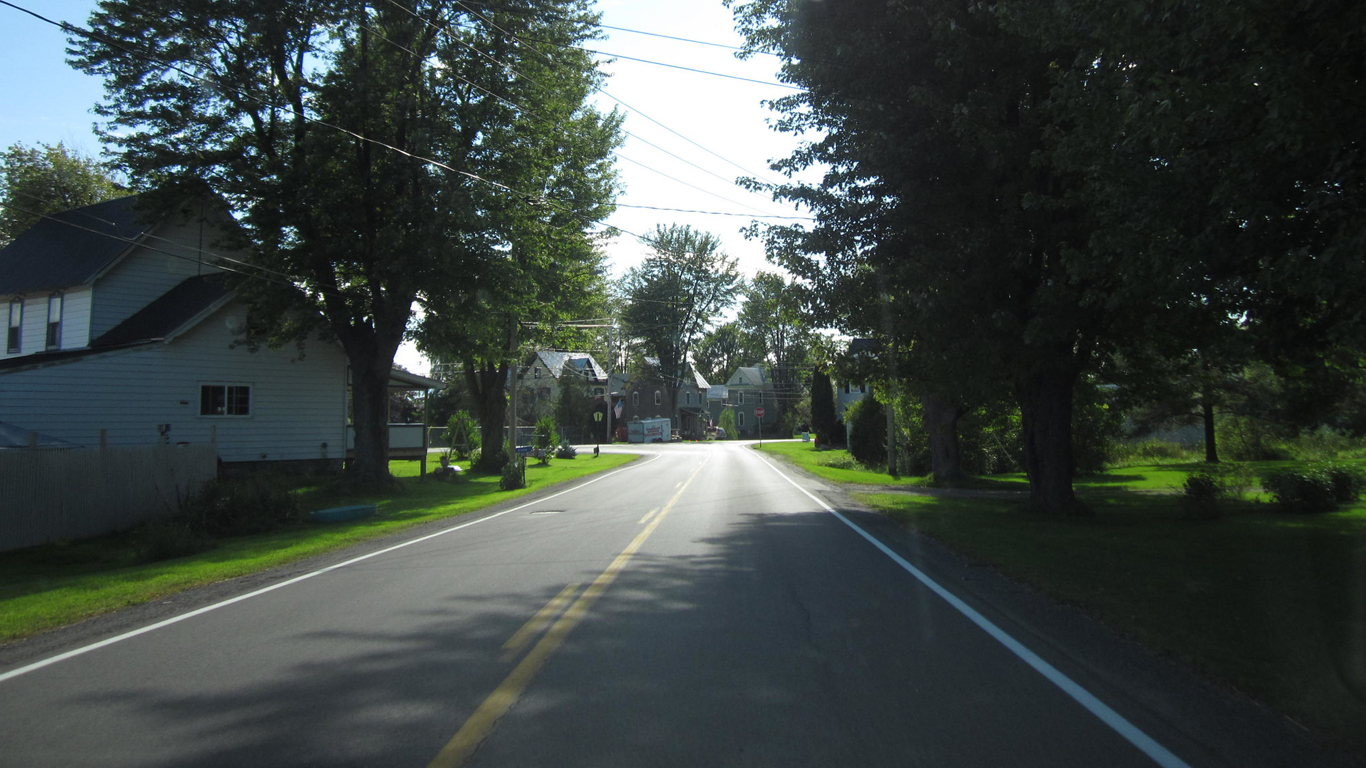
- Median household income: $62,782
- Poverty rate: 12.8%
- 5-yr. avg. unemployment rate: 5.2%
- Population: 117,445
15. Steuben County
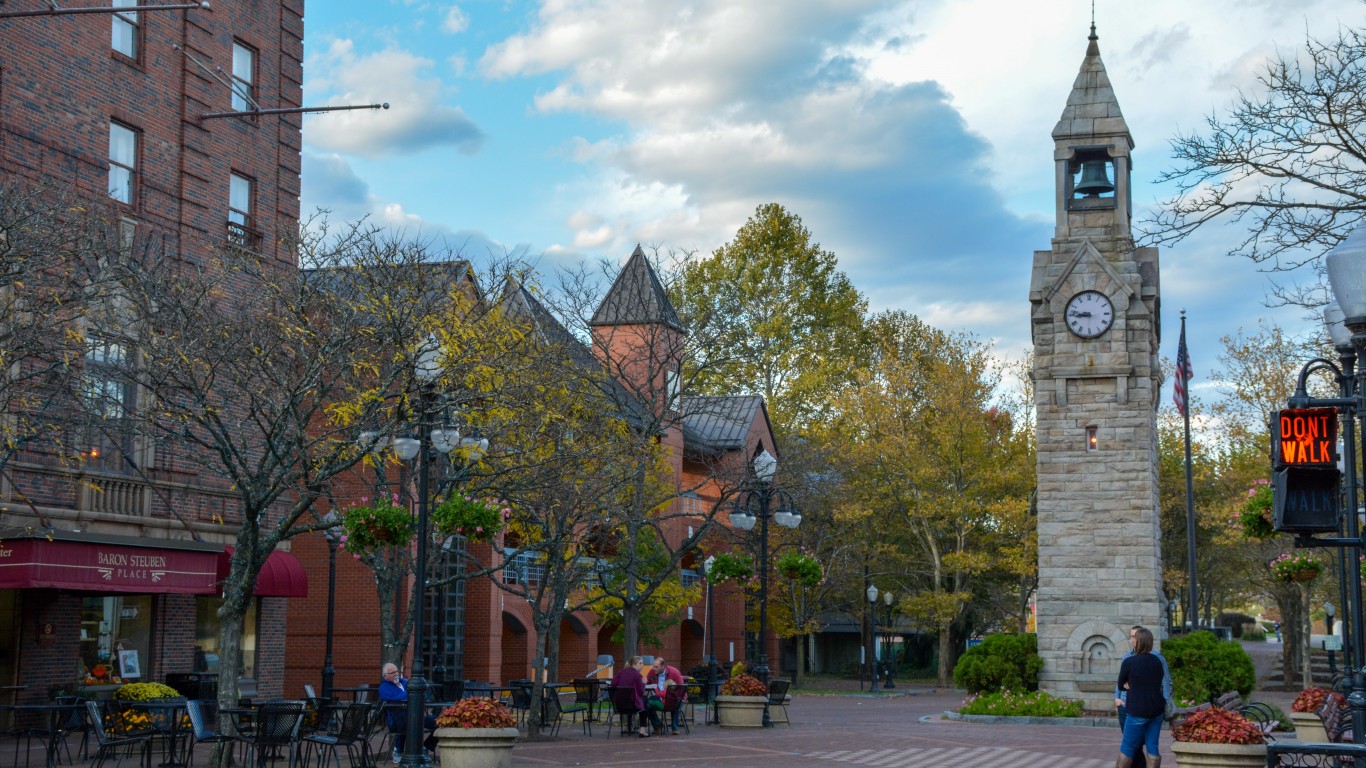
- Median household income: $62,506
- Poverty rate: 13.4%
- 5-yr. avg. unemployment rate: 6.3%
- Population: 93,584
14. Chenango County
- Median household income: $61,741
- Poverty rate: 12.4%
- 5-yr. avg. unemployment rate: 7.1%
- Population: 47,096
13. Chemung County
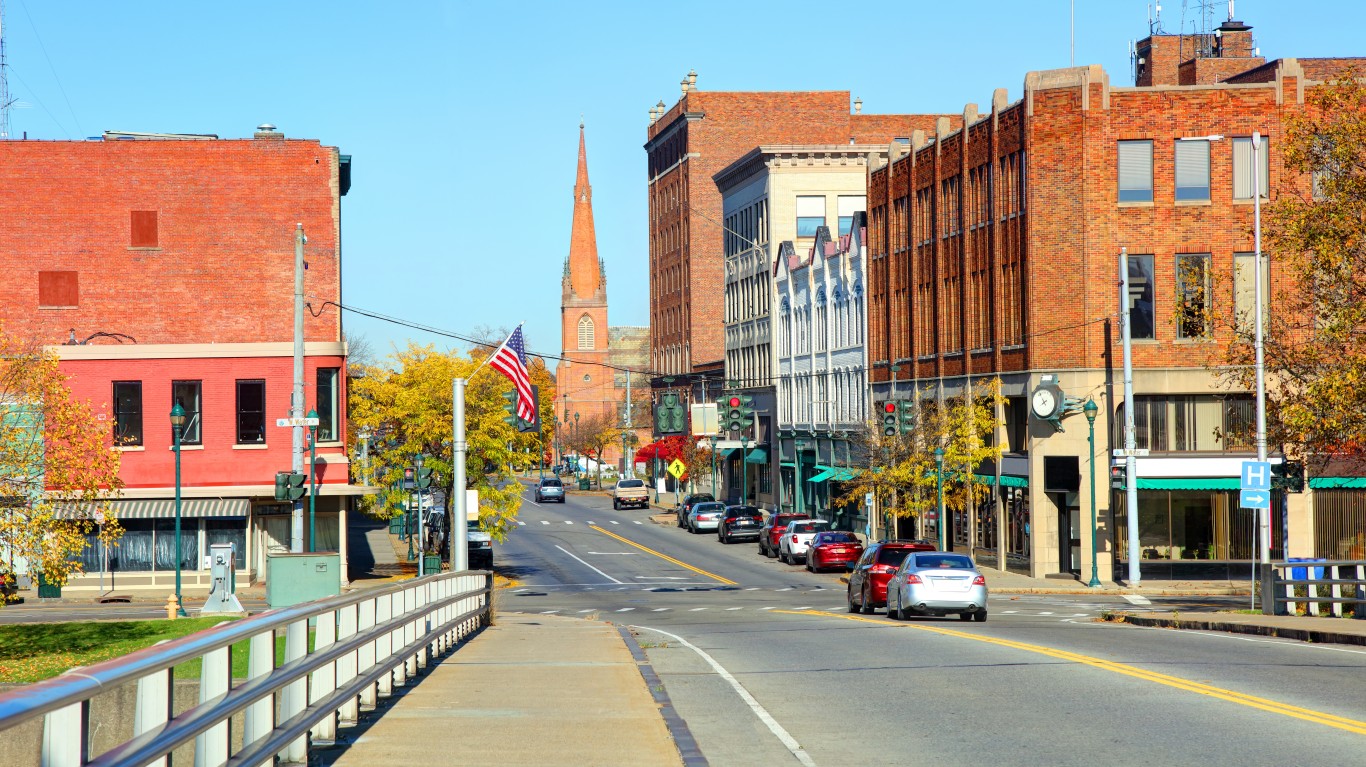
- Median household income: $61,358
- Poverty rate: 15.2%
- 5-yr. avg. unemployment rate: 6.3%
- Population: 83,584
12. Schuyler County
- Median household income: $61,316
- Poverty rate: 15.8%
- 5-yr. avg. unemployment rate: 5.6%
- Population: 17,855
11. Orleans County
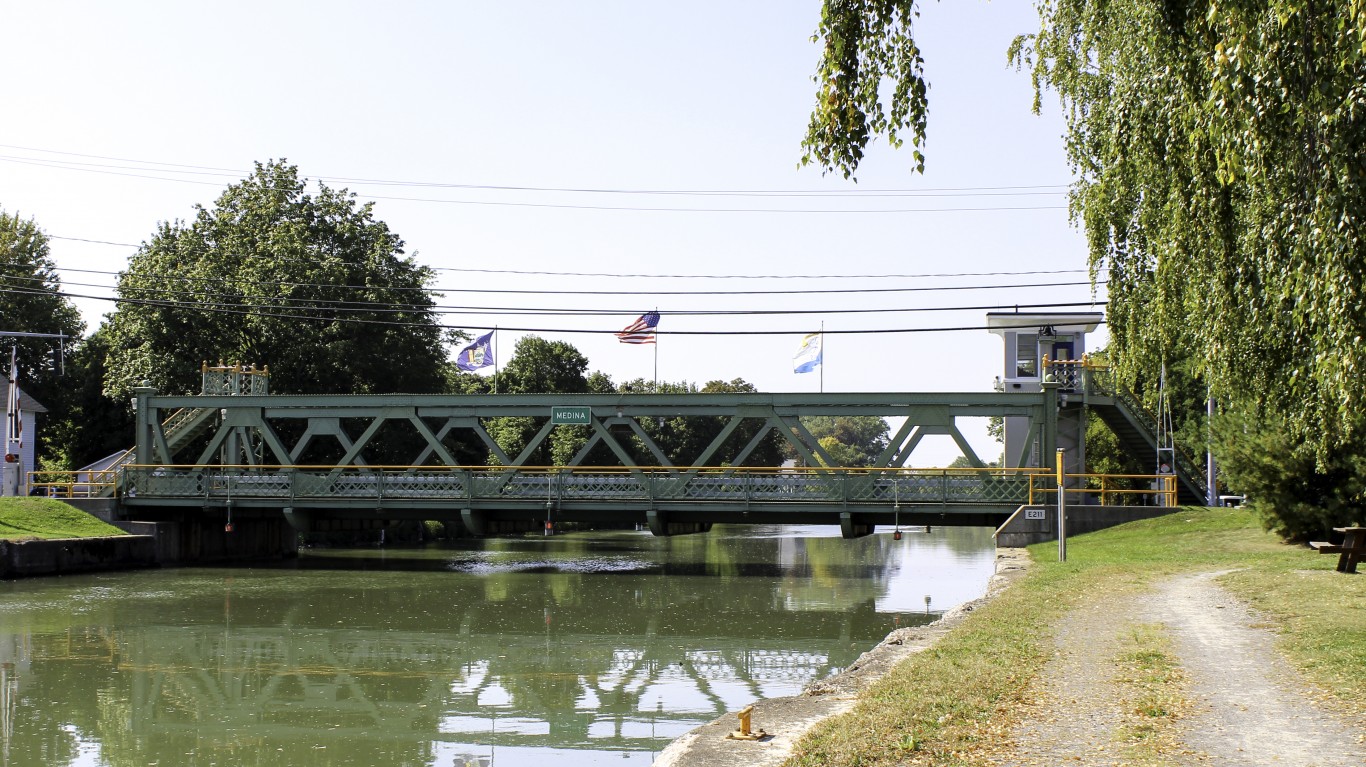
- Median household income: $61,069
- Poverty rate: 12.6%
- 5-yr. avg. unemployment rate: 6.1%
- Population: 40,148
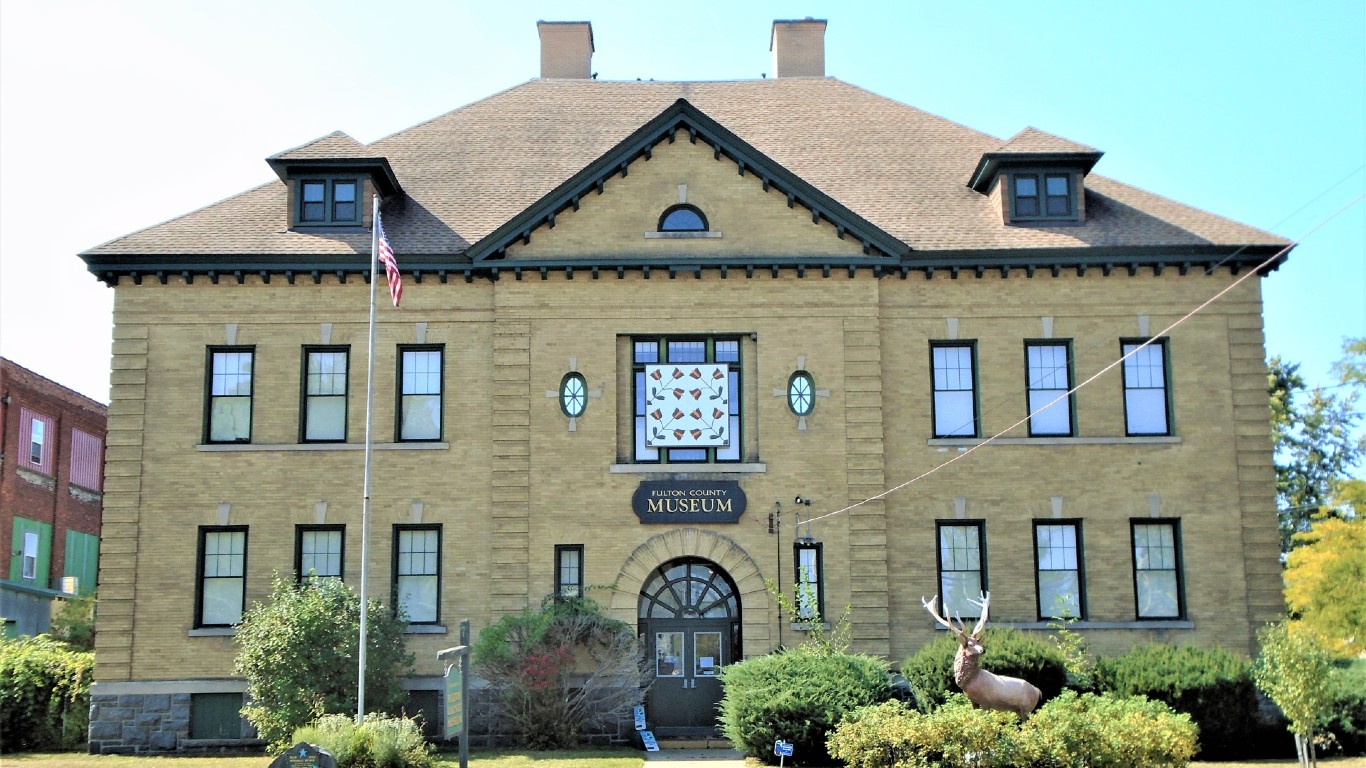
10. Fulton County
- Median household income: $60,557
- Poverty rate: 13.9%
- 5-yr. avg. unemployment rate: 4.3%
- Population: 53,280
9. Franklin County

- Median household income: $60,270
- Poverty rate: 17.9%
- 5-yr. avg. unemployment rate: 5.1%
- Population: 47,459
8. Allegany County
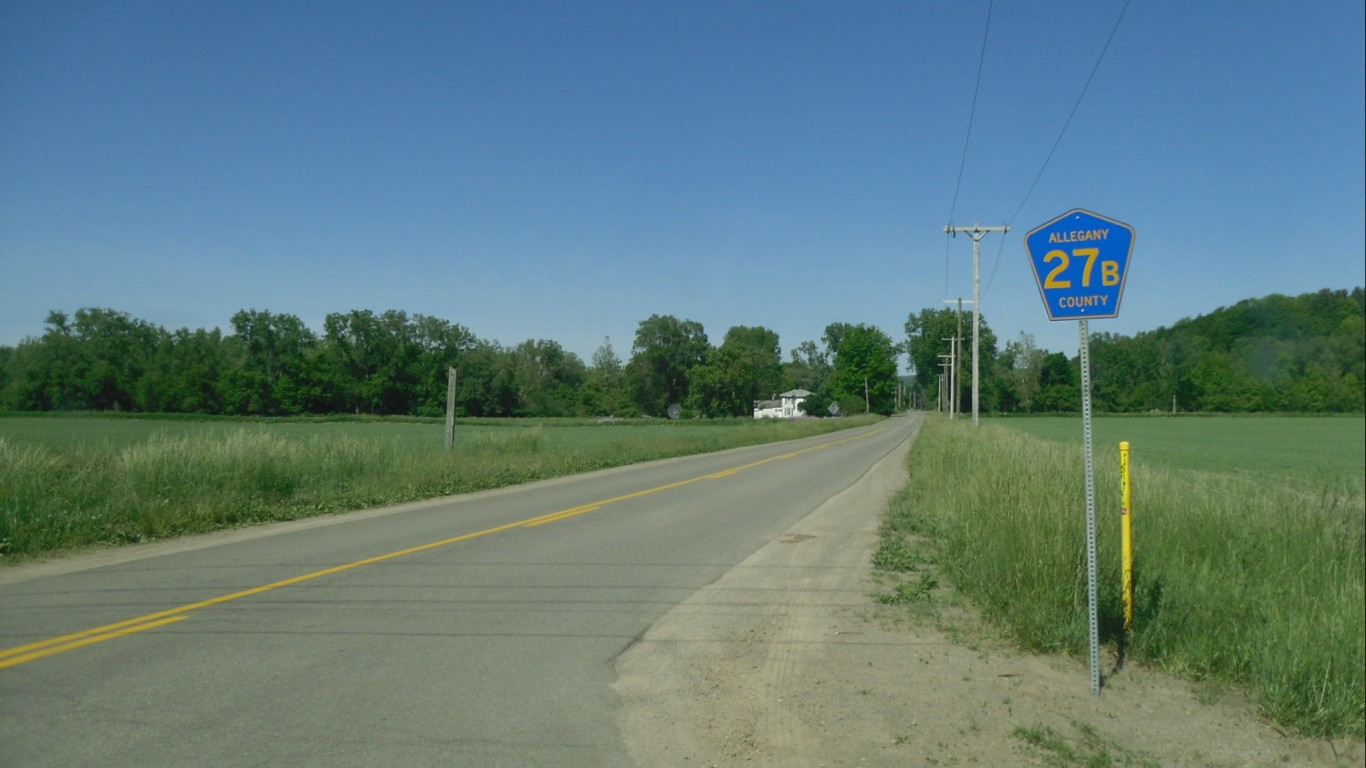
- Median household income: $58,725
- Poverty rate: 17.1%
- 5-yr. avg. unemployment rate: 7.3%
- Population: 47,222
7. St. Lawrence County
- Median household income: $58,339
- Poverty rate: 17.0%
- 5-yr. avg. unemployment rate: 6.3%
- Population: 108,670
6. Delaware County

- Median household income: $58,338
- Poverty rate: 14.8%
- 5-yr. avg. unemployment rate: 6.1%
- Population: 44,637
5. Broome County

- Median household income: $58,317
- Poverty rate: 19.1%
- 5-yr. avg. unemployment rate: 6.9%
- Population: 198,365
4. Montgomery County
- Median household income: $58,033
- Poverty rate: 15.1%
- 5-yr. avg. unemployment rate: 5.9%
- Population: 49,624
3. Cattaraugus County
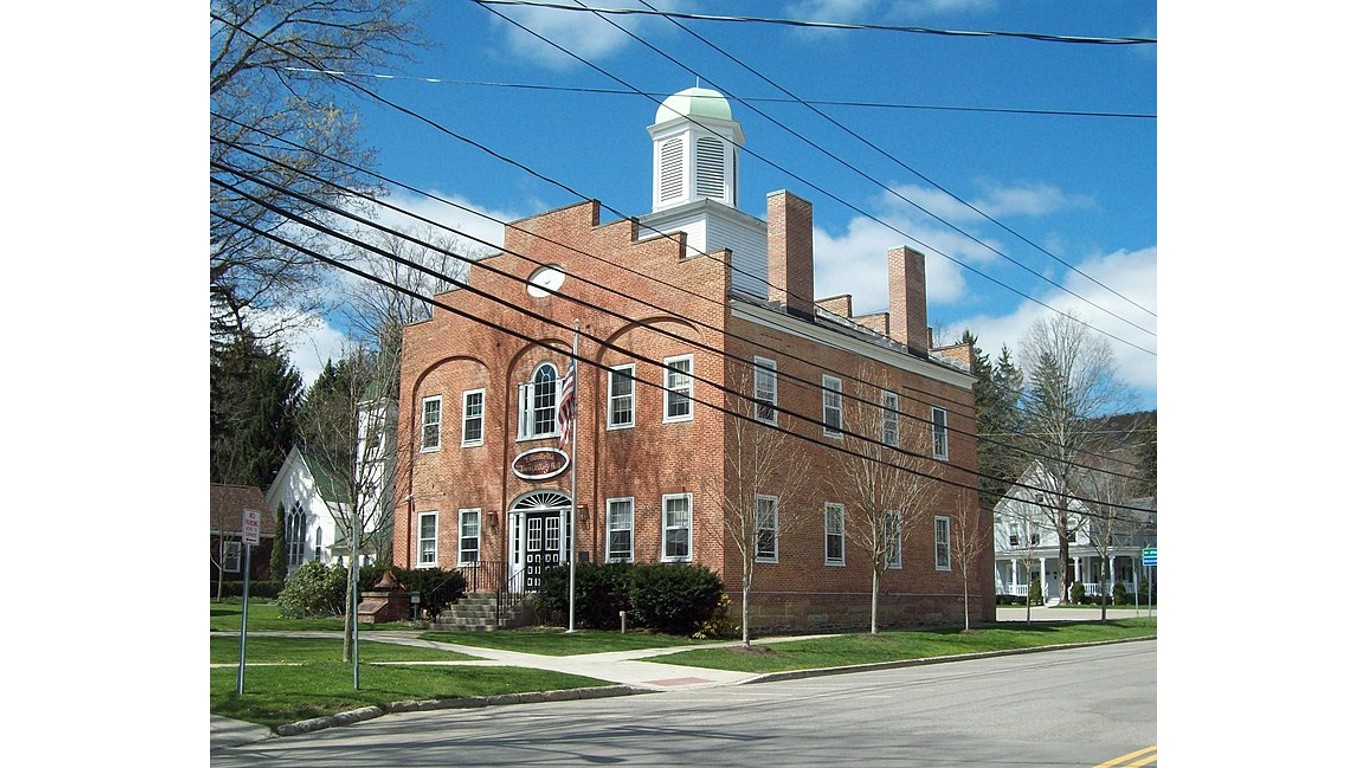
- Median household income: $56,889
- Poverty rate: 17.4%
- 5-yr. avg. unemployment rate: 5.4%
- Population: 77,000
2. Chautauqua County

- Median household income: $54,625
- Poverty rate: 17.5%
- 5-yr. avg. unemployment rate: 5.4%
- Population: 127,440
1. Bronx County

- Median household income: $47,036
- Poverty rate: 26.9%
- 5-yr. avg. unemployment rate: 11.2%
- Population: 1,443,229
| Rank | County | Median household income ($) | Poverty rate (%) | 5-yr. avg. unemployment rate (%) |
|---|---|---|---|---|
| 1 | Bronx, New York | 47,036 | 26.9 | 11.2 |
| 2 | Chautauqua, New York | 54,625 | 17.5 | 5.4 |
| 3 | Cattaraugus, New York | 56,889 | 17.4 | 5.4 |
| 4 | Montgomery, New York | 58,033 | 15.1 | 5.9 |
| 5 | Broome, New York | 58,317 | 19.1 | 6.9 |
| 6 | Delaware, New York | 58,338 | 14.8 | 6.1 |
| 7 | St. Lawrence, New York | 58,339 | 17.0 | 6.3 |
| 8 | Allegany, New York | 58,725 | 17.1 | 7.3 |
| 9 | Franklin, New York | 60,270 | 17.9 | 5.1 |
| 10 | Fulton, New York | 60,557 | 13.9 | 4.3 |
| 11 | Orleans, New York | 61,069 | 12.6 | 6.1 |
| 12 | Schuyler, New York | 61,316 | 15.8 | 5.6 |
| 13 | Chemung, New York | 61,358 | 15.2 | 6.3 |
| 14 | Chenango, New York | 61,741 | 12.4 | 7.1 |
| 15 | Steuben, New York | 62,506 | 13.4 | 6.3 |
| 16 | Jefferson, New York | 62,782 | 12.8 | 5.2 |
| 17 | Cayuga, New York | 63,227 | 13.5 | 4.3 |
| 18 | Yates, New York | 63,974 | 14.2 | 3.2 |
| 19 | Seneca, New York | 64,050 | 13.1 | 4.5 |
| 20 | Lewis, New York | 64,401 | 13.1 | 5.1 |
| 21 | Cortland, New York | 65,029 | 12.9 | 5.4 |
| 22 | Oswego, New York | 65,054 | 17.1 | 7.3 |
| 23 | Wyoming, New York | 65,066 | 10.7 | 4.1 |
| 24 | Otsego, New York | 65,778 | 13.0 | 4.9 |
| 25 | Niagara, New York | 65,882 | 13.0 | 5.8 |
| 26 | Oneida, New York | 66,402 | 14.4 | 4.4 |
| 27 | Hamilton, New York | 66,891 | 10.7 | 4.9 |
| 28 | Clinton, New York | 67,097 | 13.0 | 4.6 |
| 29 | Sullivan, New York | 67,841 | 14.8 | 7.2 |
| 30 | Erie, New York | 68,014 | 13.8 | 4.9 |
| 31 | Essex, New York | 68,090 | 10.4 | 5.1 |
| 32 | Herkimer, New York | 68,104 | 12.1 | 4.2 |
| 33 | Genesee, New York | 68,178 | 10.4 | 4.7 |
| 34 | Washington, New York | 68,703 | 11.4 | 5.1 |
| 35 | Madison, New York | 68,869 | 9.5 | 4.0 |
Get Ready To Retire (Sponsored)
Start by taking a quick retirement quiz from SmartAsset that will match you with up to 3 financial advisors that serve your area and beyond in 5 minutes, or less.
Each advisor has been vetted by SmartAsset and is held to a fiduciary standard to act in your best interests.
Here’s how it works:
1. Answer SmartAsset advisor match quiz
2. Review your pre-screened matches at your leisure. Check out the advisors’ profiles.
3. Speak with advisors at no cost to you. Have an introductory call on the phone or introduction in person and choose whom to work with in the future
Thank you for reading! Have some feedback for us?
Contact the 24/7 Wall St. editorial team.
