Incomes are rising rapidly in the United States. According to estimates from the U.S. Census Bureau, the national median household income was nearly $75,000 in 2022, up from about $69,700 in 2021. The 7.2% increase was the largest recorded year-over-year since at least the mid-1990s.
While the typical American household is earning more than ever before, incomes have not been rising fast enough to offset inflation. Throughout 2022, the average rate of inflation hit a 40-year high of 8%, four times the Federal Reserve’s 2% target rate. Accounting for the rising cost of living, real incomes in the U.S. fell by nearly 5% between 2019 and 2022.
While no one has been spared from surging prices, Americans on the low end of the income spectrum have bore the brunt. During inflationary periods, higher-income Americans can cut back on spending and reduce the impact of rising costs. Meanwhile, lower earning Americans, who spend a larger share of their income on necessities such as food, housing, and gas, cannot.
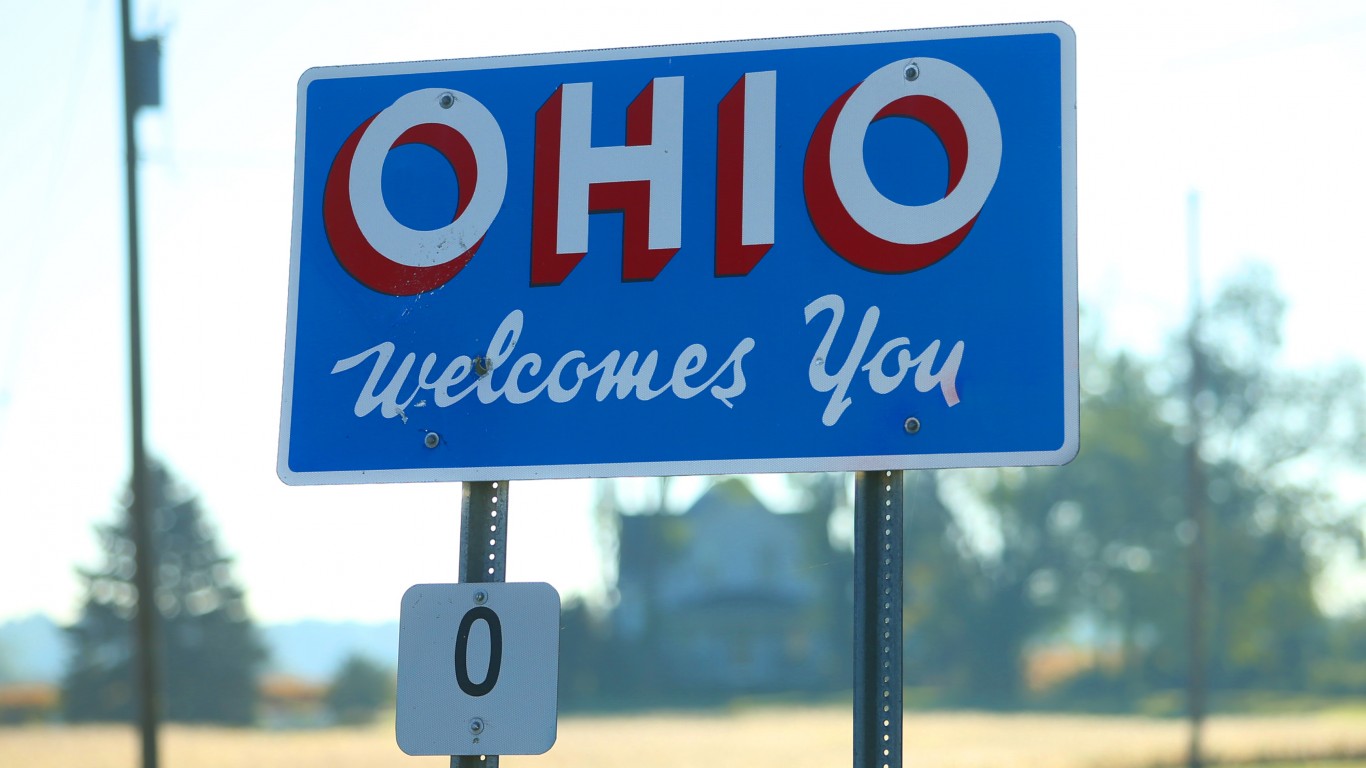
Ohio has a median household income of $66,990. But in many parts of the state, the typical household earns far less than the statewide median.
Using five-year estimates from the U.S. Census Bureau’s 2022 American Community Survey, 24/7 Wall St. identified the 35 poorest counties in Ohio. Counties in the state are ranked on median household income. Population, poverty, and unemployment data are also five-year estimates from the 2022 ACS.
Among the counties on this list, median household incomes are anywhere from about $6,900 to $27,800 below the statewide median. In many of these counties, levels of financial hardship are underscored by widespread poverty. In all but three counties on this list, the share of residents living below the poverty line exceeds the 13.3% statewide poverty rate.
These are the poorest counties in Ohio.
35. Cuyahoga County

- Median household income: $60,074
- Poverty rate: 16.5%
- 5-yr. avg. unemployment rate: 7.2%
- Population: 1,256,620
34. Carroll County

- Median household income: $59,872
- Poverty rate: 12.2%
- 5-yr. avg. unemployment rate: 3.9%
- Population: 26,761
33. Washington County

- Median household income: $59,053
- Poverty rate: 14.1%
- 5-yr. avg. unemployment rate: 5.2%
- Population: 59,639
32. Hocking County

- Median household income: $59,007
- Poverty rate: 16.6%
- 5-yr. avg. unemployment rate: 4.7%
- Population: 28,104
31. Allen County

- Median household income: $58,976
- Poverty rate: 12.3%
- 5-yr. avg. unemployment rate: 6.1%
- Population: 102,087
30. Clark County

- Median household income: $58,954
- Poverty rate: 15.6%
- 5-yr. avg. unemployment rate: 6.8%
- Population: 135,877
29. Ross County

- Median household income: $58,048
- Poverty rate: 16.1%
- 5-yr. avg. unemployment rate: 5.7%
- Population: 76,957
28. Lucas County

- Median household income: $57,265
- Poverty rate: 17.8%
- 5-yr. avg. unemployment rate: 6.8%
- Population: 430,014
27. Belmont County

- Median household income: $56,943
- Poverty rate: 14.0%
- 5-yr. avg. unemployment rate: 6.0%
- Population: 66,554
26. Muskingum County

- Median household income: $56,810
- Poverty rate: 15.6%
- 5-yr. avg. unemployment rate: 4.6%
- Population: 86,393
25. Fayette County

- Median household income: $56,773
- Poverty rate: 15.8%
- 5-yr. avg. unemployment rate: 4.3%
- Population: 28,901
24. Richland County

- Median household income: $56,557
- Poverty rate: 13.9%
- 5-yr. avg. unemployment rate: 4.8%
- Population: 125,008
23. Jackson County

- Median household income: $56,549
- Poverty rate: 17.4%
- 5-yr. avg. unemployment rate: 5.9%
- Population: 32,563
22. Hardin County

- Median household income: $55,876
- Poverty rate: 18.2%
- 5-yr. avg. unemployment rate: 4.7%
- Population: 30,622
21. Gallia County

- Median household income: $55,533
- Poverty rate: 17.2%
- 5-yr. avg. unemployment rate: 4.1%
- Population: 29,276
20. Columbiana County

- Median household income: $55,473
- Poverty rate: 13.2%
- 5-yr. avg. unemployment rate: 4.9%
- Population: 101,723
19. Monroe County

- Median household income: $55,381
- Poverty rate: 13.9%
- 5-yr. avg. unemployment rate: 5.5%
- Population: 13,401
18. Marion County

- Median household income: $55,106
- Poverty rate: 16.1%
- 5-yr. avg. unemployment rate: 5.7%
- Population: 65,366
17. Mahoning County

- Median household income: $54,279
- Poverty rate: 17.6%
- 5-yr. avg. unemployment rate: 7.2%
- Population: 227,979
16. Harrison County

- Median household income: $54,056
- Poverty rate: 15.4%
- 5-yr. avg. unemployment rate: 4.5%
- Population: 14,528
15. Guernsey County

- Median household income: $53,901
- Poverty rate: 17.0%
- 5-yr. avg. unemployment rate: 4.6%
- Population: 38,409
14. Ashtabula County

- Median household income: $53,663
- Poverty rate: 18.0%
- 5-yr. avg. unemployment rate: 7.6%
- Population: 97,666
13. Trumbull County

- Median household income: $53,537
- Poverty rate: 17.1%
- 5-yr. avg. unemployment rate: 4.8%
- Population: 201,749
12. Jefferson County

- Median household income: $53,124
- Poverty rate: 18.2%
- 5-yr. avg. unemployment rate: 5.5%
- Population: 65,280
11. Crawford County

- Median household income: $52,486
- Poverty rate: 14.1%
- 5-yr. avg. unemployment rate: 5.5%
- Population: 41,861
10. Coshocton County

- Median household income: $52,048
- Poverty rate: 18.9%
- 5-yr. avg. unemployment rate: 6.1%
- Population: 36,629
9. Lawrence County

- Median household income: $51,846
- Poverty rate: 17.9%
- 5-yr. avg. unemployment rate: 3.8%
- Population: 57,994
8. Noble County

- Median household income: $51,547
- Poverty rate: 16.6%
- 5-yr. avg. unemployment rate: 4.5%
- Population: 14,216
7. Morgan County

- Median household income: $51,056
- Poverty rate: 16.6%
- 5-yr. avg. unemployment rate: 4.9%
- Population: 13,851
6. Vinton County
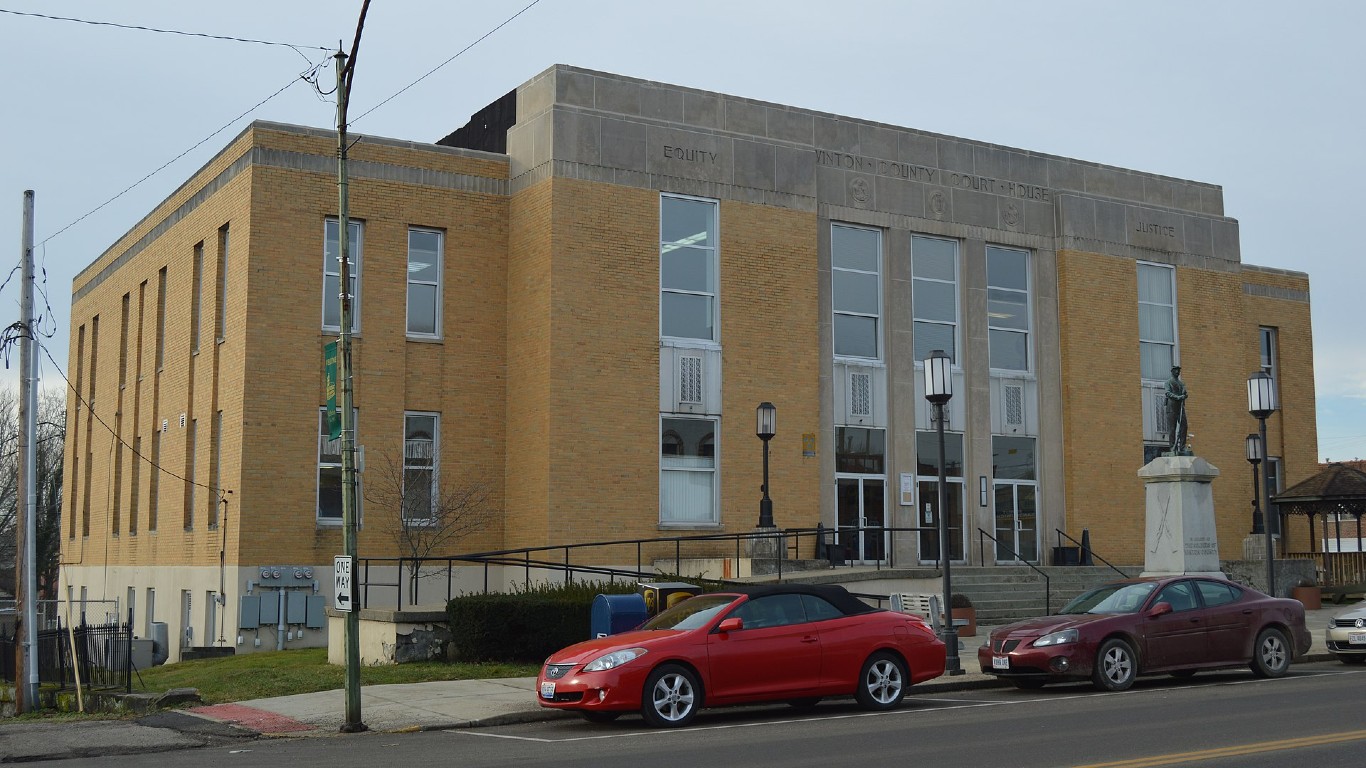
- Median household income: $50,967
- Poverty rate: 19.1%
- 5-yr. avg. unemployment rate: 3.6%
- Population: 12,790
5. Pike County

- Median household income: $50,832
- Poverty rate: 19.8%
- 5-yr. avg. unemployment rate: 5.2%
- Population: 27,151
4. Athens County
- Median household income: $48,750
- Poverty rate: 24.4%
- 5-yr. avg. unemployment rate: 5.7%
- Population: 61,276
3. Scioto County

- Median household income: $46,360
- Poverty rate: 23.8%
- 5-yr. avg. unemployment rate: 7.5%
- Population: 73,716
2. Meigs County

- Median household income: $46,255
- Poverty rate: 19.6%
- 5-yr. avg. unemployment rate: 6.4%
- Population: 22,242
1. Adams County

- Median household income: $46,234
- Poverty rate: 19.6%
- 5-yr. avg. unemployment rate: 5.8%
- Population: 27,509
| Rank | County | Median household income ($) | Poverty rate (%) | 5-yr. avg. unemployment rate (%) |
|---|---|---|---|---|
| 1 | Adams, Ohio | 46,234 | 19.6 | 5.8 |
| 2 | Meigs, Ohio | 46,255 | 19.6 | 6.4 |
| 3 | Scioto, Ohio | 46,360 | 23.8 | 7.5 |
| 4 | Athens, Ohio | 48,750 | 24.4 | 5.7 |
| 5 | Pike, Ohio | 50,832 | 19.8 | 5.2 |
| 6 | Vinton, Ohio | 50,967 | 19.1 | 3.6 |
| 7 | Morgan, Ohio | 51,056 | 16.6 | 4.9 |
| 8 | Noble, Ohio | 51,547 | 16.6 | 4.5 |
| 9 | Lawrence, Ohio | 51,846 | 17.9 | 3.8 |
| 10 | Coshocton, Ohio | 52,048 | 18.9 | 6.1 |
| 11 | Crawford, Ohio | 52,486 | 14.1 | 5.5 |
| 12 | Jefferson, Ohio | 53,124 | 18.2 | 5.5 |
| 13 | Trumbull, Ohio | 53,537 | 17.1 | 4.8 |
| 14 | Ashtabula, Ohio | 53,663 | 18.0 | 7.6 |
| 15 | Guernsey, Ohio | 53,901 | 17.0 | 4.6 |
| 16 | Harrison, Ohio | 54,056 | 15.4 | 4.5 |
| 17 | Mahoning, Ohio | 54,279 | 17.6 | 7.2 |
| 18 | Marion, Ohio | 55,106 | 16.1 | 5.7 |
| 19 | Monroe, Ohio | 55,381 | 13.9 | 5.5 |
| 20 | Columbiana, Ohio | 55,473 | 13.2 | 4.9 |
| 21 | Gallia, Ohio | 55,533 | 17.2 | 4.1 |
| 22 | Hardin, Ohio | 55,876 | 18.2 | 4.7 |
| 23 | Jackson, Ohio | 56,549 | 17.4 | 5.9 |
| 24 | Richland, Ohio | 56,557 | 13.9 | 4.8 |
| 25 | Fayette, Ohio | 56,773 | 15.8 | 4.3 |
| 26 | Muskingum, Ohio | 56,810 | 15.6 | 4.6 |
| 27 | Belmont, Ohio | 56,943 | 14.0 | 6.0 |
| 28 | Lucas, Ohio | 57,265 | 17.8 | 6.8 |
| 29 | Ross, Ohio | 58,048 | 16.1 | 5.7 |
| 30 | Clark, Ohio | 58,954 | 15.6 | 6.8 |
| 31 | Allen, Ohio | 58,976 | 12.3 | 6.1 |
| 32 | Hocking, Ohio | 59,007 | 16.6 | 4.7 |
| 33 | Washington, Ohio | 59,053 | 14.1 | 5.2 |
| 34 | Carroll, Ohio | 59,872 | 12.2 | 3.9 |
| 35 | Cuyahoga, Ohio | 60,074 | 16.5 | 7.2 |
Are You Still Paying With a Debit Card?
The average American spends $17,274 on debit cards a year, and it’s a HUGE mistake. First, debit cards don’t have the same fraud protections as credit cards. Once your money is gone, it’s gone. But more importantly you can actually get something back from this spending every time you swipe.
Issuers are handing out wild bonuses right now. With some you can earn up to 5% back on every purchase. That’s like getting a 5% discount on everything you buy!
Our top pick is kind of hard to imagine. Not only does it pay up to 5% back, it also includes a $200 cash back reward in the first six months, a 0% intro APR, and…. $0 annual fee. It’s quite literally free money for any one that uses a card regularly. Click here to learn more!
Flywheel Publishing has partnered with CardRatings to provide coverage of credit card products. Flywheel Publishing and CardRatings may receive a commission from card issuers.
Thank you for reading! Have some feedback for us?
Contact the 24/7 Wall St. editorial team.
Latest from 24/7


Our expert who first called NVIDIA in 2009 is predicting 2025 will see a historic AI breakthrough.
You can follow him investing $500,000 of his own money on our top AI stocks for free.