
Incomes are rising rapidly in the United States. According to estimates from the U.S. Census Bureau, the national median household income was nearly $75,000 in 2022, up from about $69,700 in 2021. The 7.2% increase was the largest recorded year-over-year since at least the mid-1990s.
While the typical American household is earning more than ever before, incomes have not been rising fast enough to offset inflation. Throughout 2022, the average rate of inflation hit a 40-year high of 8%, four times the Federal Reserve’s 2% target rate. Accounting for the rising cost of living, real incomes in the U.S. fell by nearly 5% between 2019 and 2022.
While no one has been spared from surging prices, Americans on the low end of the income spectrum have bore the brunt. During inflationary periods, higher-income Americans can cut back on spending and reduce the impact of rising costs. Meanwhile, lower earning Americans, who spend a larger share of their income on necessities such as food, housing, and gas, cannot.
Georgia has a median household income of $71,355. But in many parts of the state, the typical household earns far less than the statewide median.
Using five-year estimates from the U.S. Census Bureau’s 2022 American Community Survey, 24/7 Wall St. identified the 35 poorest counties in Georgia. Counties in the state are ranked on median household income. Population, poverty, and unemployment data are also five-year estimates from the 2022 ACS.
Among the counties on this list, median household incomes are anywhere from about $25,400 to $46,700 below the statewide median. In many of these counties, levels of financial hardship are underscored by widespread poverty. In every county on this list, the share of residents living below the poverty line exceeds the 13.5% statewide poverty rate.
These are the poorest counties in Georgia.
35. Mitchell County

- Median household income: $45,966
- Poverty rate: 28.7%
- 5-yr. avg. unemployment rate: 9.5%
- Population: 21,634
34. Taliaferro County

- Median household income: $45,881
- Poverty rate: 18.9%
- 5-yr. avg. unemployment rate: 4.0%
- Population: 1,635
33. Charlton County
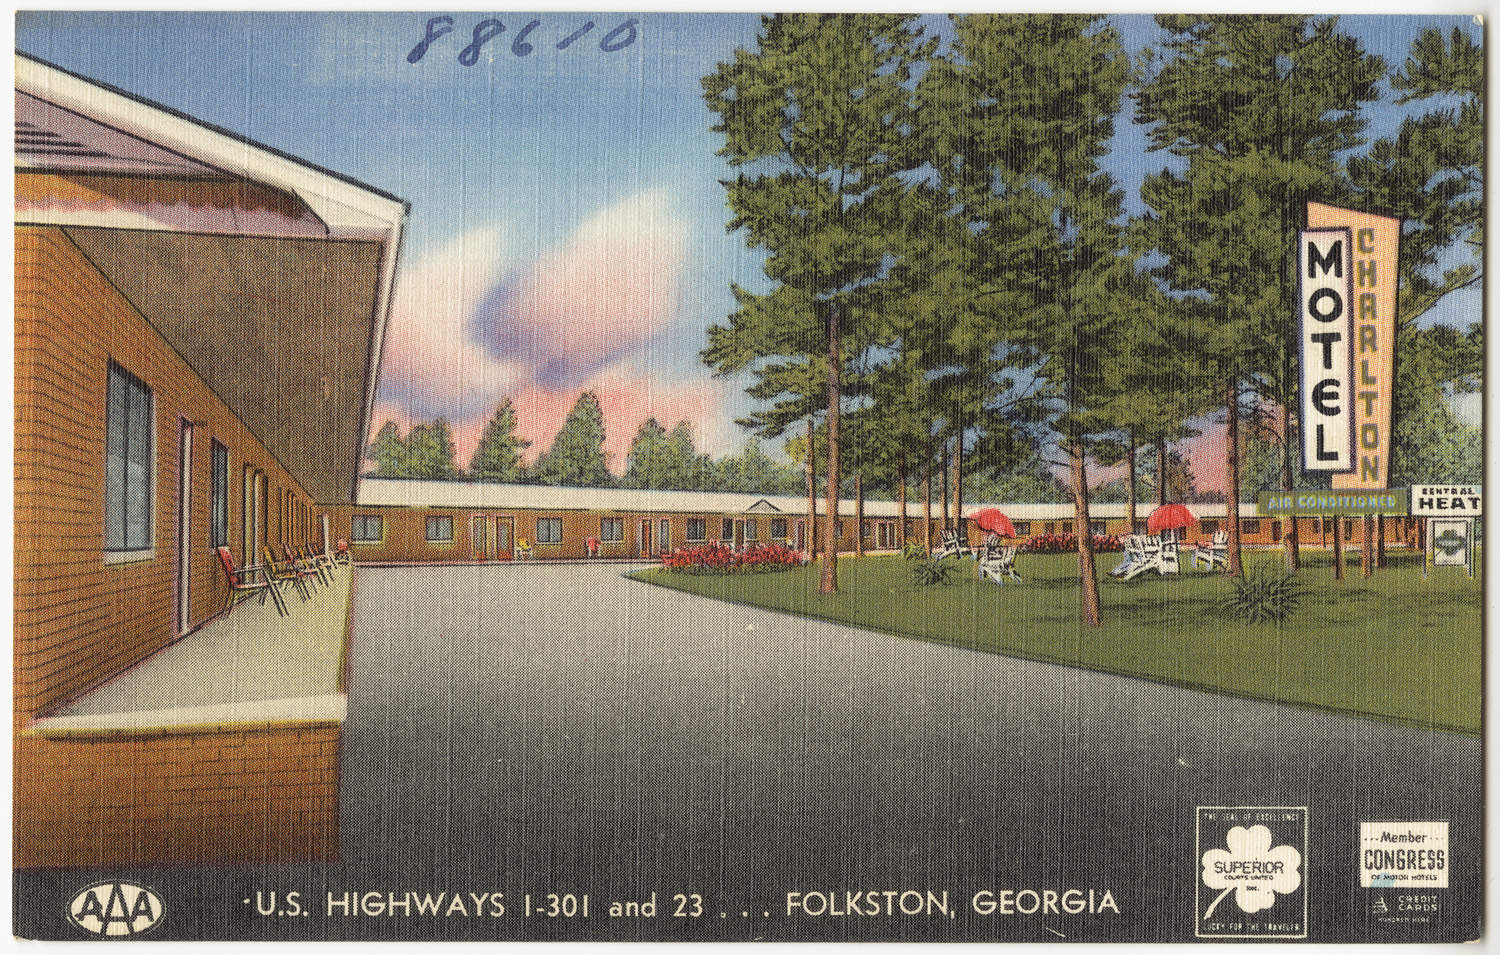
- Median household income: $45,770
- Poverty rate: 20.5%
- 5-yr. avg. unemployment rate: 8.3%
- Population: 12,547
32. Dougherty County
- Median household income: $45,640
- Poverty rate: 26.4%
- 5-yr. avg. unemployment rate: 9.9%
- Population: 85,038
31. Candler County

- Median household income: $45,519
- Poverty rate: 18.3%
- 5-yr. avg. unemployment rate: 3.9%
- Population: 10,946
30. Baker County

- Median household income: $45,417
- Poverty rate: 23.1%
- 5-yr. avg. unemployment rate: 12.2%
- Population: 2,878
29. Warren County

- Median household income: $45,091
- Poverty rate: 22.9%
- 5-yr. avg. unemployment rate: 9.0%
- Population: 5,197
28. Ware County
- Median household income: $44,138
- Poverty rate: 23.7%
- 5-yr. avg. unemployment rate: 4.3%
- Population: 35,917
27. Bacon County

- Median household income: $43,938
- Poverty rate: 21.6%
- 5-yr. avg. unemployment rate: 4.2%
- Population: 11,138
26. Washington County

- Median household income: $43,810
- Poverty rate: 16.8%
- 5-yr. avg. unemployment rate: 4.4%
- Population: 19,975
25. Chattooga County

- Median household income: $43,556
- Poverty rate: 19.9%
- 5-yr. avg. unemployment rate: 4.7%
- Population: 24,902
24. Terrell County
- Median household income: $43,507
- Poverty rate: 29.8%
- 5-yr. avg. unemployment rate: 8.5%
- Population: 9,004
23. Appling County

- Median household income: $43,268
- Poverty rate: 25.3%
- 5-yr. avg. unemployment rate: 3.3%
- Population: 18,441
22. Clay County

- Median household income: $43,264
- Poverty rate: 25.7%
- 5-yr. avg. unemployment rate: 3.5%
- Population: 2,855
21. Stewart County

- Median household income: $43,094
- Poverty rate: 21.9%
- 5-yr. avg. unemployment rate: 5.0%
- Population: 5,121
20. Pulaski County
- Median household income: $42,545
- Poverty rate: 18.9%
- 5-yr. avg. unemployment rate: 3.9%
- Population: 9,887
19. Brooks County

- Median household income: $42,263
- Poverty rate: 26.5%
- 5-yr. avg. unemployment rate: 4.9%
- Population: 16,275
18. Telfair County

- Median household income: $41,801
- Poverty rate: 31.3%
- 5-yr. avg. unemployment rate: 2.1%
- Population: 12,619
17. Jeff Davis County

- Median household income: $41,780
- Poverty rate: 22.6%
- 5-yr. avg. unemployment rate: 4.0%
- Population: 14,791
16. Wilkinson County
- Median household income: $40,757
- Poverty rate: 21.8%
- 5-yr. avg. unemployment rate: 5.8%
- Population: 8,852
15. Taylor County

- Median household income: $40,727
- Poverty rate: 29.0%
- 5-yr. avg. unemployment rate: 6.6%
- Population: 7,799
14. Brantley County

- Median household income: $40,166
- Poverty rate: 16.3%
- 5-yr. avg. unemployment rate: 3.3%
- Population: 18,105
13. Lanier County

- Median household income: $39,971
- Poverty rate: 32.1%
- 5-yr. avg. unemployment rate: 2.1%
- Population: 9,964
12. Turner County

- Median household income: $39,666
- Poverty rate: 22.4%
- 5-yr. avg. unemployment rate: 7.0%
- Population: 8,894
11. Sumter County

- Median household income: $38,899
- Poverty rate: 24.2%
- 5-yr. avg. unemployment rate: 6.4%
- Population: 29,378
10. Quitman County

- Median household income: $38,889
- Poverty rate: 15.3%
- 5-yr. avg. unemployment rate: 23.5%
- Population: 2,180
9. Treutlen County

- Median household income: $38,641
- Poverty rate: 28.1%
- 5-yr. avg. unemployment rate: 10.9%
- Population: 6,411
8. Ben Hill County

- Median household income: $38,255
- Poverty rate: 26.5%
- 5-yr. avg. unemployment rate: 4.9%
- Population: 17,169
7. Atkinson County

- Median household income: $38,007
- Poverty rate: 27.5%
- 5-yr. avg. unemployment rate: 4.6%
- Population: 8,265
6. Wheeler County

- Median household income: $36,354
- Poverty rate: 26.7%
- 5-yr. avg. unemployment rate: 6.4%
- Population: 7,550
5. Webster County

- Median household income: $35,000
- Poverty rate: 27.9%
- 5-yr. avg. unemployment rate: 8.9%
- Population: 2,354
4. Macon County

- Median household income: $33,960
- Poverty rate: 26.2%
- 5-yr. avg. unemployment rate: 9.2%
- Population: 12,099
3. Hancock County

- Median household income: $31,767
- Poverty rate: 27.5%
- 5-yr. avg. unemployment rate: 6.2%
- Population: 8,588
2. Jenkins County

- Median household income: $31,463
- Poverty rate: 27.9%
- 5-yr. avg. unemployment rate: 4.9%
- Population: 8,704
1. Randolph County

- Median household income: $24,638
- Poverty rate: 28.1%
- 5-yr. avg. unemployment rate: 7.5%
- Population: 6,365
| Rank | County | Median household income ($) | Poverty rate (%) | 5-yr. avg. unemployment rate (%) |
|---|---|---|---|---|
| 1 | Randolph, Georgia | 24,638 | 28.1 | 7.5 |
| 2 | Jenkins, Georgia | 31,463 | 27.9 | 4.9 |
| 3 | Hancock, Georgia | 31,767 | 27.5 | 6.2 |
| 4 | Macon, Georgia | 33,960 | 26.2 | 9.2 |
| 5 | Webster, Georgia | 35,000 | 27.9 | 8.9 |
| 6 | Wheeler, Georgia | 36,354 | 26.7 | 6.4 |
| 7 | Atkinson, Georgia | 38,007 | 27.5 | 4.6 |
| 8 | Ben Hill, Georgia | 38,255 | 26.5 | 4.9 |
| 9 | Treutlen, Georgia | 38,641 | 28.1 | 10.9 |
| 10 | Quitman, Georgia | 38,889 | 15.3 | 23.5 |
| 11 | Sumter, Georgia | 38,899 | 24.2 | 6.4 |
| 12 | Turner, Georgia | 39,666 | 22.4 | 7.0 |
| 13 | Lanier, Georgia | 39,971 | 32.1 | 2.1 |
| 14 | Brantley, Georgia | 40,166 | 16.3 | 3.3 |
| 15 | Taylor, Georgia | 40,727 | 29.0 | 6.6 |
| 16 | Wilkinson, Georgia | 40,757 | 21.8 | 5.8 |
| 17 | Jeff Davis, Georgia | 41,780 | 22.6 | 4.0 |
| 18 | Telfair, Georgia | 41,801 | 31.3 | 2.1 |
| 19 | Brooks, Georgia | 42,263 | 26.5 | 4.9 |
| 20 | Pulaski, Georgia | 42,545 | 18.9 | 3.9 |
| 21 | Stewart, Georgia | 43,094 | 21.9 | 5.0 |
| 22 | Clay, Georgia | 43,264 | 25.7 | 3.5 |
| 23 | Appling, Georgia | 43,268 | 25.3 | 3.3 |
| 24 | Terrell, Georgia | 43,507 | 29.8 | 8.5 |
| 25 | Chattooga, Georgia | 43,556 | 19.9 | 4.7 |
| 26 | Washington, Georgia | 43,810 | 16.8 | 4.4 |
| 27 | Bacon, Georgia | 43,938 | 21.6 | 4.2 |
| 28 | Ware, Georgia | 44,138 | 23.7 | 4.3 |
| 29 | Warren, Georgia | 45,091 | 22.9 | 9.0 |
| 30 | Baker, Georgia | 45,417 | 23.1 | 12.2 |
| 31 | Candler, Georgia | 45,519 | 18.3 | 3.9 |
| 32 | Dougherty, Georgia | 45,640 | 26.4 | 9.9 |
| 33 | Charlton, Georgia | 45,770 | 20.5 | 8.3 |
| 34 | Taliaferro, Georgia | 45,881 | 18.9 | 4.0 |
| 35 | Mitchell, Georgia | 45,966 | 28.7 | 9.5 |
Are You Still Paying With a Debit Card?
The average American spends $17,274 on debit cards a year, and it’s a HUGE mistake. First, debit cards don’t have the same fraud protections as credit cards. Once your money is gone, it’s gone. But more importantly you can actually get something back from this spending every time you swipe.
Issuers are handing out wild bonuses right now. With some you can earn up to 5% back on every purchase. That’s like getting a 5% discount on everything you buy!
Our top pick is kind of hard to imagine. Not only does it pay up to 5% back, it also includes a $200 cash back reward in the first six months, a 0% intro APR, and…. $0 annual fee. It’s quite literally free money for any one that uses a card regularly. Click here to learn more!
Flywheel Publishing has partnered with CardRatings to provide coverage of credit card products. Flywheel Publishing and CardRatings may receive a commission from card issuers.
Thank you for reading! Have some feedback for us?
Contact the 24/7 Wall St. editorial team.
Latest from 24/7


Our expert who first called NVIDIA in 2009 is predicting 2025 will see a historic AI breakthrough.
You can follow him investing $500,000 of his own money on our top AI stocks for free.