Incomes are rising rapidly in the United States. According to estimates from the U.S. Census Bureau, the national median household income was nearly $75,000 in 2022, up from about $69,700 in 2021. The 7.2% increase was the largest recorded year-over-year since at least the mid-1990s.
While the typical American household is earning more than ever before, incomes have not been rising fast enough to offset inflation. Throughout 2022, the average rate of inflation hit a 40-year high of 8%, four times the Federal Reserve’s 2% target rate. Accounting for the rising cost of living, real incomes in the U.S. fell by nearly 5% between 2019 and 2022.
While no one has been spared from surging prices, Americans on the low end of the income spectrum have bore the brunt. During inflationary periods, higher-income Americans can cut back on spending and reduce the impact of rising costs. Meanwhile, lower earning Americans, who spend a larger share of their income on necessities such as food, housing, and gas, cannot.
Michigan has a median household income of $68,505. But in many parts of the state, the typical household earns far less than the statewide median.
Using five-year estimates from the U.S. Census Bureau’s 2022 American Community Survey, 24/7 Wall St. identified the 35 poorest counties in Michigan. Counties in the state are ranked on median household income. Population, poverty, and unemployment data are also five-year estimates from the 2022 ACS.
Among the counties on this list, median household incomes are anywhere from about $10,500 to $22,600 below the statewide median. In many of these counties, levels of financial hardship are underscored by widespread poverty. In all but seven counties on this list, the share of residents living below the poverty line exceeds the 13.1% statewide poverty rate.
These are the poorest counties in Michigan.
35. Crawford County
- Median household income: $57,998
- Poverty rate: 13.8%
- 5-yr. avg. unemployment rate: 6.1%
- Population: 13,197
34. Gratiot County

- Median household income: $57,934
- Poverty rate: 14.1%
- 5-yr. avg. unemployment rate: 4.9%
- Population: 41,534
33. Bay County

- Median household income: $57,887
- Poverty rate: 15.3%
- 5-yr. avg. unemployment rate: 4.8%
- Population: 103,752
32. Missaukee County
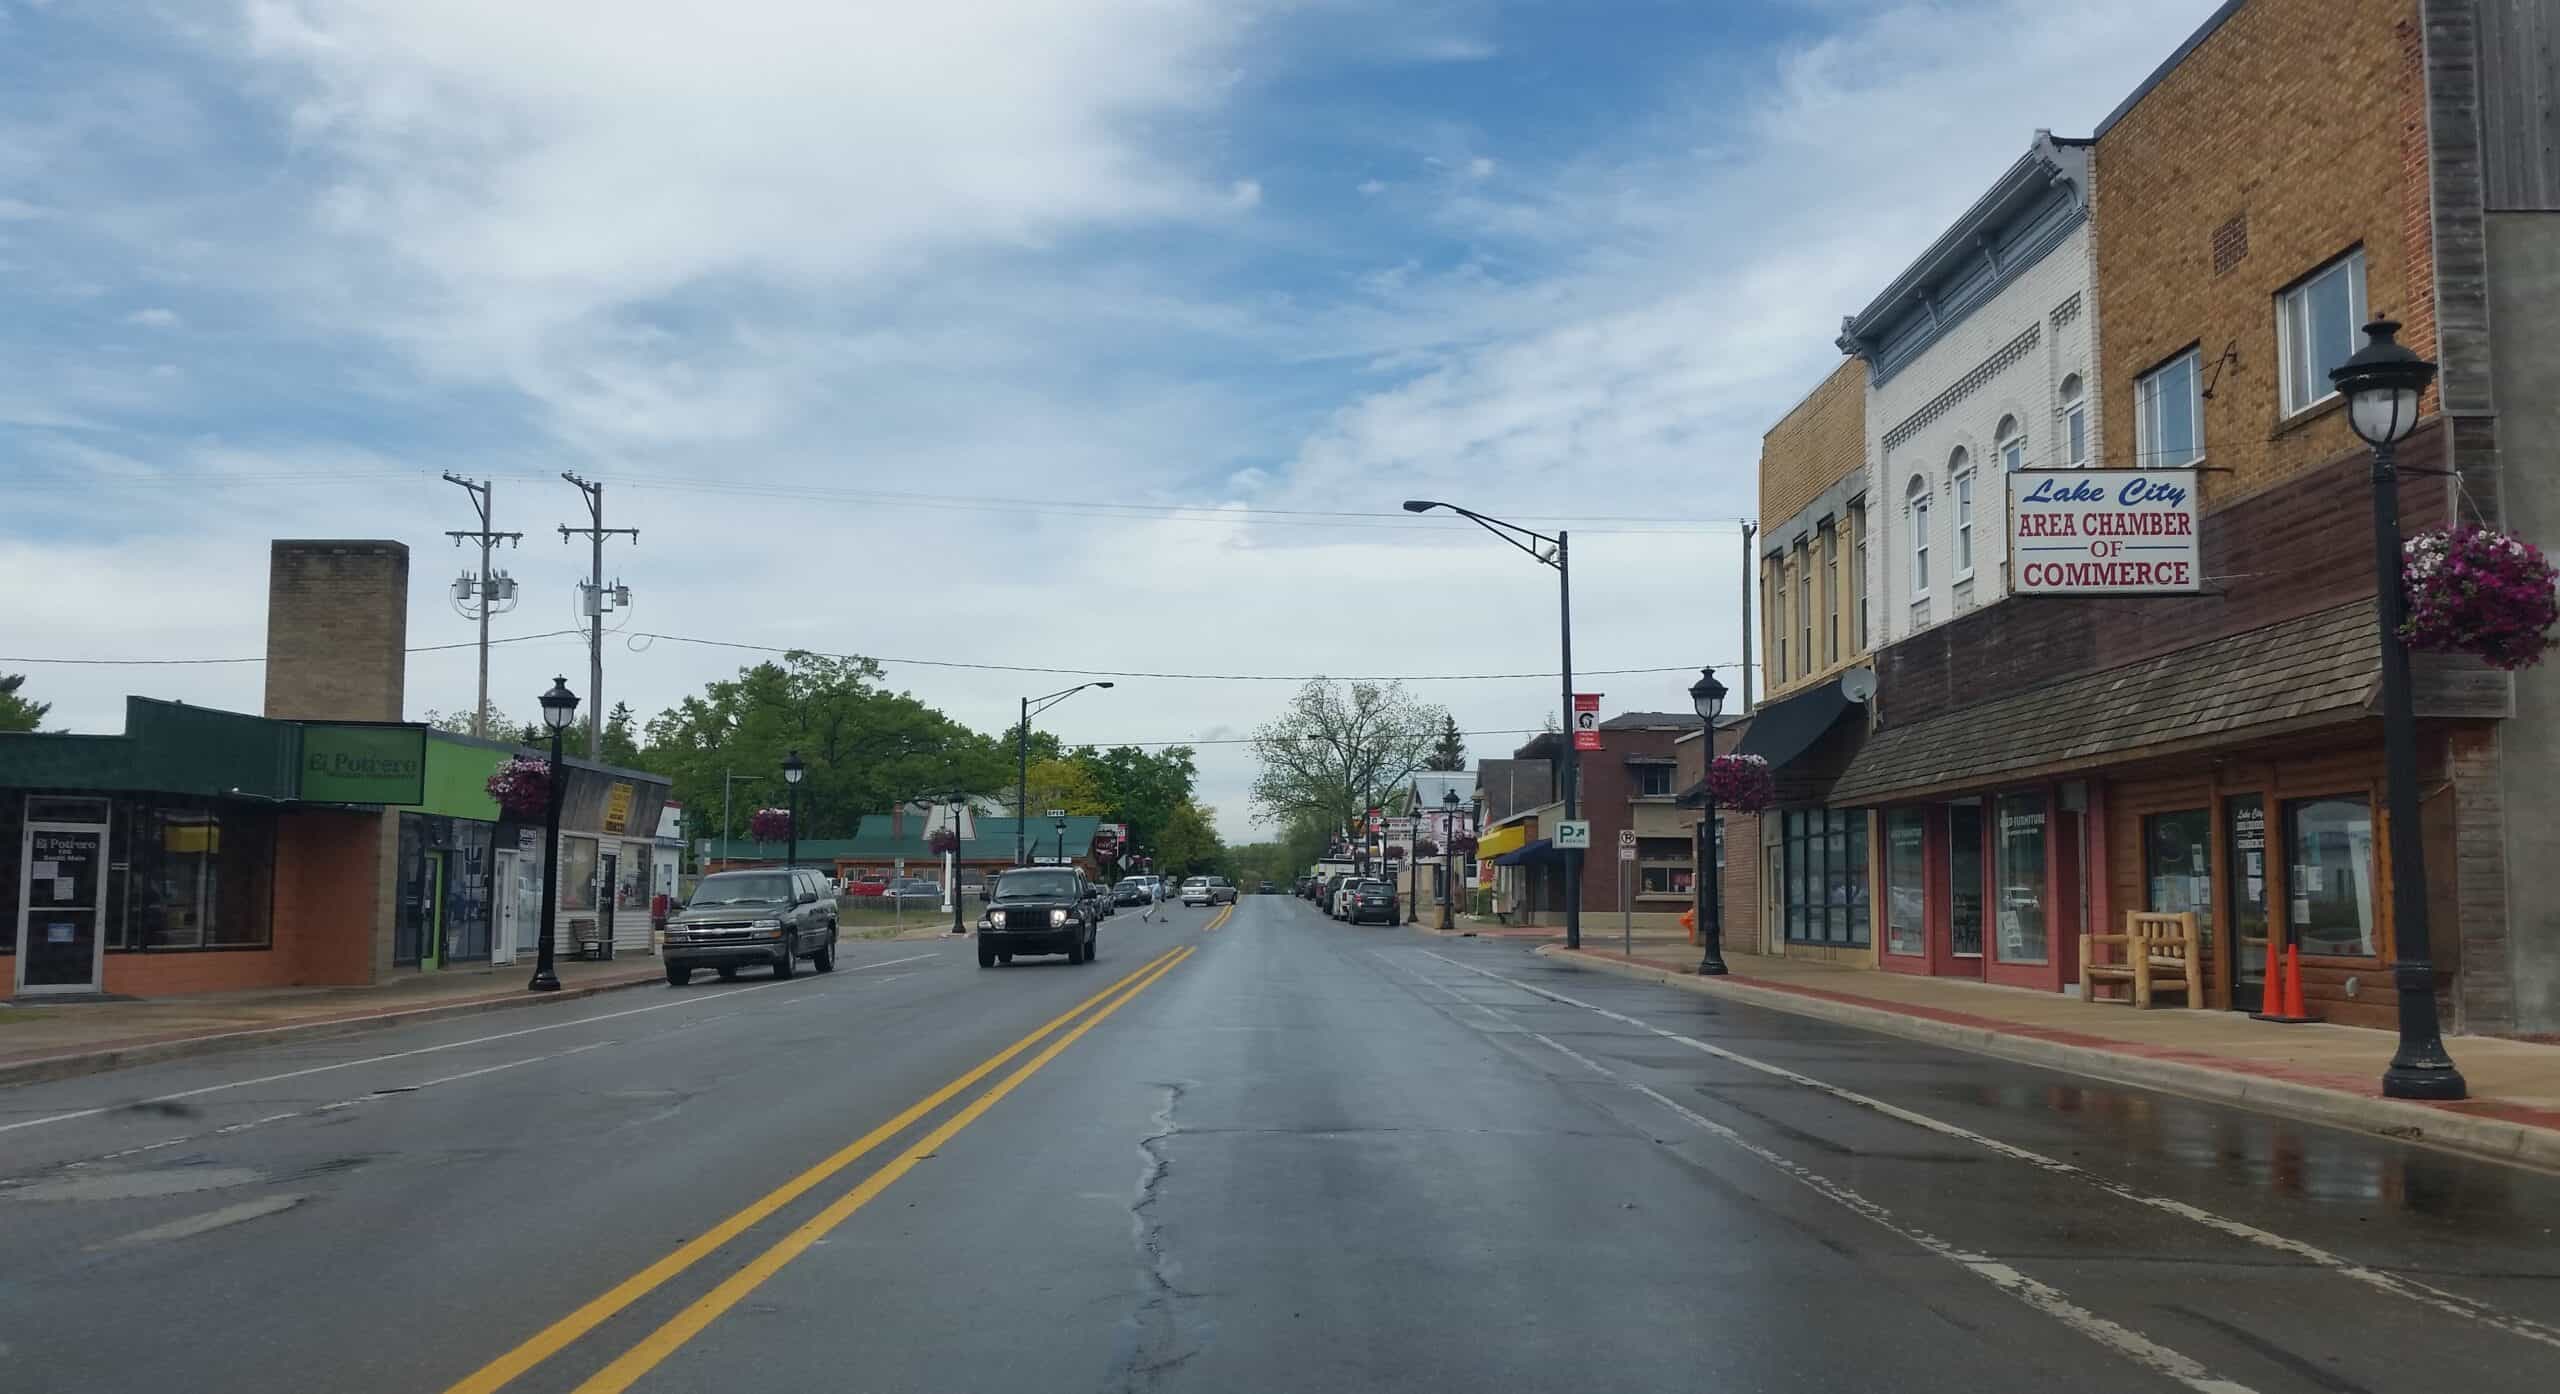
- Median household income: $57,667
- Poverty rate: 11.2%
- 5-yr. avg. unemployment rate: 6.9%
- Population: 15,089
31. Wayne County
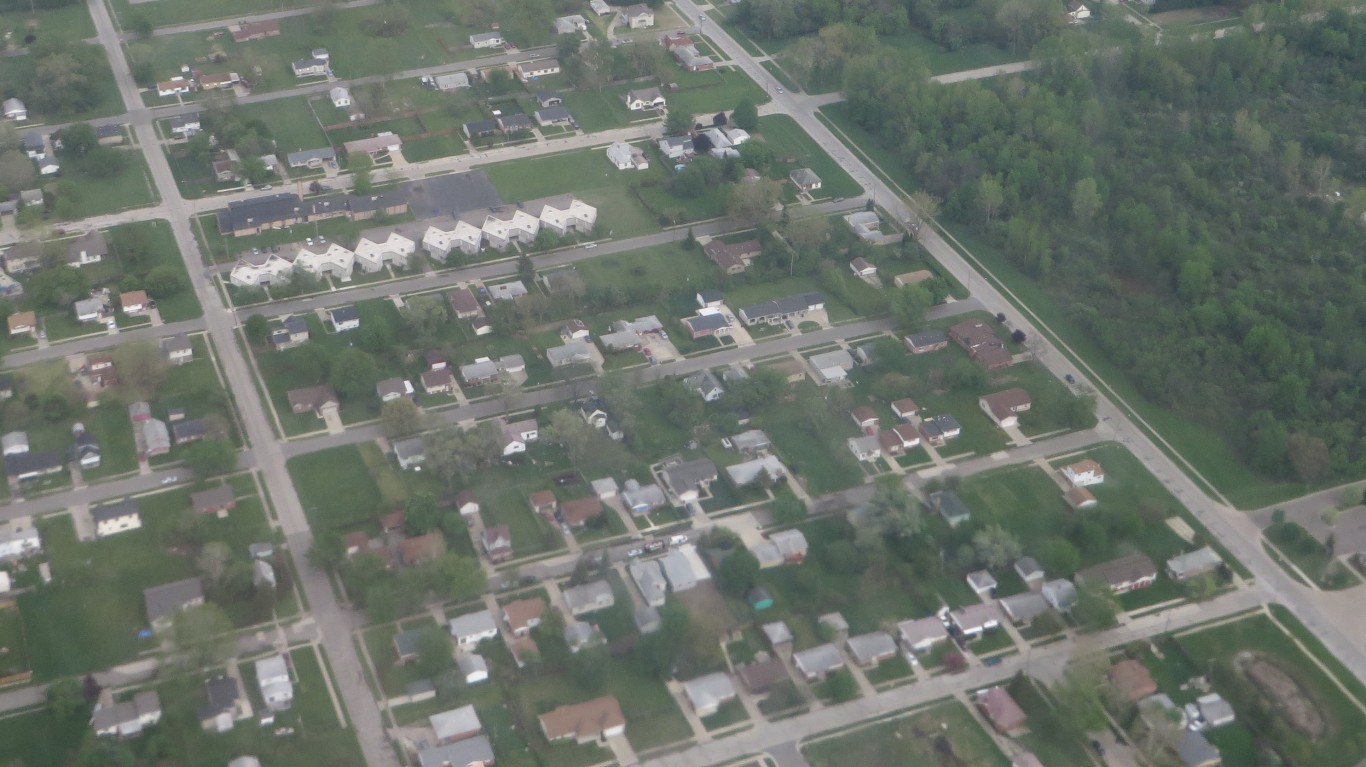
- Median household income: $57,223
- Poverty rate: 20.2%
- 5-yr. avg. unemployment rate: 9.0%
- Population: 1,781,641
30. Saginaw County
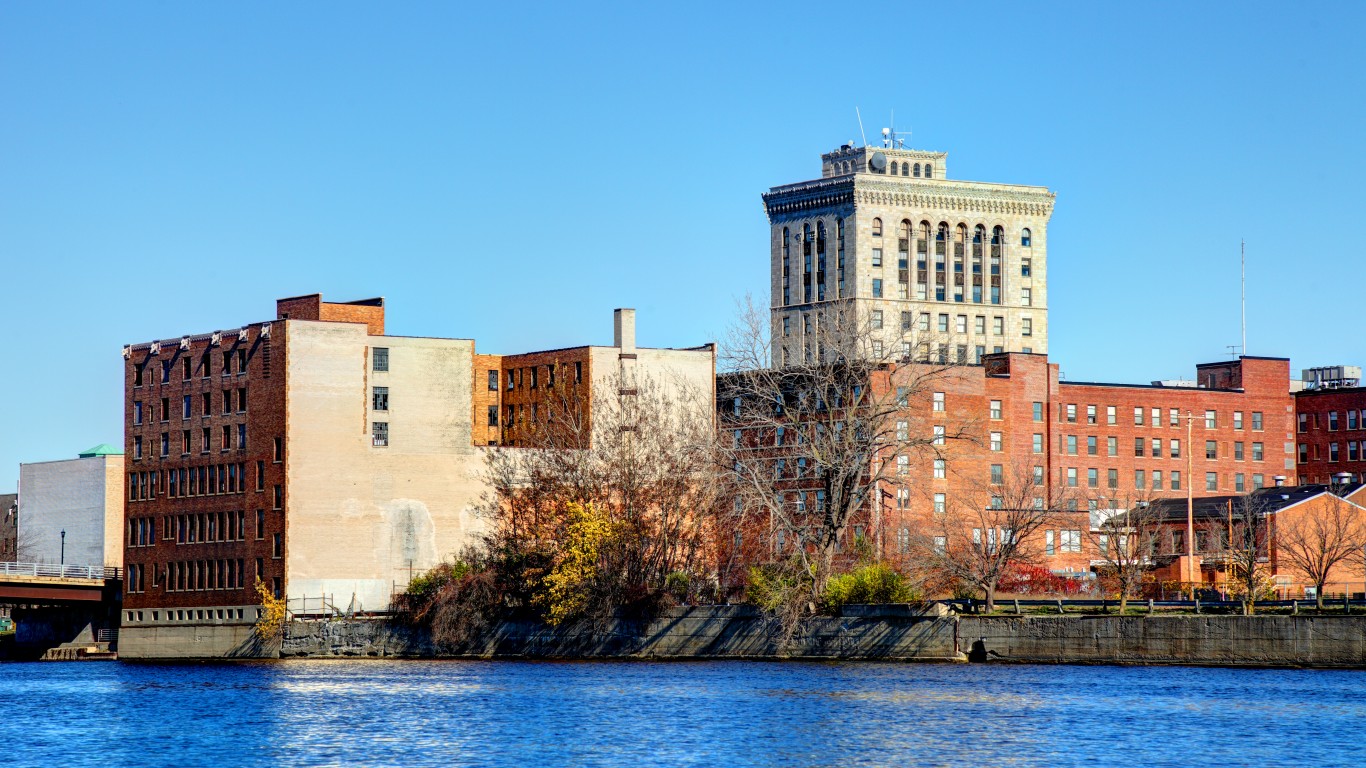
- Median household income: $56,579
- Poverty rate: 18.2%
- 5-yr. avg. unemployment rate: 6.6%
- Population: 189,821
29. Kalkaska County
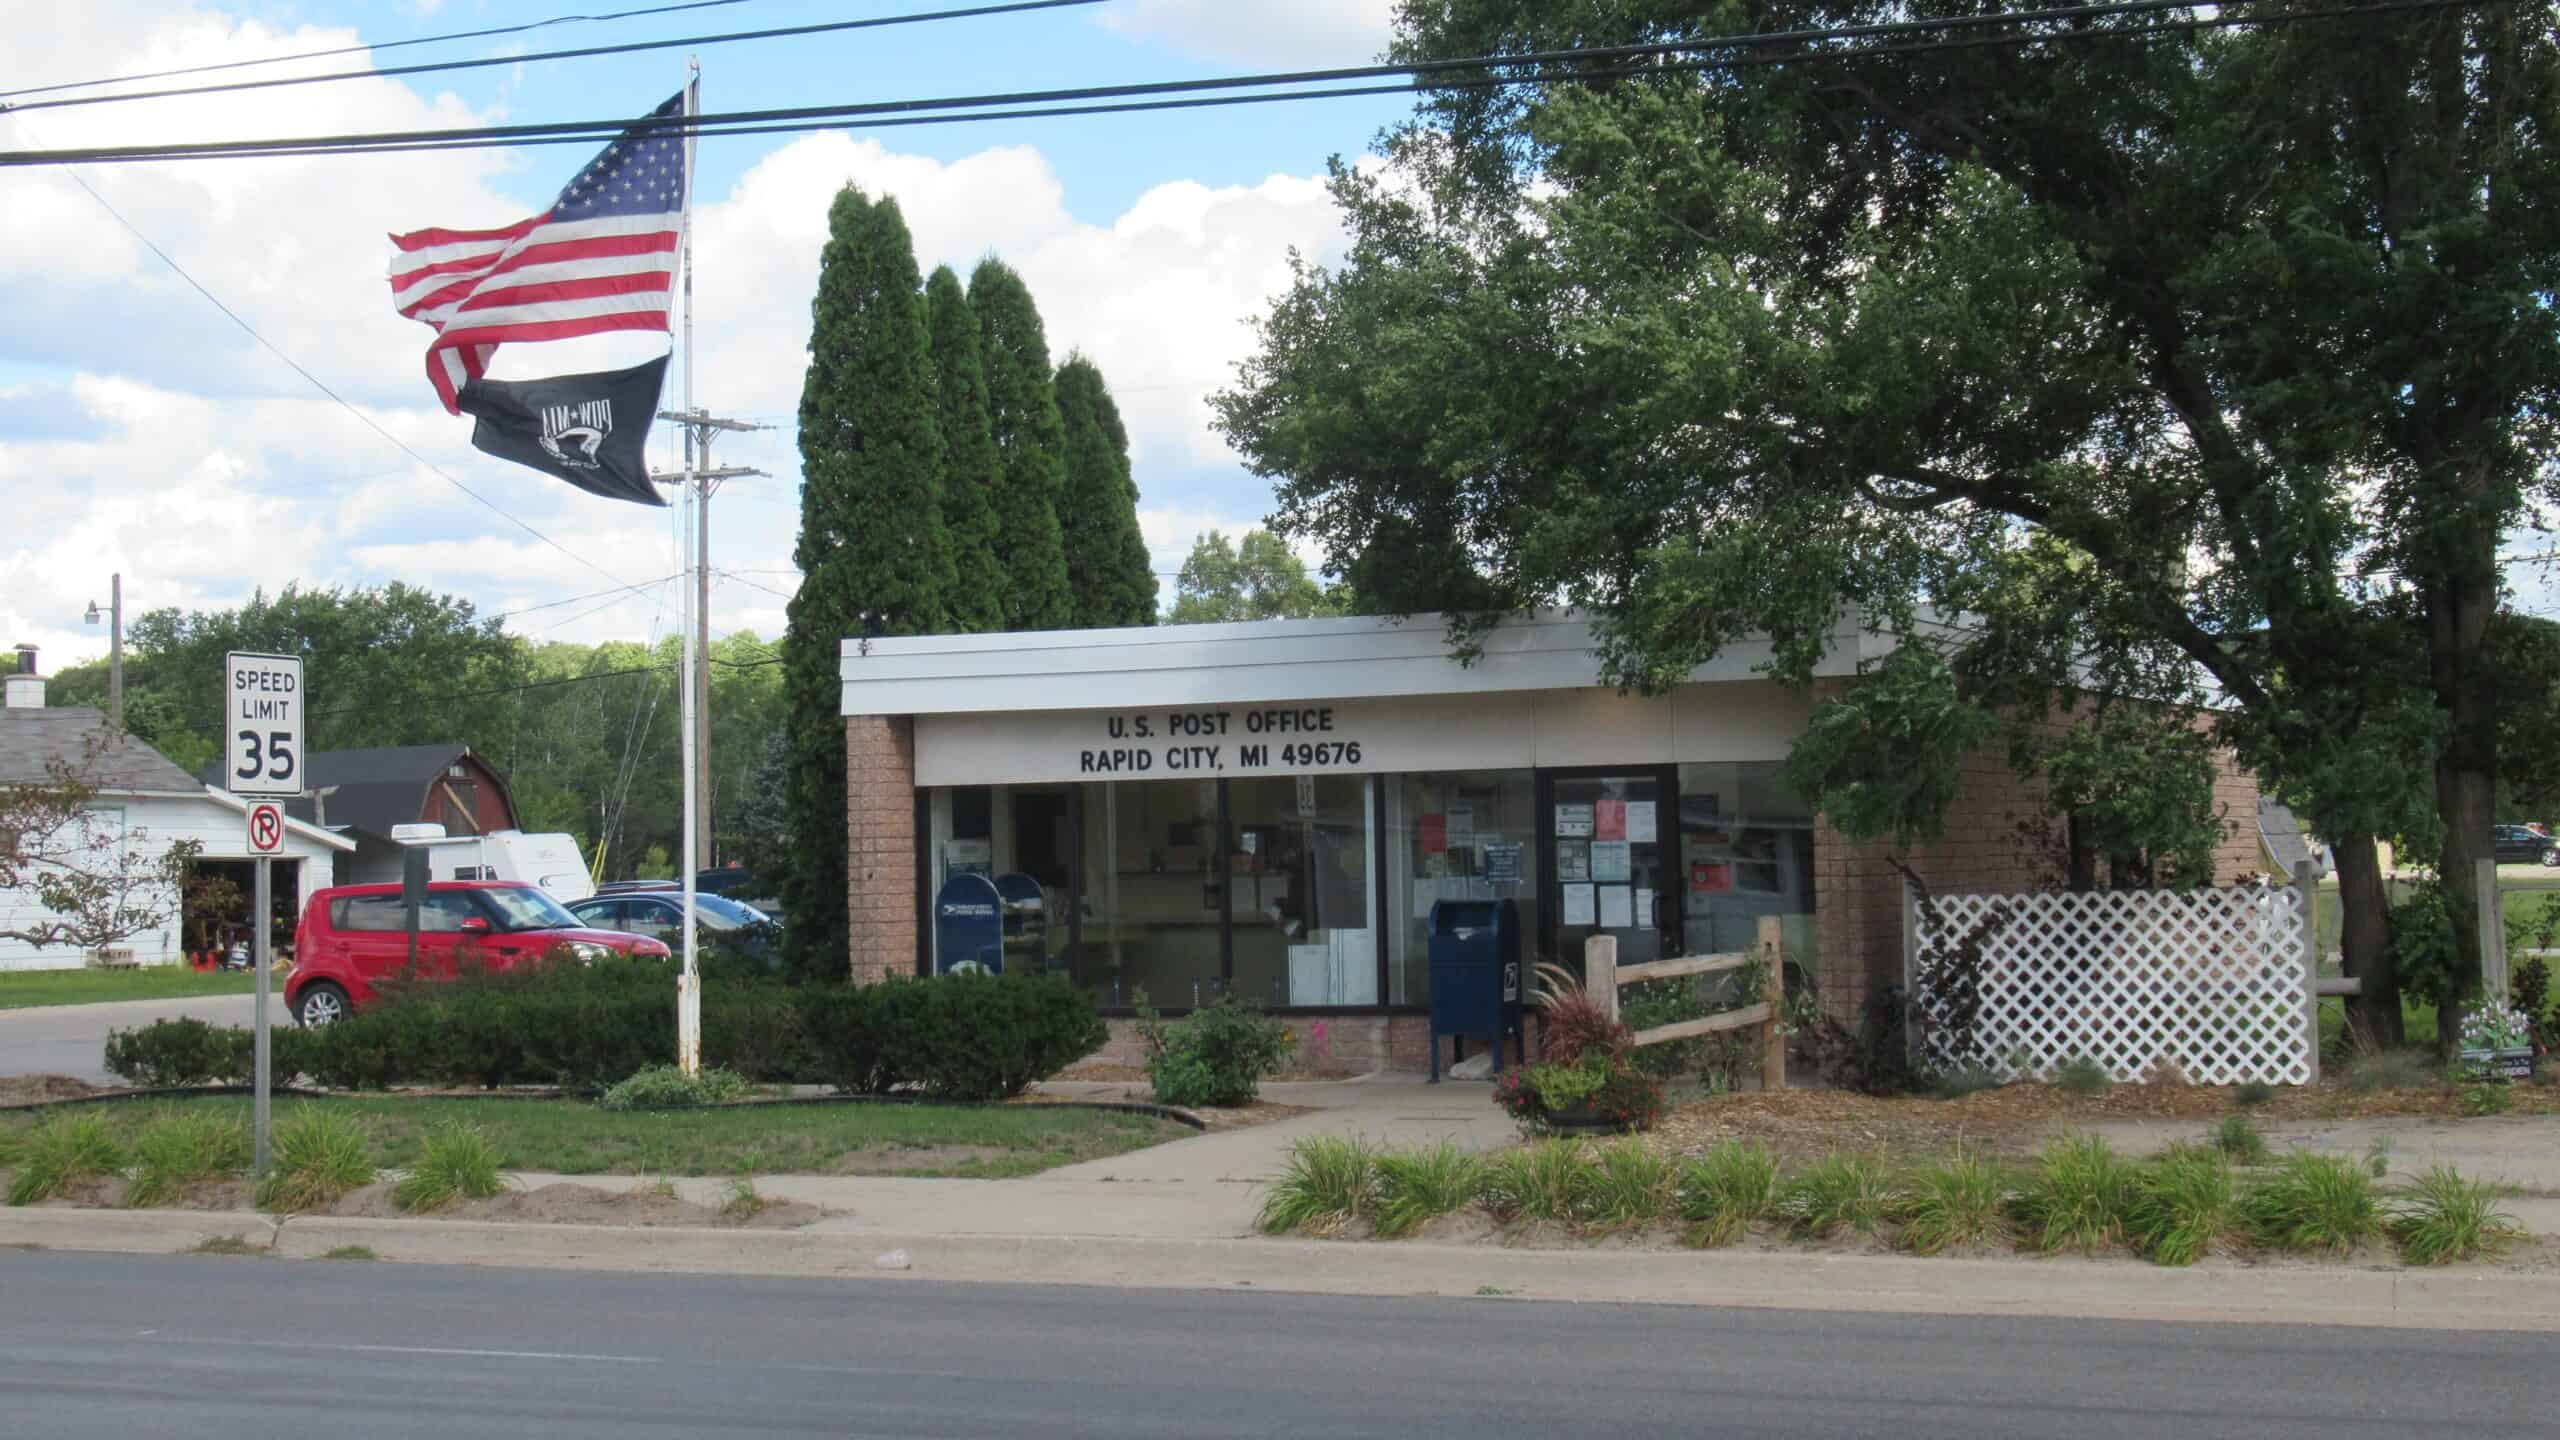
- Median household income: $56,380
- Poverty rate: 14.7%
- 5-yr. avg. unemployment rate: 4.6%
- Population: 17,934
28. Presque Isle County

- Median household income: $55,986
- Poverty rate: 12.7%
- 5-yr. avg. unemployment rate: 6.4%
- Population: 13,083
27. Sanilac County
- Median household income: $55,740
- Poverty rate: 15.0%
- 5-yr. avg. unemployment rate: 6.5%
- Population: 40,759
26. Keweenaw County

- Median household income: $55,560
- Poverty rate: 7.8%
- 5-yr. avg. unemployment rate: 4.7%
- Population: 2,088
25. Alger County

- Median household income: $55,528
- Poverty rate: 10.3%
- 5-yr. avg. unemployment rate: 5.1%
- Population: 8,866
24. Schoolcraft County
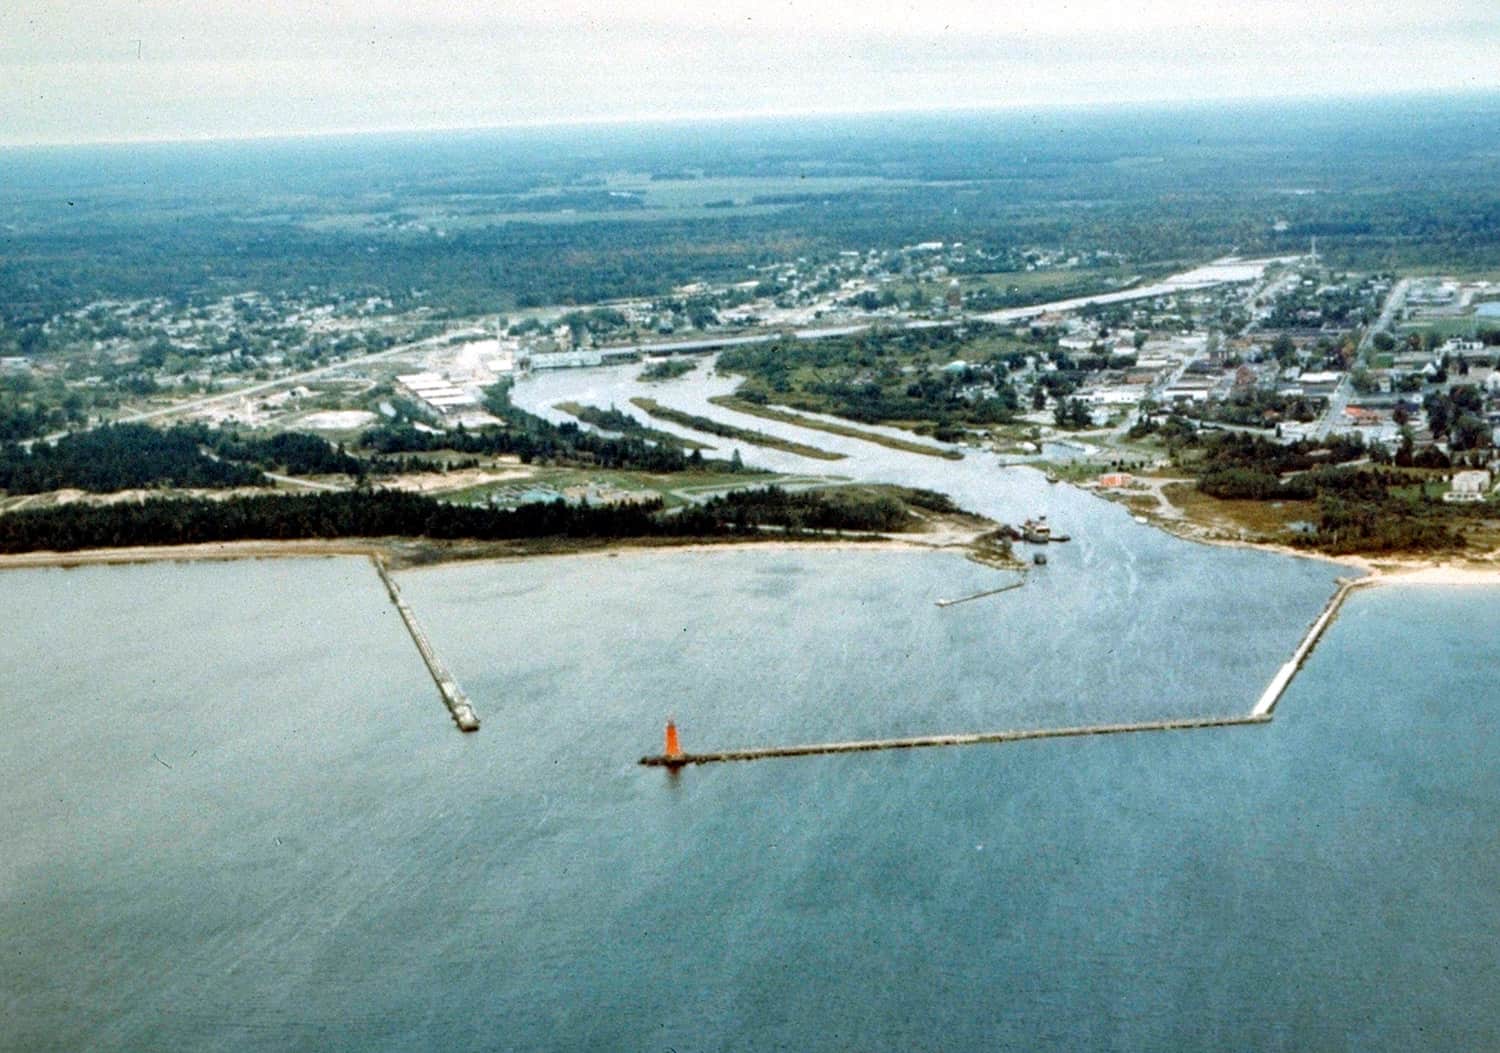
- Median household income: $55,071
- Poverty rate: 16.0%
- 5-yr. avg. unemployment rate: 7.9%
- Population: 8,062
23. Osceola County
- Median household income: $54,875
- Poverty rate: 15.7%
- 5-yr. avg. unemployment rate: 7.6%
- Population: 23,022
22. Huron County
- Median household income: $54,475
- Poverty rate: 11.3%
- 5-yr. avg. unemployment rate: 5.3%
- Population: 31,461
21. Mecosta County
- Median household income: $54,132
- Poverty rate: 18.0%
- 5-yr. avg. unemployment rate: 5.5%
- Population: 40,128
20. Menominee County
- Median household income: $54,074
- Poverty rate: 10.8%
- 5-yr. avg. unemployment rate: 4.5%
- Population: 23,433
19. Delta County

- Median household income: $53,852
- Poverty rate: 13.2%
- 5-yr. avg. unemployment rate: 5.2%
- Population: 36,839
18. Gladwin County
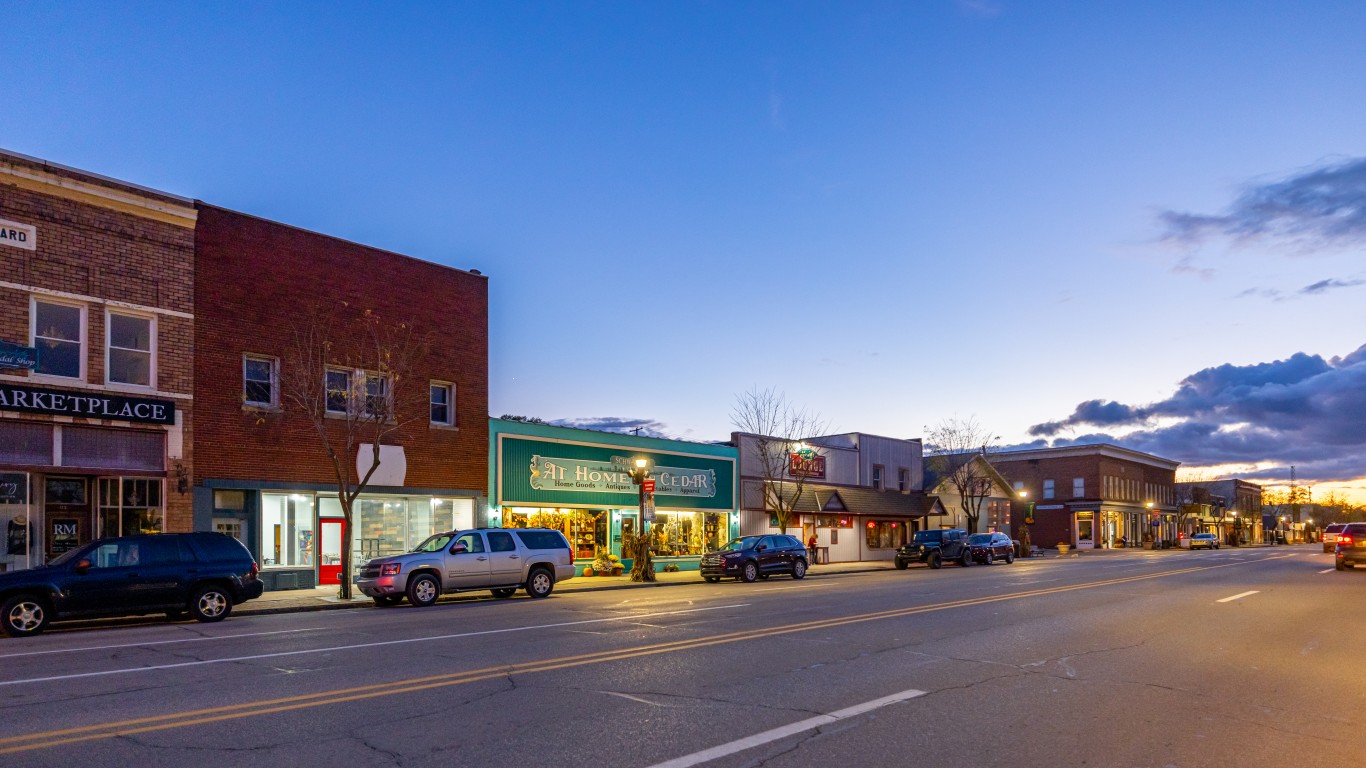
- Median household income: $53,717
- Poverty rate: 14.2%
- 5-yr. avg. unemployment rate: 6.9%
- Population: 25,461
17. Arenac County

- Median household income: $53,487
- Poverty rate: 13.6%
- 5-yr. avg. unemployment rate: 7.2%
- Population: 15,031
16. Houghton County
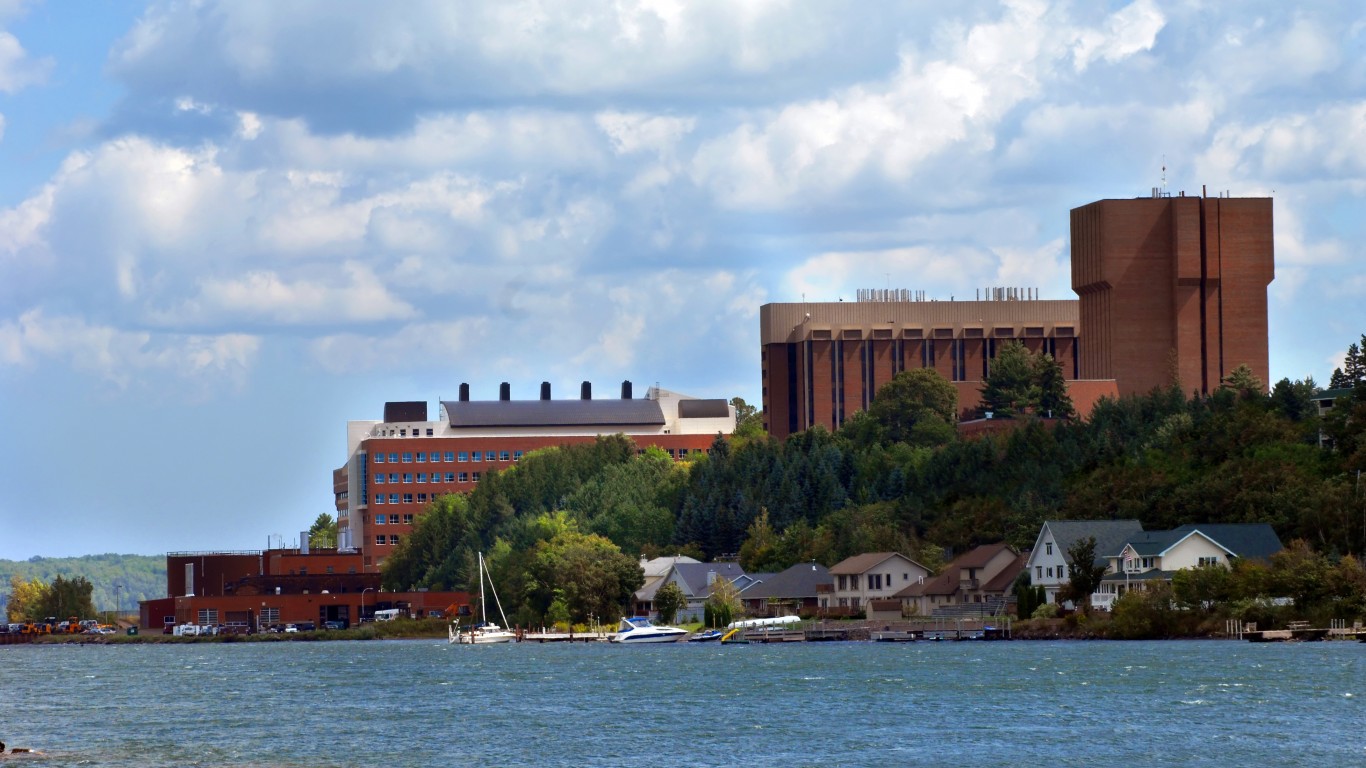
- Median household income: $52,736
- Poverty rate: 17.3%
- 5-yr. avg. unemployment rate: 6.2%
- Population: 37,414
15. Isabella County
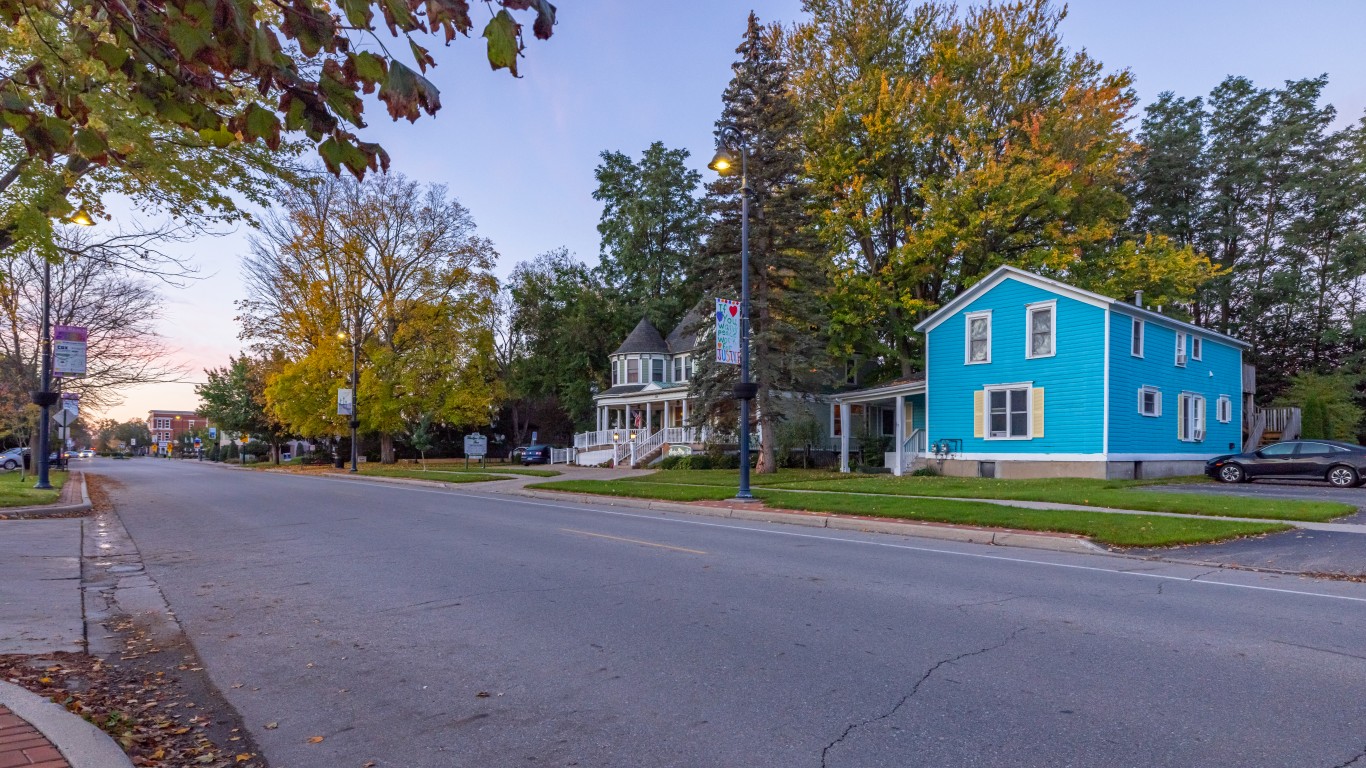
- Median household income: $52,638
- Poverty rate: 23.6%
- 5-yr. avg. unemployment rate: 7.2%
- Population: 64,938
14. Iron County

- Median household income: $52,241
- Poverty rate: 14.7%
- 5-yr. avg. unemployment rate: 4.6%
- Population: 11,585
13. Baraga County

- Median household income: $51,911
- Poverty rate: 12.2%
- 5-yr. avg. unemployment rate: 4.9%
- Population: 8,245
12. Luce County
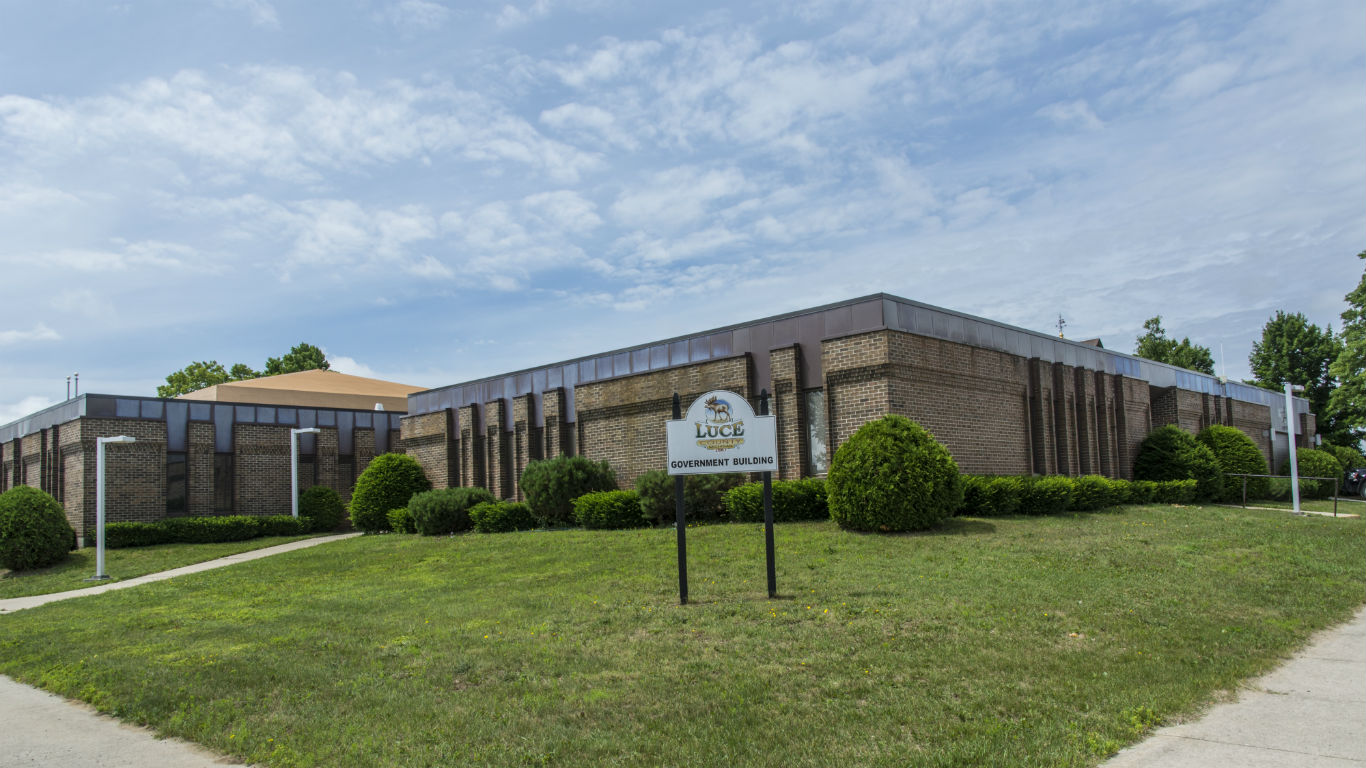
- Median household income: $51,015
- Poverty rate: 18.3%
- 5-yr. avg. unemployment rate: 8.3%
- Population: 5,442
11. Ogemaw County
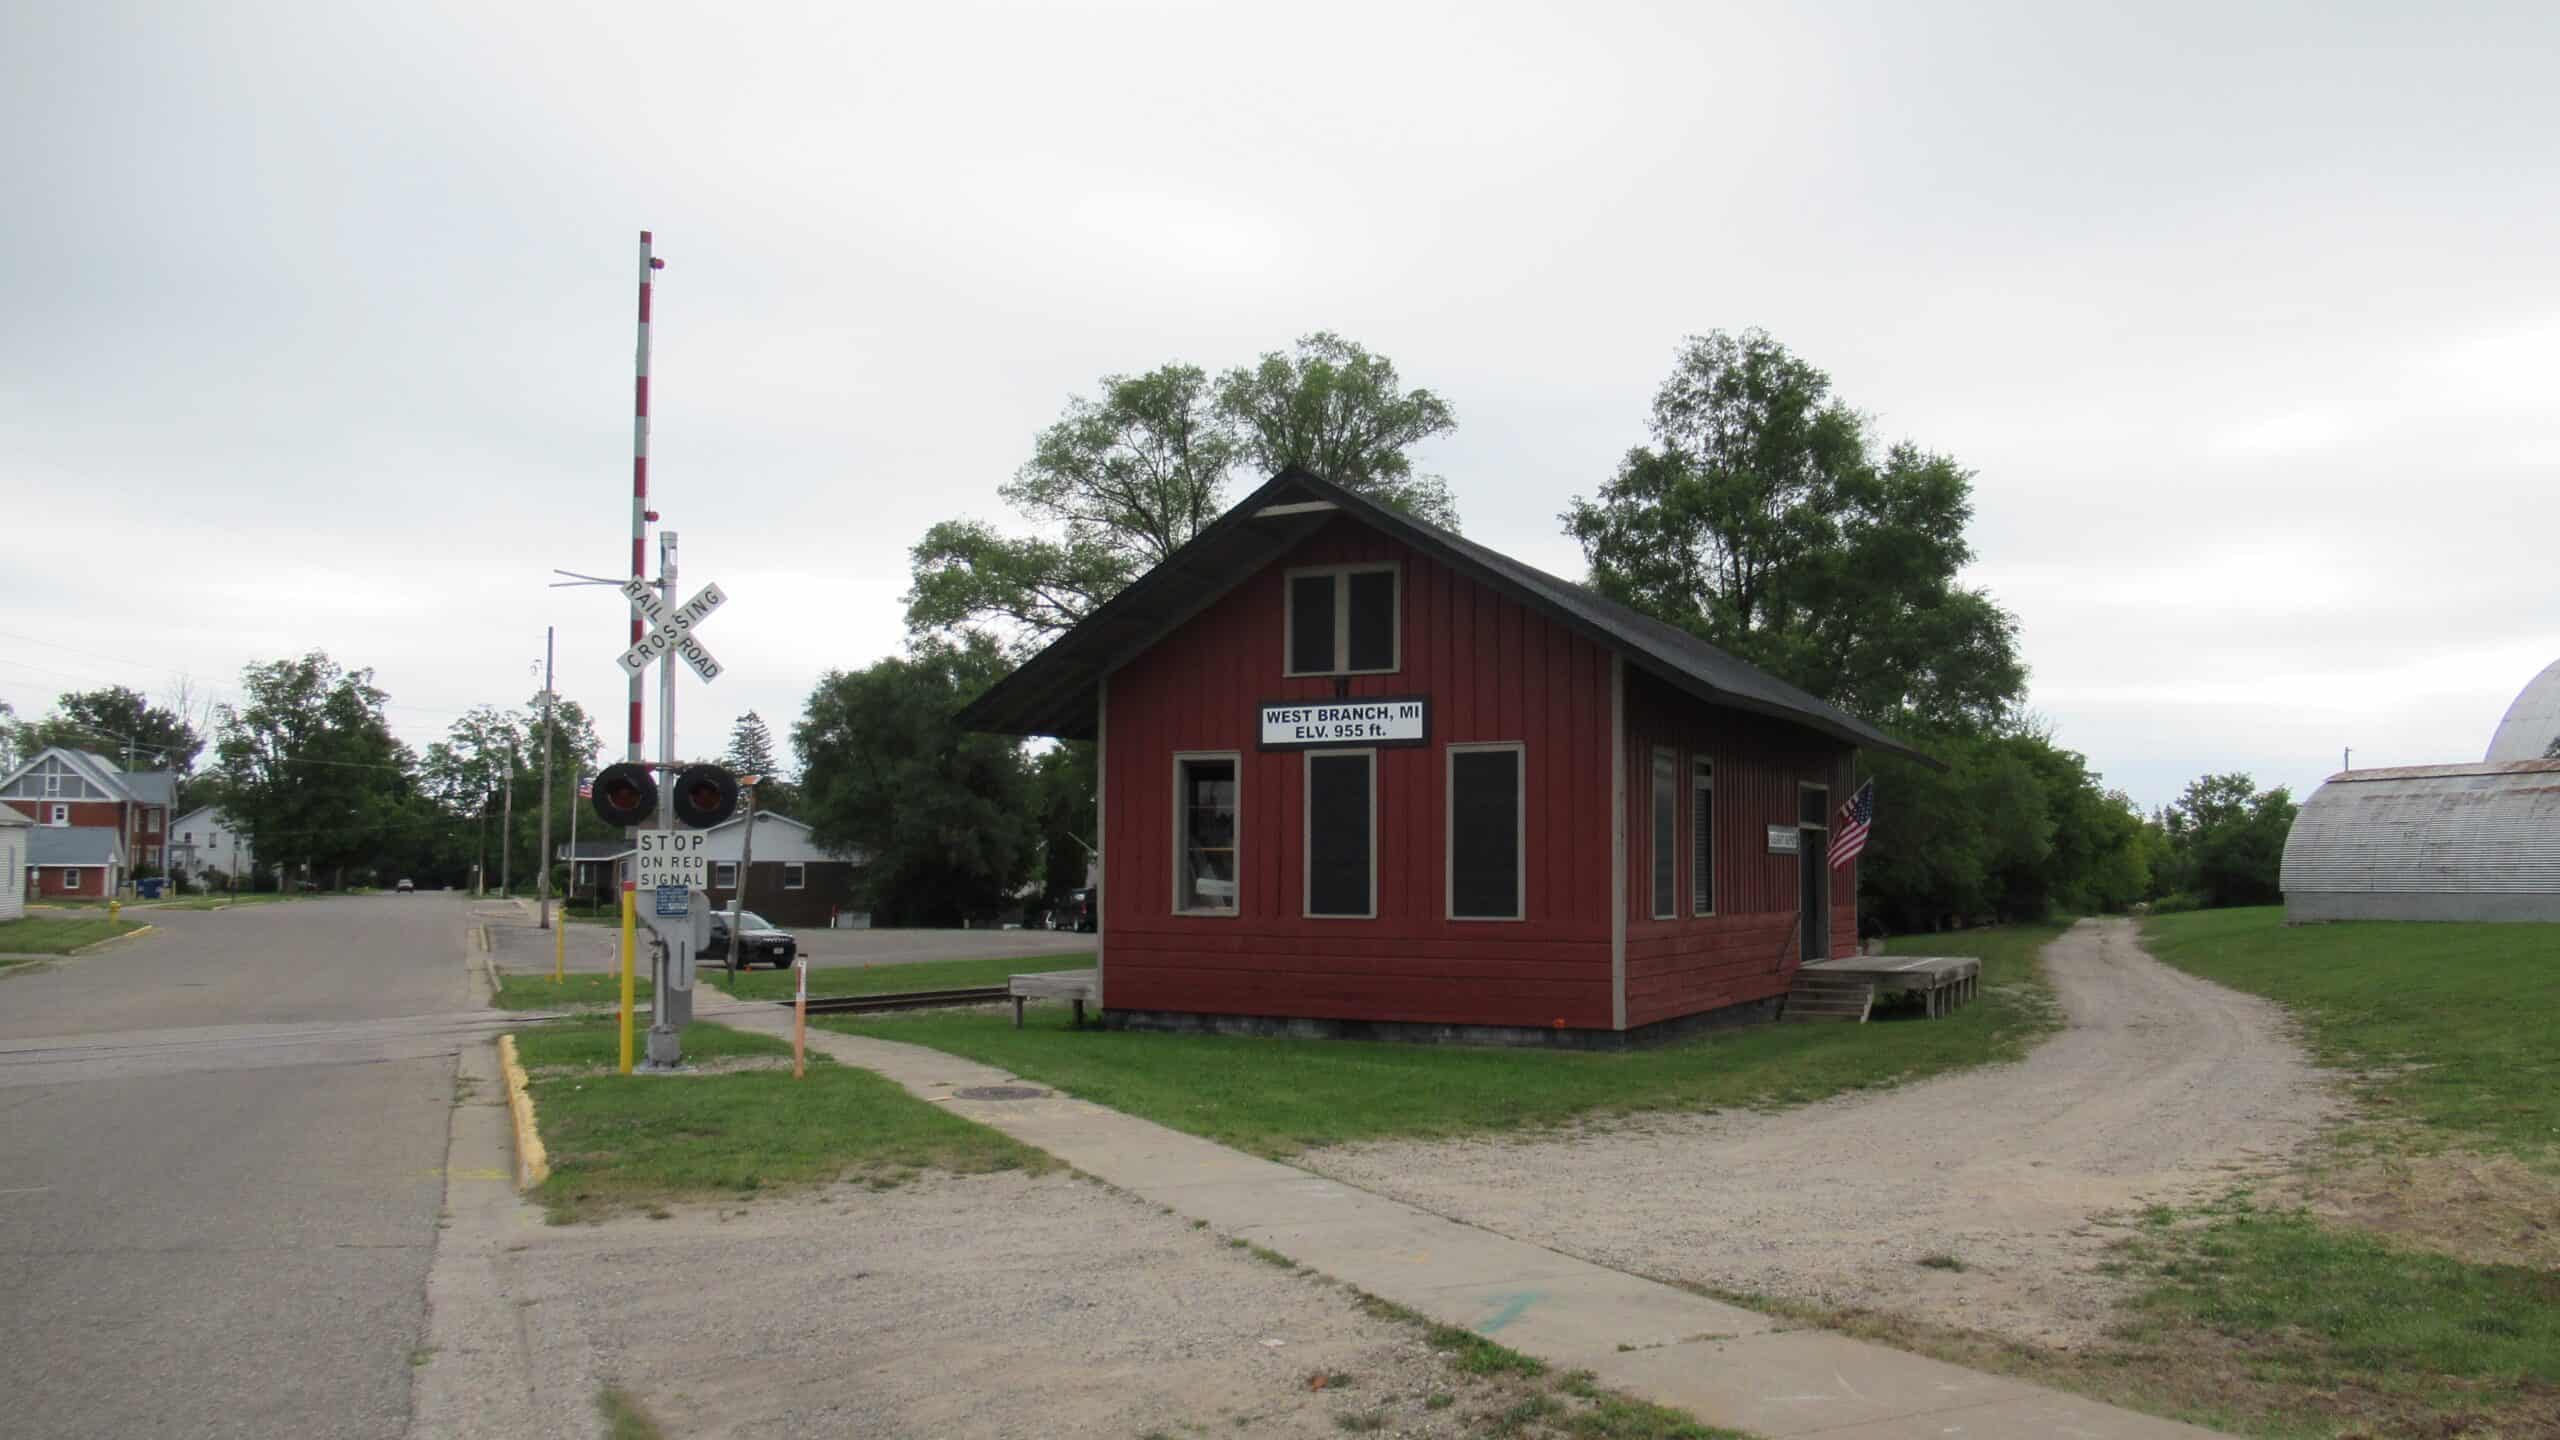
- Median household income: $50,377
- Poverty rate: 17.1%
- 5-yr. avg. unemployment rate: 7.1%
- Population: 20,820
10. Alcona County
- Median household income: $50,295
- Poverty rate: 15.8%
- 5-yr. avg. unemployment rate: 6.3%
- Population: 10,238
9. Roscommon County

- Median household income: $49,898
- Poverty rate: 16.2%
- 5-yr. avg. unemployment rate: 5.7%
- Population: 23,556
8. Alpena County

- Median household income: $49,133
- Poverty rate: 16.5%
- 5-yr. avg. unemployment rate: 7.3%
- Population: 28,911
7. Oscoda County
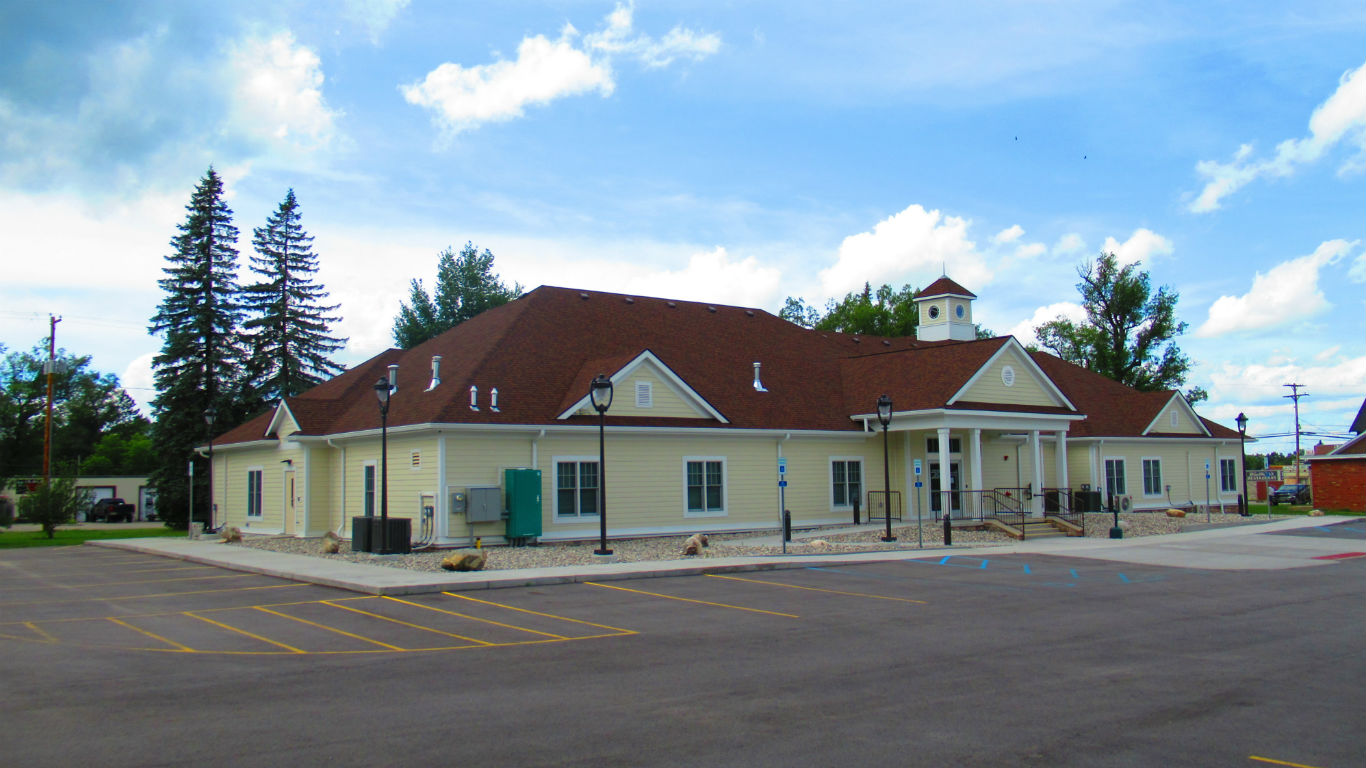
- Median household income: $48,692
- Poverty rate: 13.9%
- 5-yr. avg. unemployment rate: 8.9%
- Population: 8,264
6. Ontonagon County
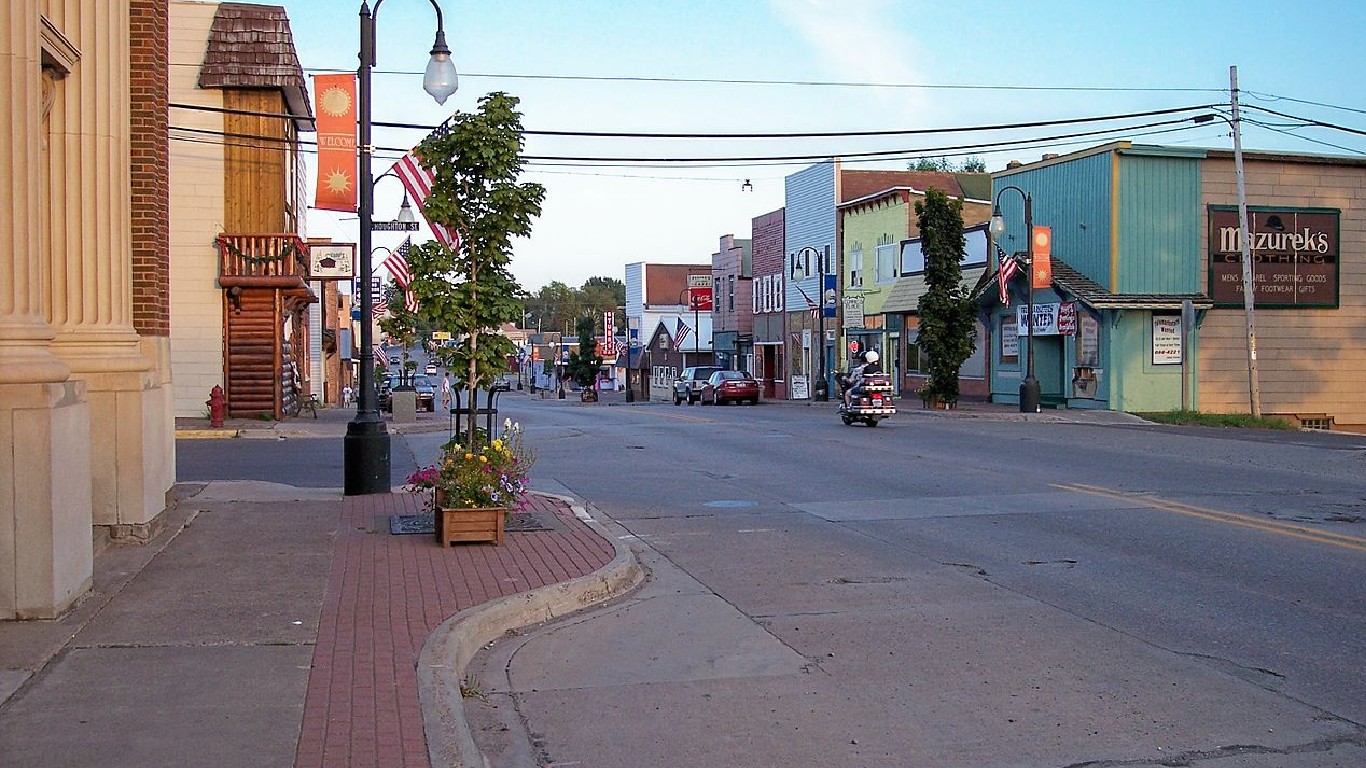
- Median household income: $48,316
- Poverty rate: 13.7%
- 5-yr. avg. unemployment rate: 6.3%
- Population: 5,862
5. Gogebic County

- Median household income: $47,913
- Poverty rate: 14.1%
- 5-yr. avg. unemployment rate: 6.0%
- Population: 14,597
4. Clare County
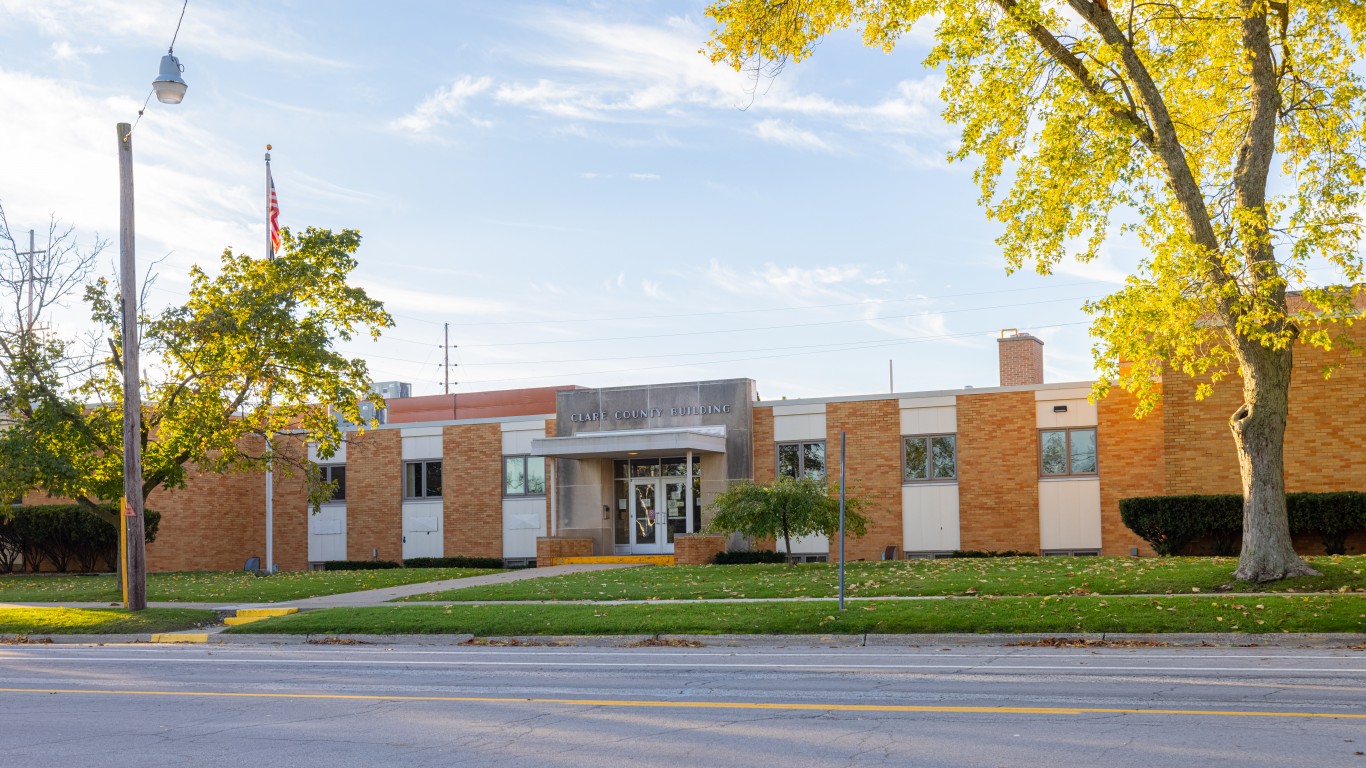
- Median household income: $47,816
- Poverty rate: 22.1%
- 5-yr. avg. unemployment rate: 9.3%
- Population: 30,998
3. Montmorency County
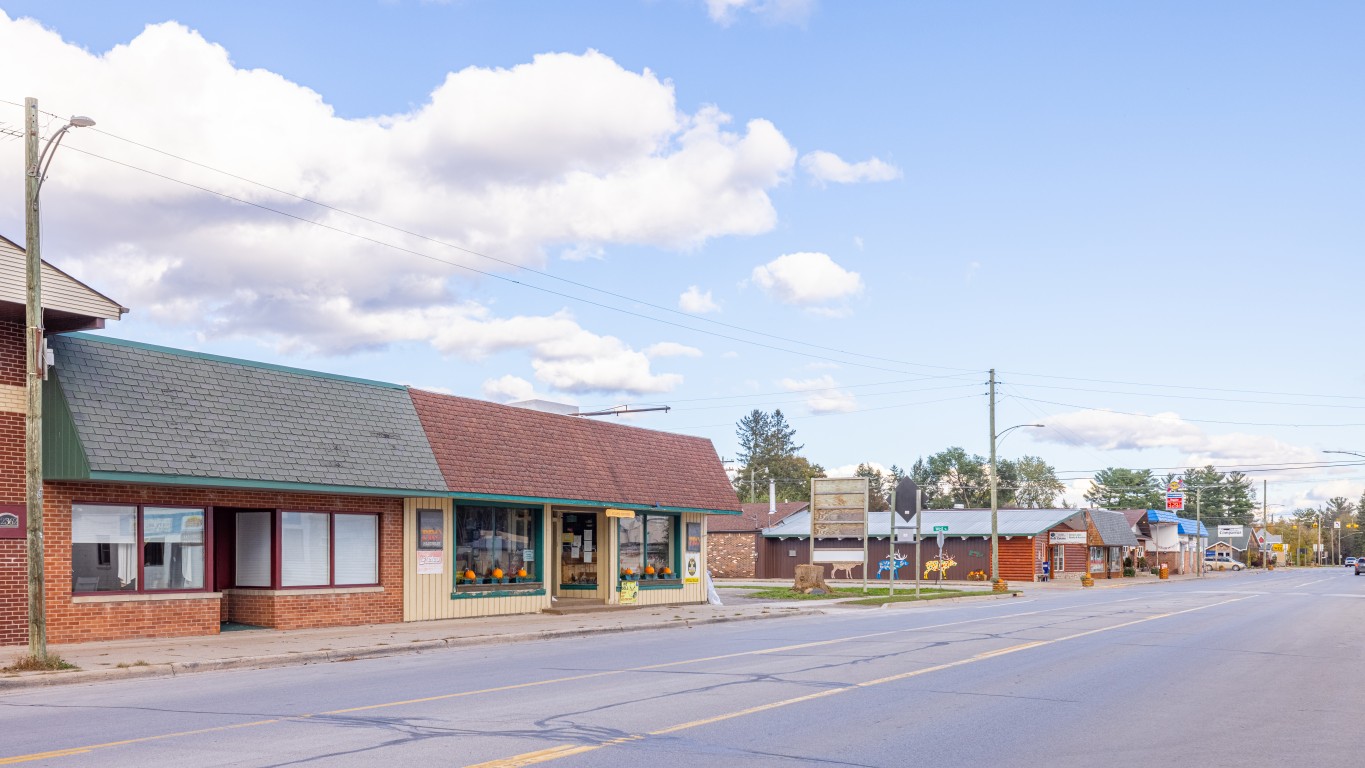
- Median household income: $46,345
- Poverty rate: 18.5%
- 5-yr. avg. unemployment rate: 6.2%
- Population: 9,261
2. Iosco County

- Median household income: $46,224
- Poverty rate: 15.1%
- 5-yr. avg. unemployment rate: 7.4%
- Population: 25,319
1. Lake County
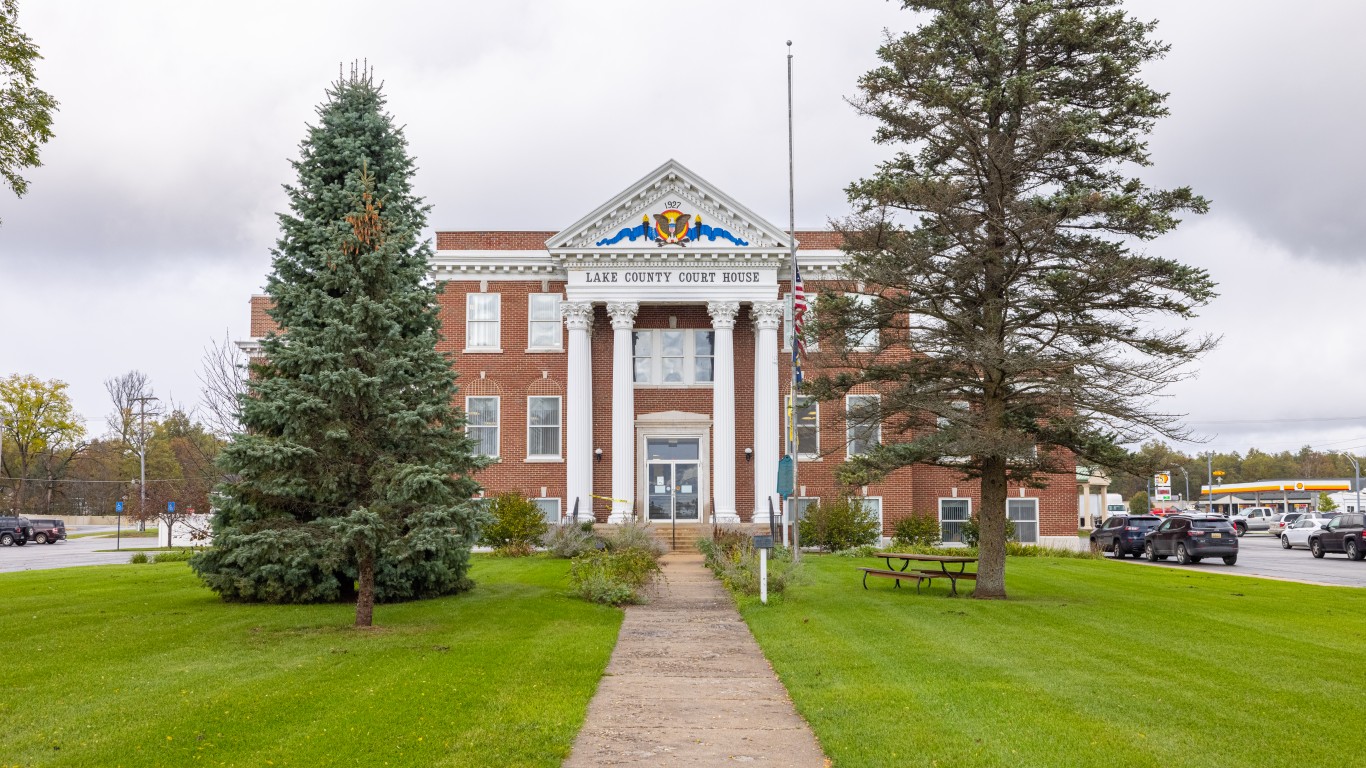
- Median household income: $45,946
- Poverty rate: 20.3%
- 5-yr. avg. unemployment rate: 7.5%
- Population: 12,285
| Rank | County | Median household income ($) | Poverty rate (%) | 5-yr. avg. unemployment rate (%) |
|---|---|---|---|---|
| 1 | Lake, Michigan | 45,946 | 20.3 | 7.5 |
| 2 | Iosco, Michigan | 46,224 | 15.1 | 7.4 |
| 3 | Montmorency, Michigan | 46,345 | 18.5 | 6.2 |
| 4 | Clare, Michigan | 47,816 | 22.1 | 9.3 |
| 5 | Gogebic, Michigan | 47,913 | 14.1 | 6.0 |
| 6 | Ontonagon, Michigan | 48,316 | 13.7 | 6.3 |
| 7 | Oscoda, Michigan | 48,692 | 13.9 | 8.9 |
| 8 | Alpena, Michigan | 49,133 | 16.5 | 7.3 |
| 9 | Roscommon, Michigan | 49,898 | 16.2 | 5.7 |
| 10 | Alcona, Michigan | 50,295 | 15.8 | 6.3 |
| 11 | Ogemaw, Michigan | 50,377 | 17.1 | 7.1 |
| 12 | Luce, Michigan | 51,015 | 18.3 | 8.3 |
| 13 | Baraga, Michigan | 51,911 | 12.2 | 4.9 |
| 14 | Iron, Michigan | 52,241 | 14.7 | 4.6 |
| 15 | Isabella, Michigan | 52,638 | 23.6 | 7.2 |
| 16 | Houghton, Michigan | 52,736 | 17.3 | 6.2 |
| 17 | Arenac, Michigan | 53,487 | 13.6 | 7.2 |
| 18 | Gladwin, Michigan | 53,717 | 14.2 | 6.9 |
| 19 | Delta, Michigan | 53,852 | 13.2 | 5.2 |
| 20 | Menominee, Michigan | 54,074 | 10.8 | 4.5 |
| 21 | Mecosta, Michigan | 54,132 | 18.0 | 5.5 |
| 22 | Huron, Michigan | 54,475 | 11.3 | 5.3 |
| 23 | Osceola, Michigan | 54,875 | 15.7 | 7.6 |
| 24 | Schoolcraft, Michigan | 55,071 | 16.0 | 7.9 |
| 25 | Alger, Michigan | 55,528 | 10.3 | 5.1 |
| 26 | Keweenaw, Michigan | 55,560 | 7.8 | 4.7 |
| 27 | Sanilac, Michigan | 55,740 | 15.0 | 6.5 |
| 28 | Presque Isle, Michigan | 55,986 | 12.7 | 6.4 |
| 29 | Kalkaska, Michigan | 56,380 | 14.7 | 4.6 |
| 30 | Saginaw, Michigan | 56,579 | 18.2 | 6.6 |
| 31 | Wayne, Michigan | 57,223 | 20.2 | 9.0 |
| 32 | Missaukee, Michigan | 57,667 | 11.2 | 6.9 |
| 33 | Bay, Michigan | 57,887 | 15.3 | 4.8 |
| 34 | Gratiot, Michigan | 57,934 | 14.1 | 4.9 |
| 35 | Crawford, Michigan | 57,998 | 13.8 | 6.1 |
Are You Ahead, or Behind on Retirement? (sponsor)
If you’re one of the over 4 Million Americans set to retire this year, you may want to pay attention.
Finding a financial advisor who puts your interest first can be the difference between a rich retirement and barely getting by, and today it’s easier than ever. SmartAsset’s free tool matches you with up to three fiduciary financial advisors that serve your area in minutes. Each advisor has been carefully vetted, and must act in your best interests. Start your search now.
Don’t waste another minute; get started right here and help your retirement dreams become a retirement reality.
Thank you for reading! Have some feedback for us?
Contact the 24/7 Wall St. editorial team.
