
Incomes are rising rapidly in the United States. According to estimates from the U.S. Census Bureau, the national median household income was nearly $75,000 in 2022, up from about $69,700 in 2021. The 7.2% increase was the largest recorded year-over-year since at least the mid-1990s.
While the typical American household is earning more than ever before, incomes have not been rising fast enough to offset inflation. Throughout 2022, the average rate of inflation hit a 40-year high of 8%, four times the Federal Reserve’s 2% target rate. Accounting for the rising cost of living, real incomes in the U.S. fell by nearly 5% between 2019 and 2022.
While no one has been spared from surging prices, Americans on the low end of the income spectrum have bore the brunt. During inflationary periods, higher-income Americans can cut back on spending and reduce the impact of rising costs. Meanwhile, lower earning Americans, who spend a larger share of their income on necessities such as food, housing, and gas, cannot.
Washington has a median household income of $90,325. But in many parts of the state, the typical household earns far less than the statewide median.
Using five-year estimates from the U.S. Census Bureau’s 2022 American Community Survey, 24/7 Wall St. identified the 35 poorest counties in Washington. Counties in the state are ranked on median household income. Population, poverty, and unemployment data are also five-year estimates from the 2022 ACS.
Among the counties on this list, median household incomes are anywhere from about $200 to $41,000 below the statewide median. In many of these counties, levels of financial hardship are underscored by widespread poverty. In all but seven counties on this list, the share of residents living below the poverty line exceeds the 9.9% statewide poverty rate.
These are the poorest counties in Washington.
35. Clark County

- Median household income: $90,115
- Poverty rate: 8.9%
- 5-yr. avg. unemployment rate: 5.2%
- Population: 504,091
34. Thurston County

- Median household income: $88,895
- Poverty rate: 9.3%
- 5-yr. avg. unemployment rate: 5.3%
- Population: 294,272
33. Skamania County

- Median household income: $84,500
- Poverty rate: 8.6%
- 5-yr. avg. unemployment rate: 5.2%
- Population: 12,118
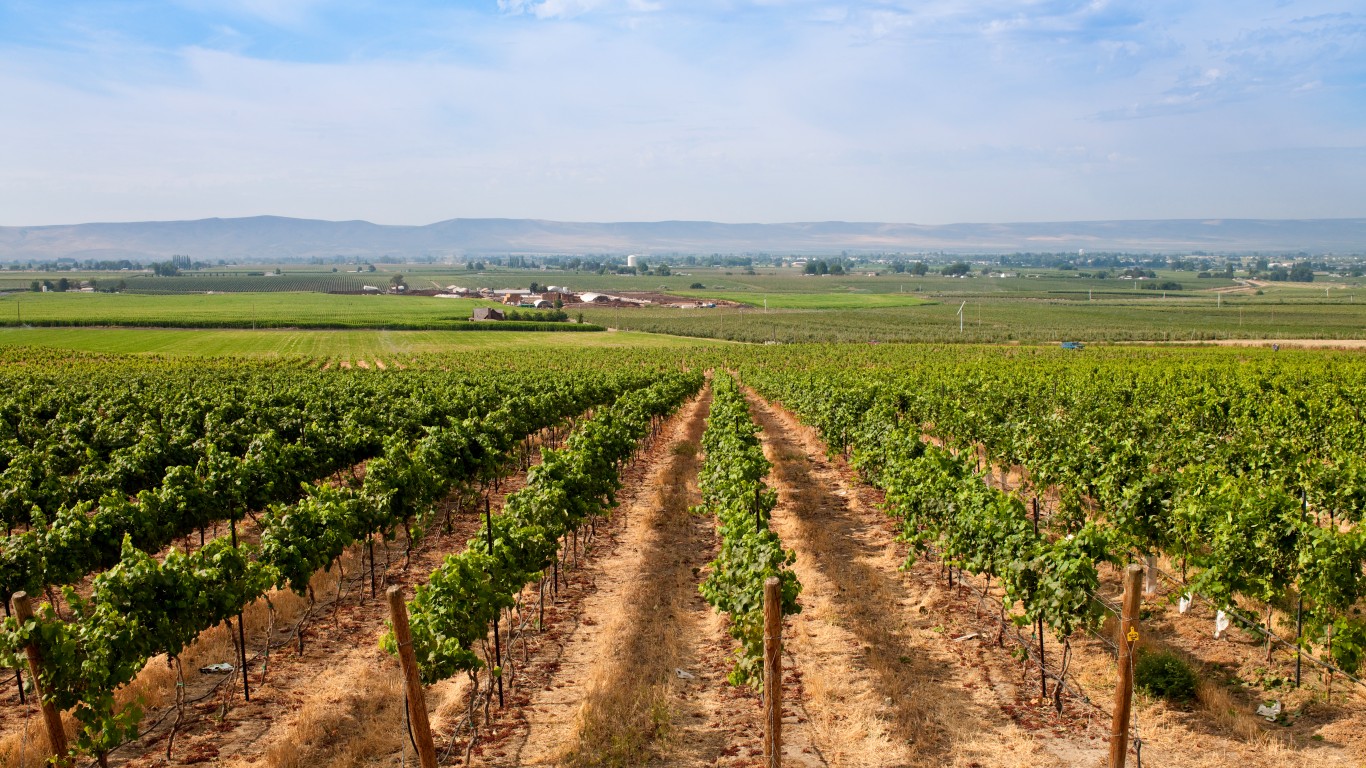
32. Benton County
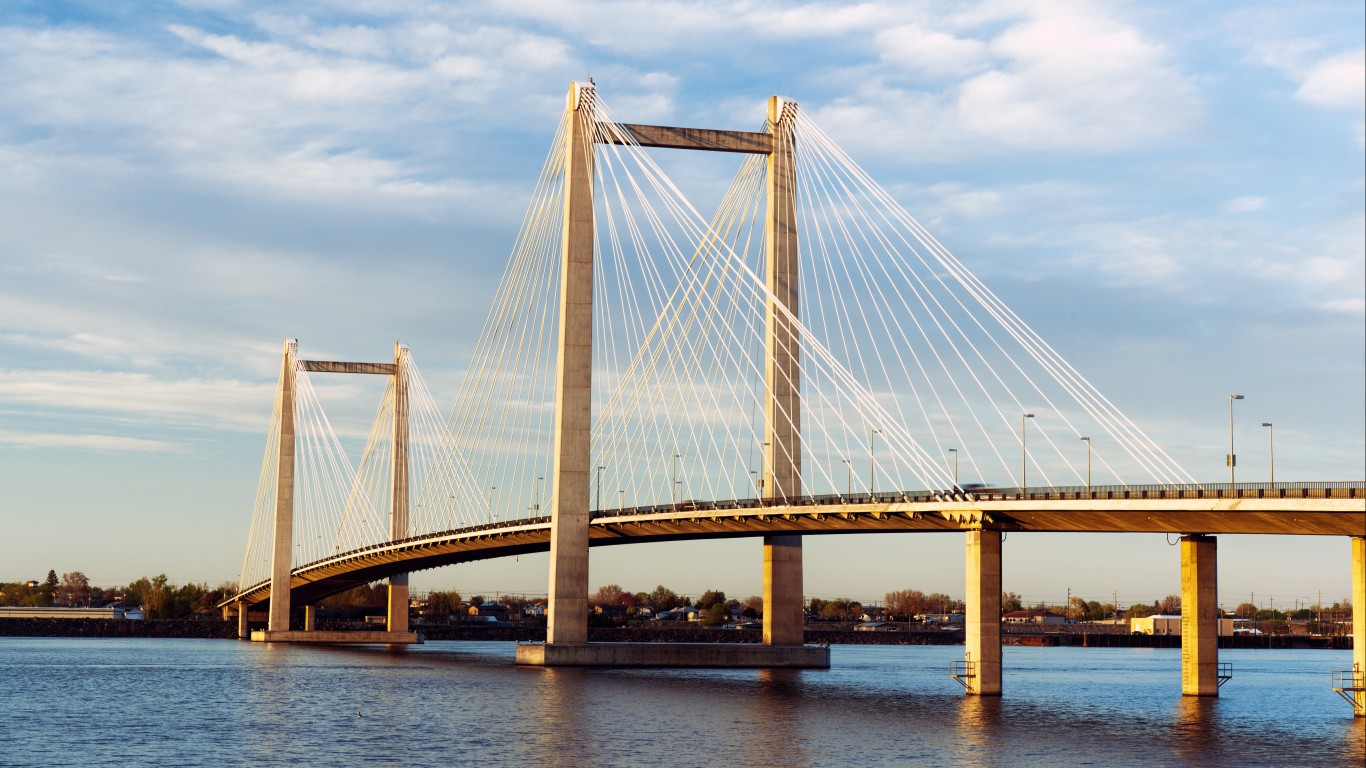
- Median household income: $83,778
- Poverty rate: 10.5%
- 5-yr. avg. unemployment rate: 4.8%
- Population: 207,560
31. Island County

- Median household income: $82,850
- Poverty rate: 6.8%
- 5-yr. avg. unemployment rate: 4.5%
- Population: 86,510
30. Skagit County

- Median household income: $82,029
- Poverty rate: 12.0%
- 5-yr. avg. unemployment rate: 5.0%
- Population: 129,480
29. Douglas County

- Median household income: $79,422
- Poverty rate: 7.9%
- 5-yr. avg. unemployment rate: 4.3%
- Population: 43,189
28. Franklin County
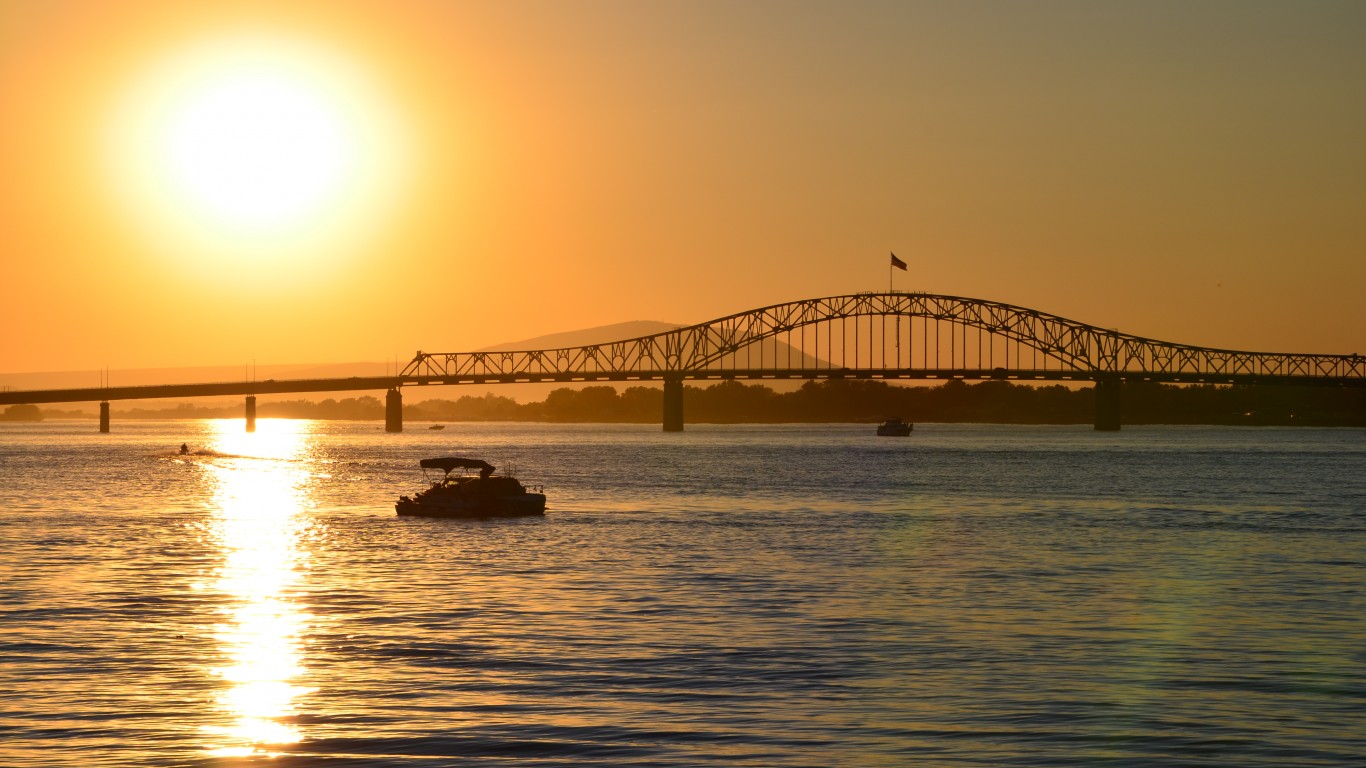
- Median household income: $77,877
- Poverty rate: 13.4%
- 5-yr. avg. unemployment rate: 5.7%
- Population: 96,692
27. Whatcom County

- Median household income: $77,581
- Poverty rate: 12.9%
- 5-yr. avg. unemployment rate: 4.9%
- Population: 226,523
26. San Juan County

- Median household income: $76,745
- Poverty rate: 11.0%
- 5-yr. avg. unemployment rate: 3.2%
- Population: 18,001
25. Mason County

- Median household income: $74,388
- Poverty rate: 12.9%
- 5-yr. avg. unemployment rate: 6.2%
- Population: 66,053
24. Chelan County

- Median household income: $71,876
- Poverty rate: 9.2%
- 5-yr. avg. unemployment rate: 3.4%
- Population: 79,076
23. Cowlitz County
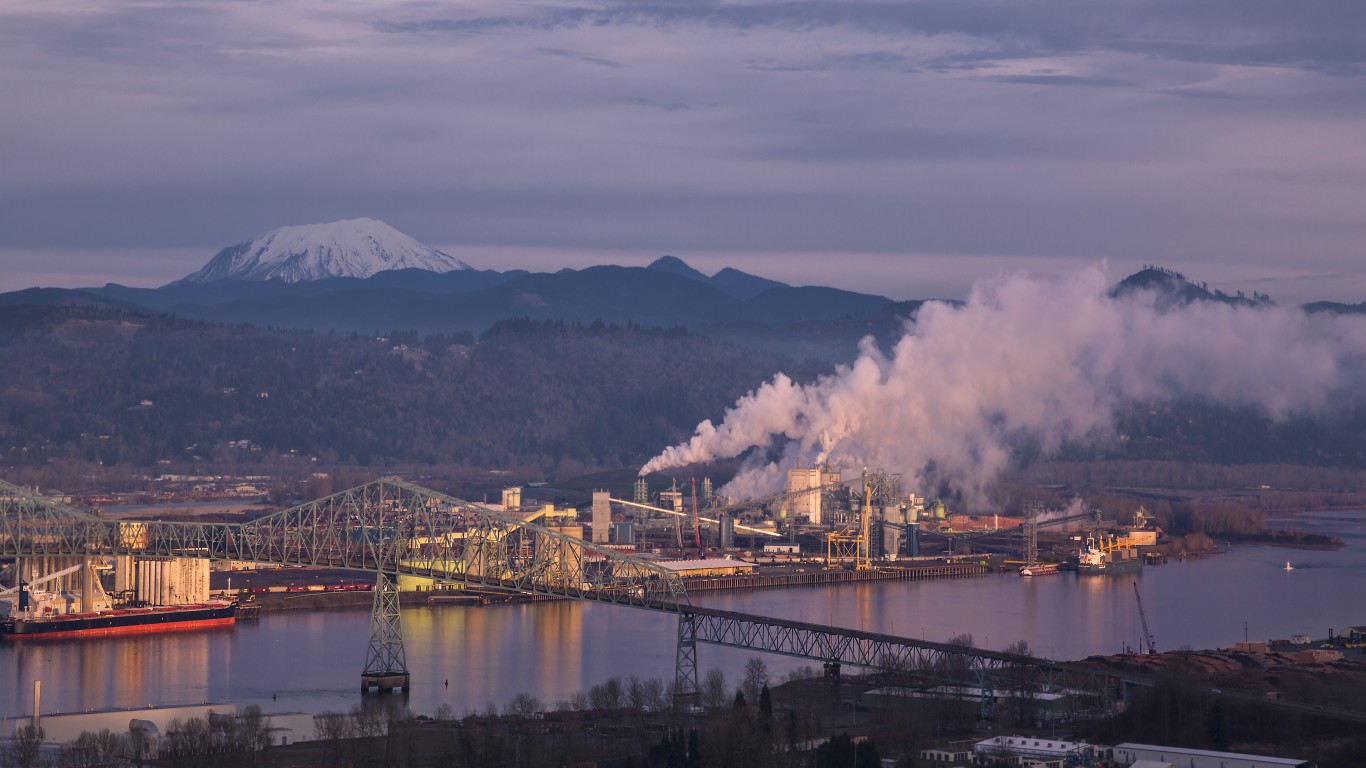
- Median household income: $70,912
- Poverty rate: 12.1%
- 5-yr. avg. unemployment rate: 5.5%
- Population: 110,621
22. Spokane County

- Median household income: $70,394
- Poverty rate: 12.3%
- 5-yr. avg. unemployment rate: 5.7%
- Population: 538,711
21. Columbia County
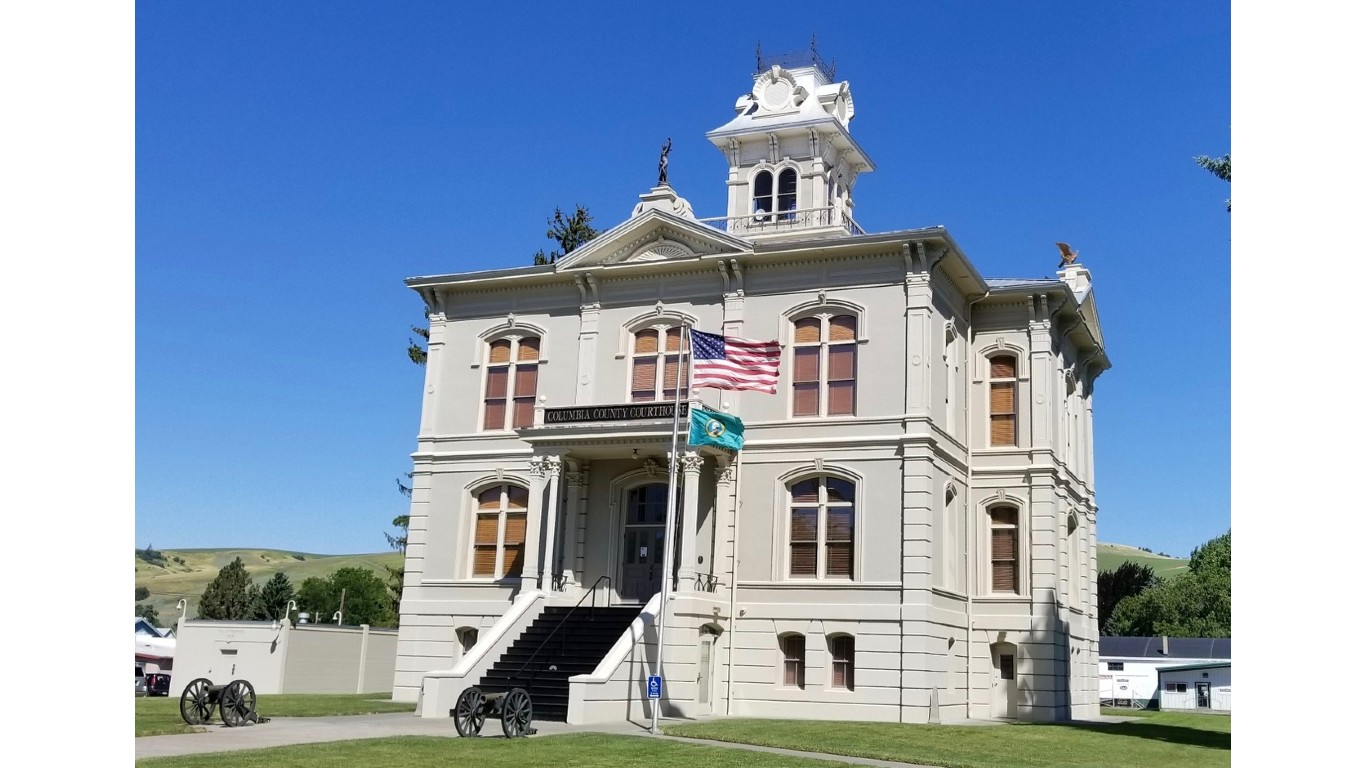
- Median household income: $68,825
- Poverty rate: 9.3%
- 5-yr. avg. unemployment rate: 3.5%
- Population: 3,980
20. Lincoln County
- Median household income: $68,172
- Poverty rate: 11.6%
- 5-yr. avg. unemployment rate: 5.3%
- Population: 11,036
19. Lewis County

- Median household income: $67,247
- Poverty rate: 12.3%
- 5-yr. avg. unemployment rate: 6.3%
- Population: 82,663
18. Kittitas County
- Median household income: $66,800
- Poverty rate: 14.5%
- 5-yr. avg. unemployment rate: 5.9%
- Population: 44,424
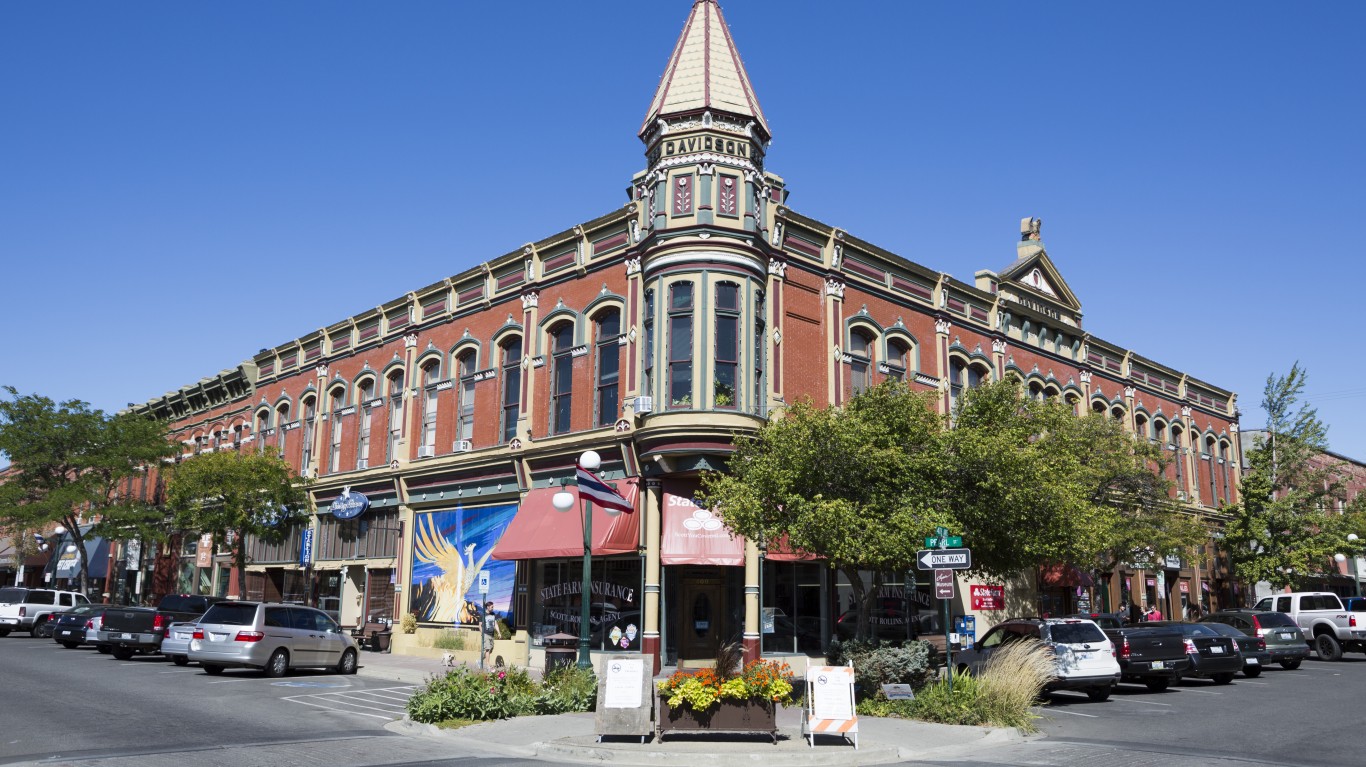
17. Walla Walla County
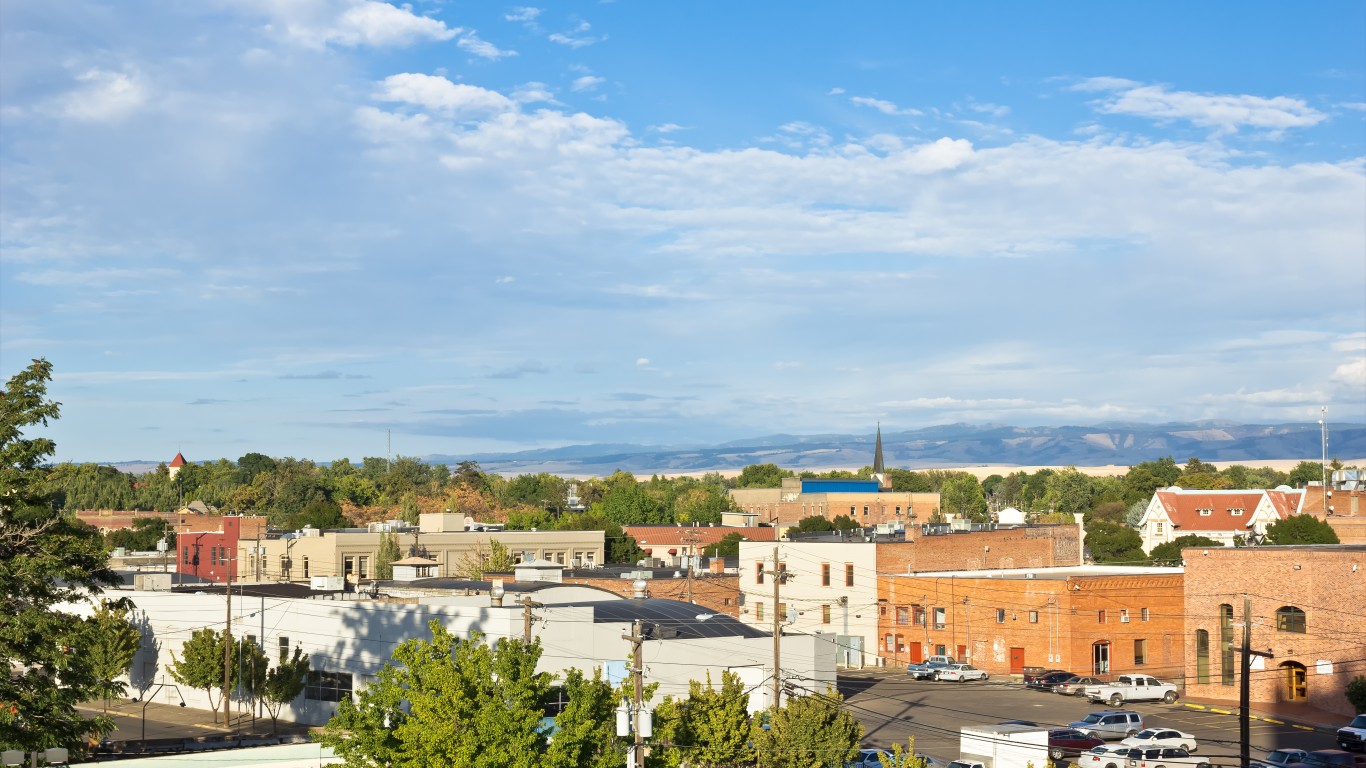
- Median household income: $66,635
- Poverty rate: 11.1%
- 5-yr. avg. unemployment rate: 5.8%
- Population: 62,150
16. Klickitat County
- Median household income: $66,581
- Poverty rate: 13.8%
- 5-yr. avg. unemployment rate: 6.9%
- Population: 22,798
15. Grant County

- Median household income: $66,387
- Poverty rate: 14.3%
- 5-yr. avg. unemployment rate: 5.4%
- Population: 99,145
14. Clallam County
- Median household income: $66,108
- Poverty rate: 10.9%
- 5-yr. avg. unemployment rate: 5.4%
- Population: 77,333
13. Yakima County
- Median household income: $64,910
- Poverty rate: 15.5%
- 5-yr. avg. unemployment rate: 7.2%
- Population: 256,143
12. Jefferson County

- Median household income: $64,796
- Poverty rate: 13.8%
- 5-yr. avg. unemployment rate: 8.4%
- Population: 33,006
11. Asotin County

- Median household income: $63,724
- Poverty rate: 16.1%
- 5-yr. avg. unemployment rate: 5.9%
- Population: 22,370
10. Adams County

- Median household income: $63,105
- Poverty rate: 20.9%
- 5-yr. avg. unemployment rate: 6.3%
- Population: 20,557
9. Stevens County

- Median household income: $62,381
- Poverty rate: 13.3%
- 5-yr. avg. unemployment rate: 5.3%
- Population: 46,774
8. Pend Oreille County

- Median household income: $59,353
- Poverty rate: 12.9%
- 5-yr. avg. unemployment rate: 6.1%
- Population: 13,570
7. Wahkiakum County
- Median household income: $59,167
- Poverty rate: 13.7%
- 5-yr. avg. unemployment rate: 3.2%
- Population: 4,476
6. Grays Harbor County

- Median household income: $59,105
- Poverty rate: 14.9%
- 5-yr. avg. unemployment rate: 6.4%
- Population: 75,672
5. Pacific County

- Median household income: $58,889
- Poverty rate: 13.2%
- 5-yr. avg. unemployment rate: 4.3%
- Population: 23,396
4. Okanogan County

- Median household income: $58,218
- Poverty rate: 18.9%
- 5-yr. avg. unemployment rate: 5.8%
- Population: 42,336
3. Garfield County

- Median household income: $57,958
- Poverty rate: 11.1%
- 5-yr. avg. unemployment rate: 6.5%
- Population: 2,310
2. Ferry County

- Median household income: $50,424
- Poverty rate: 15.5%
- 5-yr. avg. unemployment rate: 7.6%
- Population: 7,260
1. Whitman County
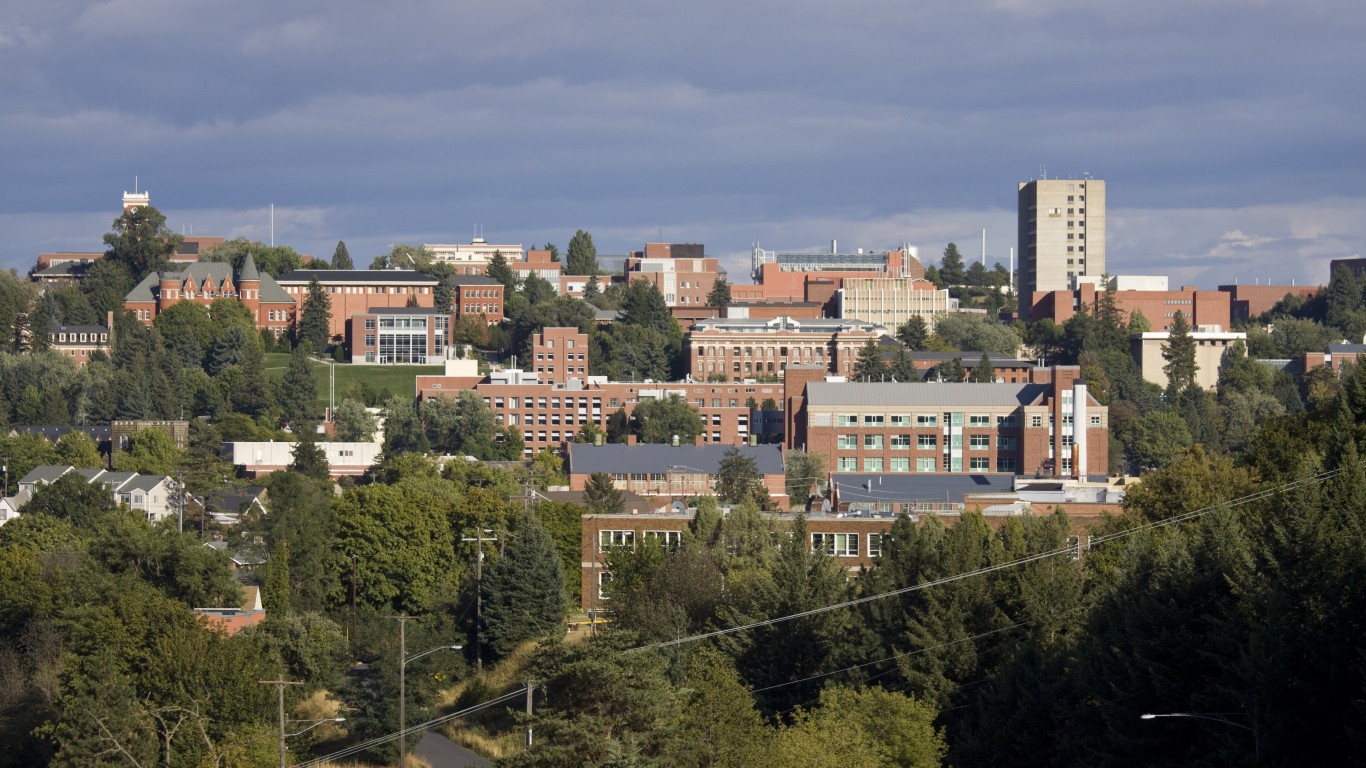
- Median household income: $49,345
- Poverty rate: 23.9%
- 5-yr. avg. unemployment rate: 6.7%
- Population: 47,141
| Rank | County | Median household income ($) | Poverty rate (%) | 5-yr. avg. unemployment rate (%) |
|---|---|---|---|---|
| 1 | Whitman, Washington | 49,345 | 23.9 | 6.7 |
| 2 | Ferry, Washington | 50,424 | 15.5 | 7.6 |
| 3 | Garfield, Washington | 57,958 | 11.1 | 6.5 |
| 4 | Okanogan, Washington | 58,218 | 18.9 | 5.8 |
| 5 | Pacific, Washington | 58,889 | 13.2 | 4.3 |
| 6 | Grays Harbor, Washington | 59,105 | 14.9 | 6.4 |
| 7 | Wahkiakum, Washington | 59,167 | 13.7 | 3.2 |
| 8 | Pend Oreille, Washington | 59,353 | 12.9 | 6.1 |
| 9 | Stevens, Washington | 62,381 | 13.3 | 5.3 |
| 10 | Adams, Washington | 63,105 | 20.9 | 6.3 |
| 11 | Asotin, Washington | 63,724 | 16.1 | 5.9 |
| 12 | Jefferson, Washington | 64,796 | 13.8 | 8.4 |
| 13 | Yakima, Washington | 64,910 | 15.5 | 7.2 |
| 14 | Clallam, Washington | 66,108 | 10.9 | 5.4 |
| 15 | Grant, Washington | 66,387 | 14.3 | 5.4 |
| 16 | Klickitat, Washington | 66,581 | 13.8 | 6.9 |
| 17 | Walla Walla, Washington | 66,635 | 11.1 | 5.8 |
| 18 | Kittitas, Washington | 66,800 | 14.5 | 5.9 |
| 19 | Lewis, Washington | 67,247 | 12.3 | 6.3 |
| 20 | Lincoln, Washington | 68,172 | 11.6 | 5.3 |
| 21 | Columbia, Washington | 68,825 | 9.3 | 3.5 |
| 22 | Spokane, Washington | 70,394 | 12.3 | 5.7 |
| 23 | Cowlitz, Washington | 70,912 | 12.1 | 5.5 |
| 24 | Chelan, Washington | 71,876 | 9.2 | 3.4 |
| 25 | Mason, Washington | 74,388 | 12.9 | 6.2 |
| 26 | San Juan, Washington | 76,745 | 11.0 | 3.2 |
| 27 | Whatcom, Washington | 77,581 | 12.9 | 4.9 |
| 28 | Franklin, Washington | 77,877 | 13.4 | 5.7 |
| 29 | Douglas, Washington | 79,422 | 7.9 | 4.3 |
| 30 | Skagit, Washington | 82,029 | 12.0 | 5.0 |
| 31 | Island, Washington | 82,850 | 6.8 | 4.5 |
| 32 | Benton, Washington | 83,778 | 10.5 | 4.8 |
| 33 | Skamania, Washington | 84,500 | 8.6 | 5.2 |
| 34 | Thurston, Washington | 88,895 | 9.3 | 5.3 |
| 35 | Clark, Washington | 90,115 | 8.9 | 5.2 |
Thank you for reading! Have some feedback for us?
Contact the 24/7 Wall St. editorial team.
Latest from 24/7


Our expert who first called NVIDIA in 2009 is predicting 2025 will see a historic AI breakthrough.
You can follow him investing $500,000 of his own money on our top AI stocks for free.