Incomes are rising rapidly in the United States. According to estimates from the U.S. Census Bureau, the national median household income was nearly $75,000 in 2022, up from about $69,700 in 2021. The 7.2% increase was the largest recorded year-over-year since at least the mid-1990s.
While the typical American household is earning more than ever before, incomes have not been rising fast enough to offset inflation. Throughout 2022, the average rate of inflation hit a 40-year high of 8%, four times the Federal Reserve’s 2% target rate. Accounting for the rising cost of living, real incomes in the U.S. fell by nearly 5% between 2019 and 2022.
While no one has been spared from surging prices, Americans on the low end of the income spectrum have bore the brunt. During inflationary periods, higher-income Americans can cut back on spending and reduce the impact of rising costs. Meanwhile, lower earning Americans, who spend a larger share of their income on necessities such as food, housing, and gas, cannot.
Massachusetts has a median household income of $96,505. But in many parts of the state, the typical household earns far less than the statewide median.
Using five-year estimates from the U.S. Census Bureau’s 2022 American Community Survey, 24/7 Wall St. identified the 10 poorest counties in Massachusetts. Counties in the state are ranked on median household income. Population, poverty, and unemployment data are also five-year estimates from the 2022 ACS.
Among the counties on this list, median household incomes are anywhere from about $2,100 to $29,900 below the statewide median. In many of these counties, levels of financial hardship are underscored by widespread poverty. In all but three counties on this list, the share of residents living below the poverty line exceeds the 9.9% statewide poverty rate.
These are the poorest counties in Massachusetts.
10. Essex County

- Median household income: $94,378
- Poverty rate: 9.7%
- 5-yr. avg. unemployment rate: 5.3%
- Population: 806,103
9. Dukes County
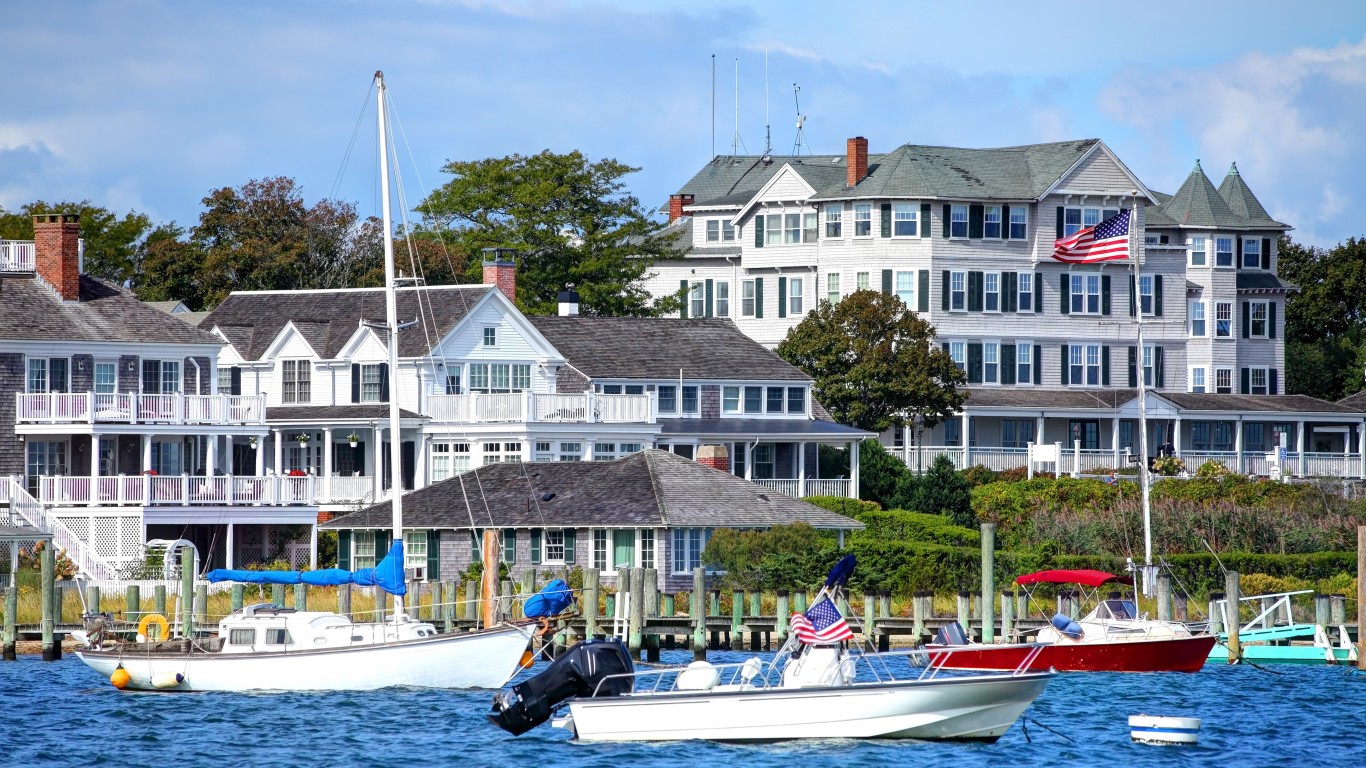
- Median household income: $93,225
- Poverty rate: 6.7%
- 5-yr. avg. unemployment rate: 7.0%
- Population: 20,543
8. Barnstable County

- Median household income: $90,447
- Poverty rate: 7.0%
- 5-yr. avg. unemployment rate: 4.4%
- Population: 229,436
7. Worcester County

- Median household income: $88,524
- Poverty rate: 10.0%
- 5-yr. avg. unemployment rate: 5.6%
- Population: 858,898
6. Suffolk County

- Median household income: $87,669
- Poverty rate: 17.0%
- 5-yr. avg. unemployment rate: 6.7%
- Population: 785,443
5. Hampshire County
- Median household income: $84,025
- Poverty rate: 10.6%
- 5-yr. avg. unemployment rate: 5.3%
- Population: 153,931
4. Bristol County

- Median household income: $80,628
- Poverty rate: 11.1%
- 5-yr. avg. unemployment rate: 5.7%
- Population: 576,699
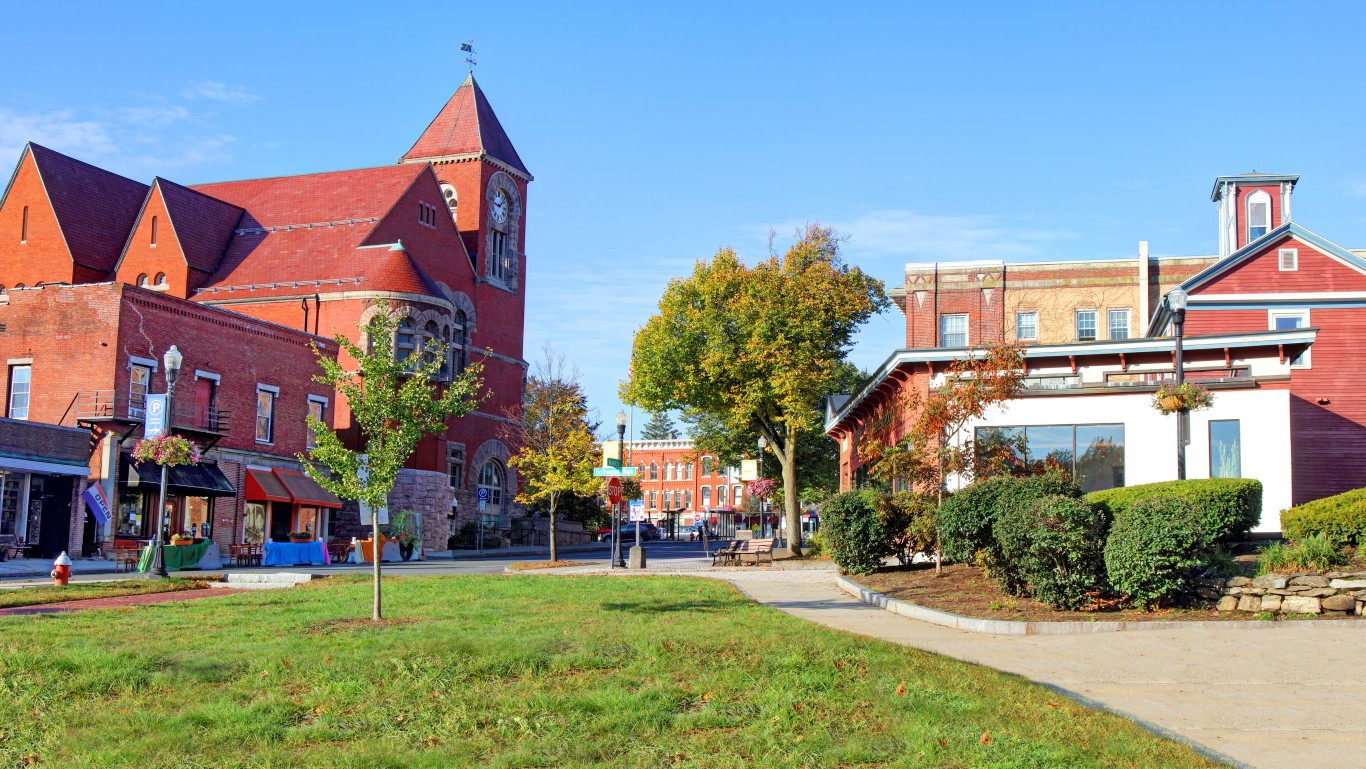
3. Franklin County

- Median household income: $70,383
- Poverty rate: 12.0%
- 5-yr. avg. unemployment rate: 5.7%
- Population: 70,980
2. Berkshire County

- Median household income: $69,744
- Poverty rate: 11.0%
- 5-yr. avg. unemployment rate: 5.3%
- Population: 128,763
1. Hampden County

- Median household income: $66,619
- Poverty rate: 15.8%
- 5-yr. avg. unemployment rate: 6.2%
- Population: 464,575
| Rank | County | Median household income ($) | Poverty rate (%) | 5-yr. avg. unemployment rate (%) |
|---|---|---|---|---|
| 1 | Hampden, Massachusetts | 66,619 | 15.8 | 6.2 |
| 2 | Berkshire, Massachusetts | 69,744 | 11.0 | 5.3 |
| 3 | Franklin, Massachusetts | 70,383 | 12.0 | 5.7 |
| 4 | Bristol, Massachusetts | 80,628 | 11.1 | 5.7 |
| 5 | Hampshire, Massachusetts | 84,025 | 10.6 | 5.3 |
| 6 | Suffolk, Massachusetts | 87,669 | 17.0 | 6.7 |
| 7 | Worcester, Massachusetts | 88,524 | 10.0 | 5.6 |
| 8 | Barnstable, Massachusetts | 90,447 | 7.0 | 4.4 |
| 9 | Dukes, Massachusetts | 93,225 | 6.7 | 7.0 |
| 10 | Essex, Massachusetts | 94,378 | 9.7 | 5.3 |