Special Report

Southern Cities Experiencing the Worst Heat Waves Right Now

A hot wave, also known as a heatwave, occurs when temperatures soar significantly above the average for a prolonged period, often leading to health risks, power outages, and increased wildfire hazards
simon jhuan / Shutterstock.com

The unrelenting, record-breaking heat wave gripping much of the U.S. since the beginning of July is not abating. As of Monday, over 146 million Americans were under heat alert, according to Heat.gov. While the heat wave might ease in some areas of the country, it will continue at high intensity to scorch the West for a third week.

So far, the heat wave has been tied to at least 30 fatalities in the West. It blistered through much of the U.S. over the last week — in the West, parts of the South, Southeast, mid-Atlantic, and southern New England. According to a recent advisory from the National Weather Service, while some parts of the country will start experiencing damp and cooler weather, triple-digit heat is forecast to persist in the interior Pacific Northwest, the Desert Southwest, and the southern Plains.

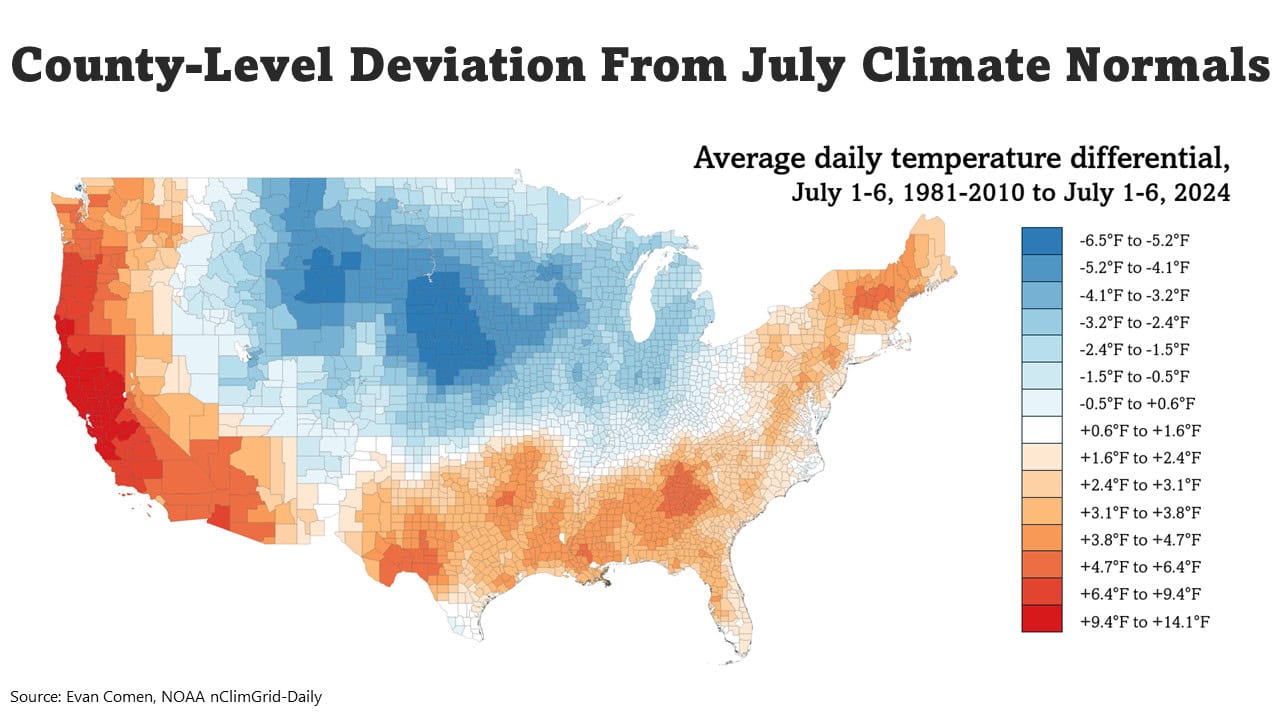
To determine the southern cities experiencing the worst heat waves right now, 24/7 Wall St. reviewed county-level data on daily average temperature from the NOAA’s nClimGrid-Daily program. County seats were ranked based on the raw differential in average daily temperature from the period July 1-6, 1981-2010 to July-16, 2024. Only county seats with at least 10,000 residents were considered. Data on population is from the U.S. Census Bureau’s 2022 American Community Survey.

It is important to emphasize that our list aims to find how much hotter it is in certain cities compared to their normal temperatures, so it considers the deviation from normal temperatures — how much hotter current temperatures are compared to historic normals (rather than how high the temperatures are). Also, the list only considers the week of 1-6 July, and some records have been broken since.

The 50 cities on the list are in six states: 31 are in Georgia, seven are in Texas, five in Arizona, three each in Oklahoma and Alabama, and one in Louisiana. (While these cities are all on the East Coast, see nationwide the Cities Experiencing The Worst Heat Waves Right Now.)

The range of deviation from historic normal temperature among the 50 cities is 4.6 degrees (in Durant, Oklahoma) to 6.7 degrees (in Yuma, Arizona). While this list is not necessarily about the hottest temperatures reached, all but one of the cities on the list averaged temperatures in the 80s, including three where temperatures were over 90 degrees Fahrenheit the first week of July. In Yuma, not only was the deviation the largest, but the average temperature was the hottest at 97.5 degrees.

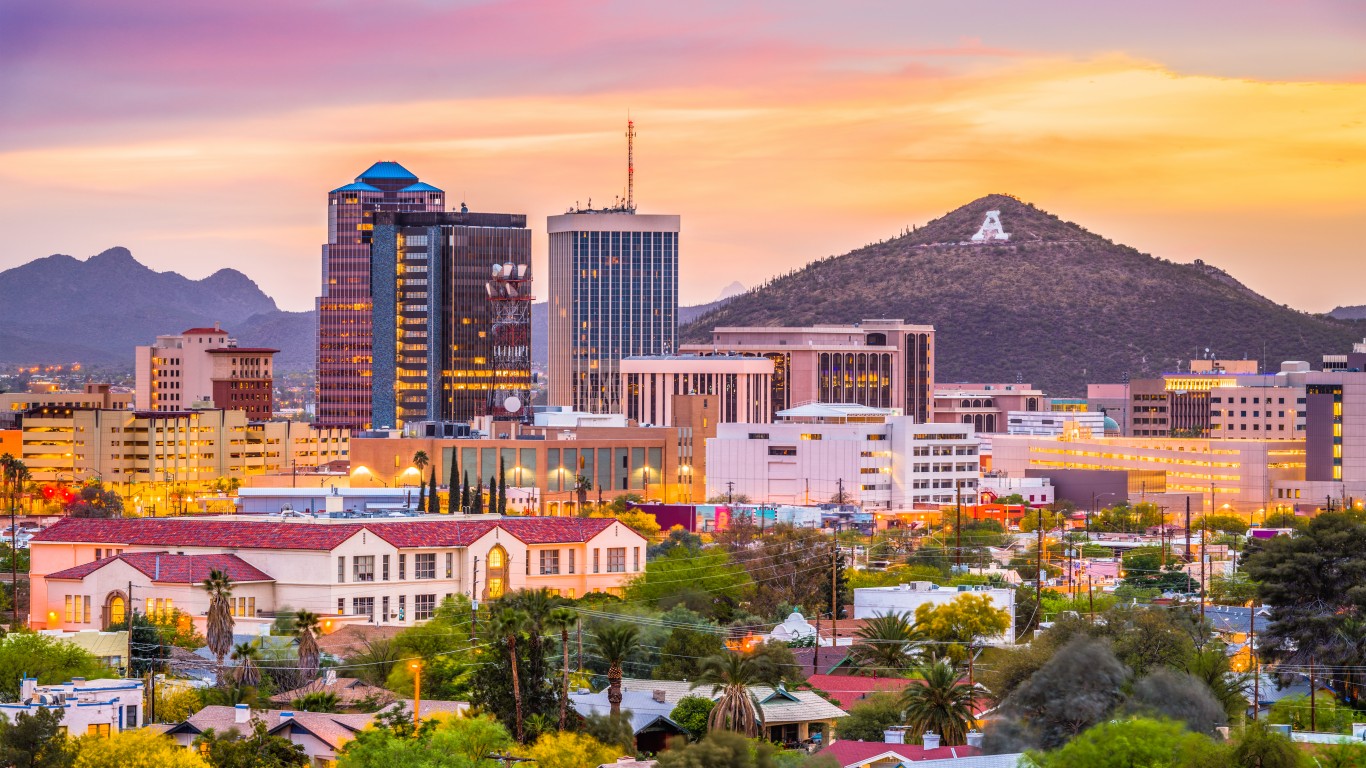
The largest city on the list is Phoenix, which had the second highest deviation from temperature normals. Over 1.6 million Americans in the city sweated under 96.3 degrees, or 6.1 hotter than normal. Following Phoenix, another Arizona city, Tucson, abnormally high temperatures affected the most people, at about half a million in the city proper. Atlanta, too, experienced much hotter weather than normal

Why this matters

24/7 Wall St.
Climate change is worsening all kinds of extreme weather globally, but much of it is related to heat — as heat fuels other types of extreme weather. Scientists’ analysis found that certain extreme heat waves last year indeed could not have been possible without climate change. Add to that the fact that extreme heat is the deadliest form of weather globally, and population exposure to extreme heat is increasing. One way to understand how climate change is affecting us is by looking at the deviation of temperatures from normal historic temperatures.

50. Durant, OK (Bryan County)

  • Avg. temperature, July 1-6, 2024: 86.0°F (+4.6°F hotter than normal)
  • Avg. temperature, July 1-6, 1981-2010: 81.4°F
  • Total population: 18,759

49. Baton Rouge, LA (East Baton Rouge Parish)

Spatms / Wikimedia Commons
  • Avg. temperature, July 1-6, 2024: 86.2°F (+4.6°F hotter than normal)
  • Avg. temperature, July 1-6, 1981-2010: 81.5°F
  • Total population: 225,500

48. Clanton, AL (Chilton County)

  • Avg. temperature, July 1-6, 2024: 83.8°F (+4.6°F hotter than normal)
  • Avg. temperature, July 1-6, 1981-2010: 79.1°F
  • Total population: 8,776

47. Talladega, AL (Talladega County)

  • Avg. temperature, July 1-6, 2024: 83.2°F (+4.6°F hotter than normal)
  • Avg. temperature, July 1-6, 1981-2010: 78.5°F
  • Total population: 15,071

46. Idabel, OK (McCurtain County)

yodudedan / Flickr
  • Avg. temperature, July 1-6, 2024: 83.8°F (+4.7°F hotter than normal)
  • Avg. temperature, July 1-6, 1981-2010: 79.1°F
  • Total population: 6,994

45. Anniston, AL (Calhoun County)

John McQuiston / iStock via Getty Images
  • Avg. temperature, July 1-6, 2024: 82.7°F (+4.7°F hotter than normal)
  • Avg. temperature, July 1-6, 1981-2010: 78.0°F
  • Total population: 21,502

44. Greenville, TX (Hunt County)

  • Avg. temperature, July 1-6, 2024: 86.5°F (+4.7°F hotter than normal)
  • Avg. temperature, July 1-6, 1981-2010: 81.7°F
  • Total population: 28,923

43. Thomaston, GA (Upson County)

  • Avg. temperature, July 1-6, 2024: 83.5°F (+4.7°F hotter than normal)
  • Avg. temperature, July 1-6, 1981-2010: 78.7°F
  • Total population: 9,720

42. San Angelo, TX (Tom Green County)

DenisTangneyJr / iStock via Getty Images
  • Avg. temperature, July 1-6, 2024: 86.3°F (+4.7°F hotter than normal)
  • Avg. temperature, July 1-6, 1981-2010: 81.5°F
  • Total population: 99,422

41. Griffin, GA (Spalding County)

  • Avg. temperature, July 1-6, 2024: 83.2°F (+4.8°F hotter than normal)
  • Avg. temperature, July 1-6, 1981-2010: 78.4°F
  • Total population: 23,485

40. McDonough, GA (Henry County)

BOB WESTON / iStock via Getty Images
  • Avg. temperature, July 1-6, 2024: 83.3°F (+4.8°F hotter than normal)
  • Avg. temperature, July 1-6, 1981-2010: 78.5°F
  • Total population: 29,134

39. Paris, TX (Lamar County)

  • Avg. temperature, July 1-6, 2024: 85.9°F (+4.8°F hotter than normal)
  • Avg. temperature, July 1-6, 1981-2010: 81.1°F
  • Total population: 24,574

38. Kingman, AZ (Mohave County)

  • Avg. temperature, July 1-6, 2024: 88.4°F (+4.8°F hotter than normal)
  • Avg. temperature, July 1-6, 1981-2010: 83.5°F
  • Total population: 33,052

37. Barnesville, GA (Lamar County)

File:Lamar County Georgia Courthouse.jpg by John Trainor / BY 2.0 (https://creativecommons.org/licenses/by/2.0/)
  • Avg. temperature, July 1-6, 2024: 83.2°F (+4.8°F hotter than normal)
  • Avg. temperature, July 1-6, 1981-2010: 78.4°F
  • Total population: 6,200

36. Fort Stockton, TX (Pecos County)

  • Avg. temperature, July 1-6, 2024: 86.2°F (+4.9°F hotter than normal)
  • Avg. temperature, July 1-6, 1981-2010: 81.3°F
  • Total population: 8,404

35. LaGrange, GA (Troup County)

  • Avg. temperature, July 1-6, 2024: 83.3°F (+4.9°F hotter than normal)
  • Avg. temperature, July 1-6, 1981-2010: 78.4°F
  • Total population: 31,173

34. Bonham, TX (Fannin County)

BOB WESTON / Getty Images
  • Avg. temperature, July 1-6, 2024: 86.4°F (+5.0°F hotter than normal)
  • Avg. temperature, July 1-6, 1981-2010: 81.4°F
  • Total population: 10,485

33. Tucson, AZ (Pima County)

Sean Pavone / iStock via Getty Images
  • Avg. temperature, July 1-6, 2024: 91.0°F (+5.0°F hotter than normal)
  • Avg. temperature, July 1-6, 1981-2010: 86.1°F
  • Total population: 541,033

32. Jackson, GA (Butts County)

BOB WESTON / Getty Images
  • Avg. temperature, July 1-6, 2024: 83.7°F (+5.0°F hotter than normal)
  • Avg. temperature, July 1-6, 1981-2010: 78.7°F
  • Total population: 5,497

31. Conyers, GA (Rockdale County)

Skarg / Wikimedia Commons
  • Avg. temperature, July 1-6, 2024: 83.2°F (+5.0°F hotter than normal)
  • Avg. temperature, July 1-6, 1981-2010: 78.3°F
  • Total population: 17,415

30. Gainesville, GA (Hall County)

BOB WESTON / iStock via Getty Images
  • Avg. temperature, July 1-6, 2024: 81.3°F (+5.0°F hotter than normal)
  • Avg. temperature, July 1-6, 1981-2010: 76.3°F
  • Total population: 42,780

29. Hugo, OK (Choctaw County)

Larry D. Moore / Wikimedia Commons
  • Avg. temperature, July 1-6, 2024: 85.6°F (+5.0°F hotter than normal)
  • Avg. temperature, July 1-6, 1981-2010: 80.6°F
  • Total population: 5,178

28. Jefferson, GA (Jackson County)

BOB WESTON / iStock via Getty Images
  • Avg. temperature, July 1-6, 2024: 82.5°F (+5.0°F hotter than normal)
  • Avg. temperature, July 1-6, 1981-2010: 77.5°F
  • Total population: 13,496

27. Athens-Clarke County, GA (Clarke County)

  • Avg. temperature, July 1-6, 2024: 82.9°F (+5.0°F hotter than normal)
  • Avg. temperature, July 1-6, 1981-2010: 77.9°F
  • Total population: 126,672

26. Decatur, GA (DeKalb County)

  • Avg. temperature, July 1-6, 2024: 82.9°F (+5.0°F hotter than normal)
  • Avg. temperature, July 1-6, 1981-2010: 77.9°F
  • Total population: 24,421

25. Fayetteville, GA (Fayette County)

Courtesy of the City of Fayetteville via fayetteville-ga.gov/
  • Avg. temperature, July 1-6, 2024: 83.1°F (+5.0°F hotter than normal)
  • Avg. temperature, July 1-6, 1981-2010: 78.1°F
  • Total population: 19,010

24. Covington, GA (Newton County)

  • Avg. temperature, July 1-6, 2024: 83.4°F (+5.1°F hotter than normal)
  • Avg. temperature, July 1-6, 1981-2010: 78.4°F
  • Total population: 14,190

23. Monroe, GA (Walton County)

BOB WESTON / iStock via Getty Images
  • Avg. temperature, July 1-6, 2024: 82.9°F (+5.1°F hotter than normal)
  • Avg. temperature, July 1-6, 1981-2010: 77.8°F
  • Total population: 15,036

22. Winder, GA (Barrow County)

  • Avg. temperature, July 1-6, 2024: 82.5°F (+5.1°F hotter than normal)
  • Avg. temperature, July 1-6, 1981-2010: 77.4°F
  • Total population: 18,414

21. LaFayette, GA (Walker County)

  • Avg. temperature, July 1-6, 2024: 81.7°F (+5.2°F hotter than normal)
  • Avg. temperature, July 1-6, 1981-2010: 76.5°F
  • Total population: 6,929

20. Lawrenceville, GA (Gwinnett County)

nangnoi / iStock via Getty Images
  • Avg. temperature, July 1-6, 2024: 82.3°F (+5.2°F hotter than normal)
  • Avg. temperature, July 1-6, 1981-2010: 77.1°F
  • Total population: 30,465

19. Atlanta, GA (Fulton County)

SeanPavonePhoto / iStock via Getty Images
  • Avg. temperature, July 1-6, 2024: 82.8°F (+5.3°F hotter than normal)
  • Avg. temperature, July 1-6, 1981-2010: 77.6°F
  • Total population: 494,838

18. Del Rio, TX (Val Verde County)

M. Kaercher / iStock via Getty Images
  • Avg. temperature, July 1-6, 2024: 89.0°F (+5.3°F hotter than normal)
  • Avg. temperature, July 1-6, 1981-2010: 83.7°F
  • Total population: 34,722

17. Rome, GA (Floyd County)

  • Avg. temperature, July 1-6, 2024: 83.3°F (+5.3°F hotter than normal)
  • Avg. temperature, July 1-6, 1981-2010: 77.9°F
  • Total population: 37,621

16. Marietta, GA (Cobb County)

Cobb County, Georgia Government Building by Tyler Lahti / BY-SA 2.0 (https://creativecommons.org/licenses/by-sa/2.0/)
  • Avg. temperature, July 1-6, 2024: 82.8°F (+5.3°F hotter than normal)
  • Avg. temperature, July 1-6, 1981-2010: 77.5°F
  • Total population: 61,387

15. Newnan, GA (Coweta County)

  • Avg. temperature, July 1-6, 2024: 83.1°F (+5.3°F hotter than normal)
  • Avg. temperature, July 1-6, 1981-2010: 77.8°F
  • Total population: 42,689

14. Alpine, TX (Brewster County)

  • Avg. temperature, July 1-6, 2024: 86.2°F (+5.4°F hotter than normal)
  • Avg. temperature, July 1-6, 1981-2010: 80.9°F
  • Total population: 5,997

13. Dahlonega, GA (Lumpkin County)

Lumpkin County Georgia Courthouse by John Trainor / BY 2.0 (https://creativecommons.org/licenses/by/2.0/)
  • Avg. temperature, July 1-6, 2024: 79.2°F (+5.4°F hotter than normal)
  • Avg. temperature, July 1-6, 1981-2010: 73.8°F
  • Total population: 7,083

12. Cumming, GA (Forsyth County)

Thomson200 / Wikimedia Commons / Public Domain
  • Avg. temperature, July 1-6, 2024: 81.7°F (+5.4°F hotter than normal)
  • Avg. temperature, July 1-6, 1981-2010: 76.3°F
  • Total population: 7,371

11. Prescott, AZ (Yavapai County)

DenisTangneyJr / iStock via Getty Images
  • Avg. temperature, July 1-6, 2024: 84.4°F (+5.5°F hotter than normal)
  • Avg. temperature, July 1-6, 1981-2010: 78.9°F
  • Total population: 46,054

10. Douglasville, GA (Douglas County)

  • Avg. temperature, July 1-6, 2024: 82.7°F (+5.5°F hotter than normal)
  • Avg. temperature, July 1-6, 1981-2010: 77.2°F
  • Total population: 35,252

9. Cartersville, GA (Bartow County)

  • Avg. temperature, July 1-6, 2024: 83.2°F (+5.5°F hotter than normal)
  • Avg. temperature, July 1-6, 1981-2010: 77.7°F
  • Total population: 23,103

8. Dalton, GA (Whitfield County)

BOB WESTON / iStock via Getty Images
  • Avg. temperature, July 1-6, 2024: 82.8°F (+5.5°F hotter than normal)
  • Avg. temperature, July 1-6, 1981-2010: 77.2°F
  • Total population: 34,358

7. Cedartown, GA (Polk County)

  • Avg. temperature, July 1-6, 2024: 82.7°F (+5.5°F hotter than normal)
  • Avg. temperature, July 1-6, 1981-2010: 77.2°F
  • Total population: 10,166

6. Dallas, GA (Paulding County)

  • Avg. temperature, July 1-6, 2024: 82.6°F (+5.6°F hotter than normal)
  • Avg. temperature, July 1-6, 1981-2010: 77.0°F
  • Total population: 14,126

5. Calhoun, GA (Gordon County)

OJUP / Shutterstock.com
  • Avg. temperature, July 1-6, 2024: 83.4°F (+5.6°F hotter than normal)
  • Avg. temperature, July 1-6, 1981-2010: 77.8°F
  • Total population: 17,184

4. Canton, GA (Cherokee County)

  • Avg. temperature, July 1-6, 2024: 82.3°F (+5.6°F hotter than normal)
  • Avg. temperature, July 1-6, 1981-2010: 76.7°F
  • Total population: 33,499

3. Carrollton, GA (Carroll County)

  • Avg. temperature, July 1-6, 2024: 82.4°F (+5.7°F hotter than normal)
  • Avg. temperature, July 1-6, 1981-2010: 76.7°F
  • Total population: 26,622

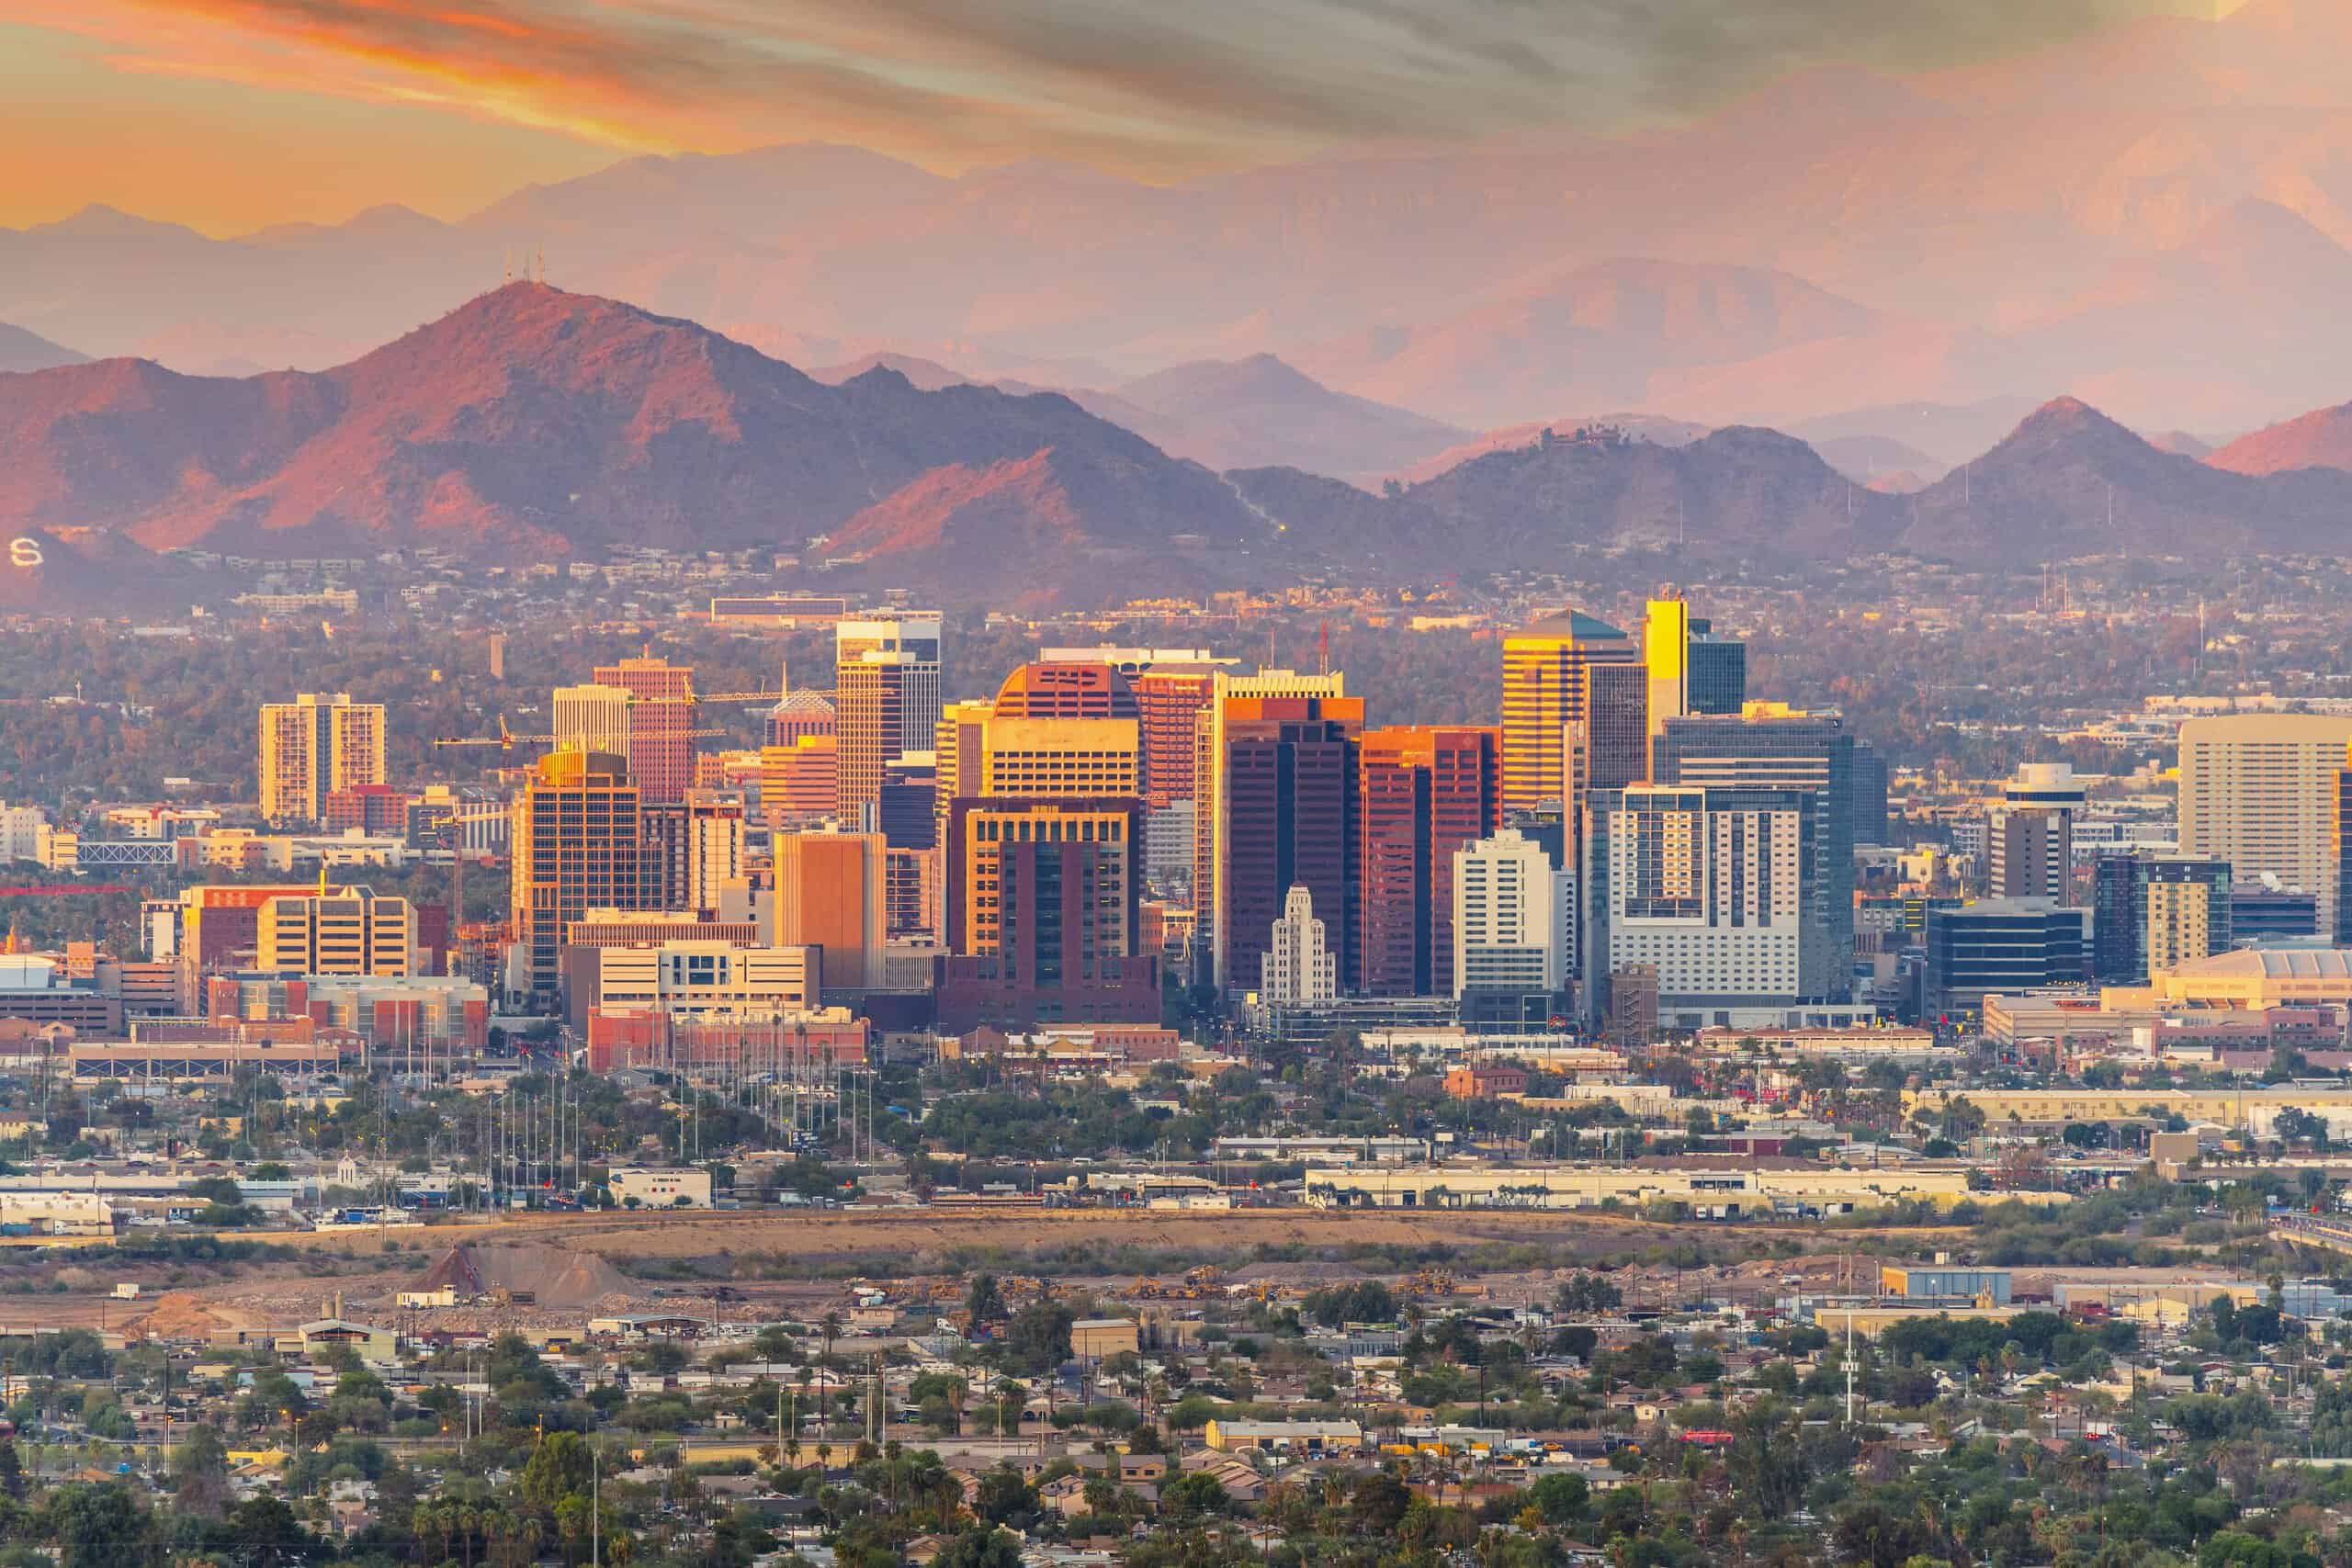
2. Phoenix, AZ (Maricopa County)

4kodiak / E+ via Getty Images
  • Avg. temperature, July 1-6, 2024: 96.3°F (+6.1°F hotter than normal)
  • Avg. temperature, July 1-6, 1981-2010: 90.1°F
  • Total population: 1,609,456

1. Yuma, AZ (Yuma County)

DenisTangneyJr / iStock via Getty Images
  • Avg. temperature, July 1-6, 2024: 97.5°F (+6.7°F hotter than normal)
  • Avg. temperature, July 1-6, 1981-2010: 90.8°F
  • Total population: 96,314

Get Ready To Retire (Sponsored)

Start by taking a quick retirement quiz from SmartAsset that will match you with up to 3 financial advisors that serve your area and beyond in 5 minutes, or less.

Each advisor has been vetted by SmartAsset and is held to a fiduciary standard to act in your best interests.

Here’s how it works:
1. Answer SmartAsset advisor match quiz
2. Review your pre-screened matches at your leisure. Check out the advisors’ profiles.
3. Speak with advisors at no cost to you. Have an introductory call on the phone or introduction in person and choose whom to work with in the future

Get started right here.

Thank you for reading! Have some feedback for us?
Contact the 24/7 Wall St. editorial team.