
24/7 Wall St. Insights
- In the United States, there are 14.2 deaths due to air pollution per 100,000 Americans each year.
- In some developed countries, however, there are nearly three times as many deaths due to air pollution.
- Most of the developed countries with the highest air pollution mortality are in Eastern Europe.
- Also: Discover the next Nvidia
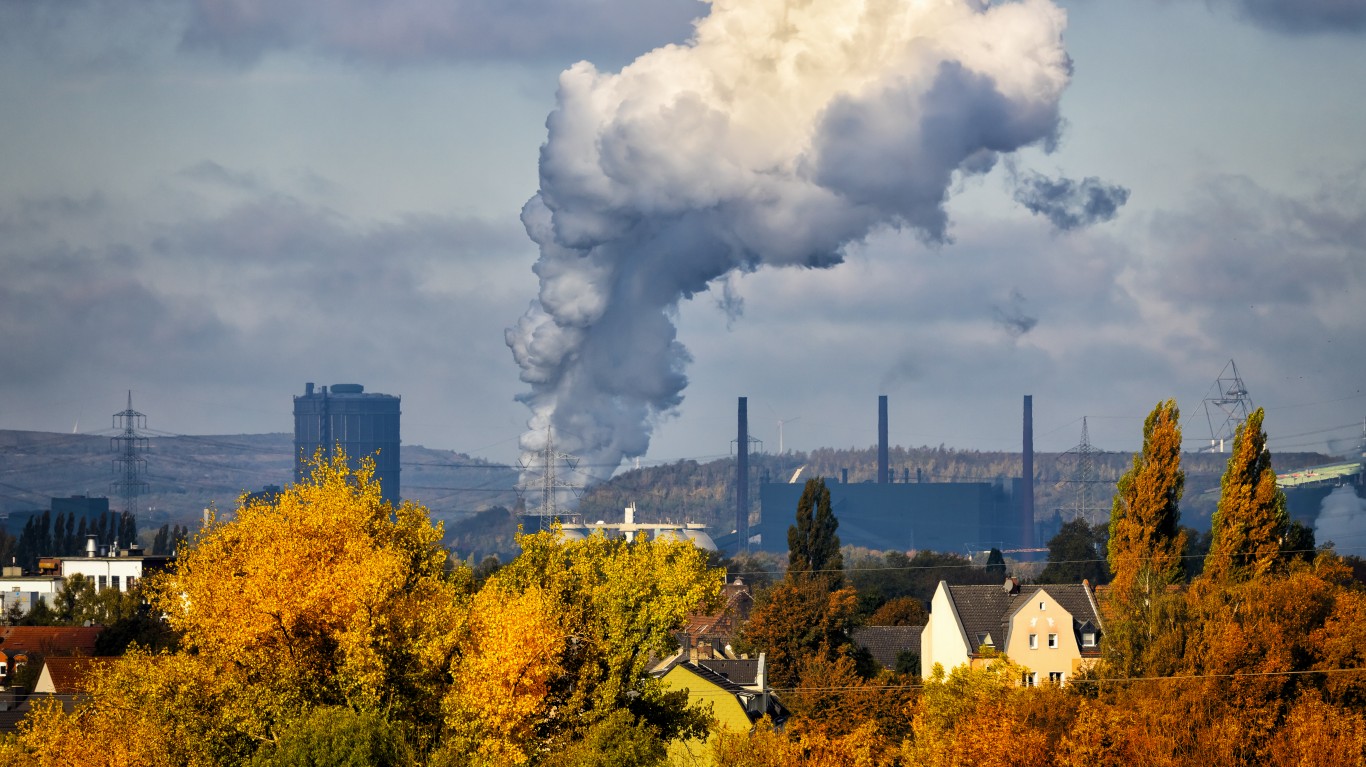
Air pollution is one of the deadliest environmental threats in the world, leading to millions of premature deaths each year. While air pollution is worst in developing, rapidly industrializing nations, many advanced economies also struggle to curb harmful emissions and contain pollutants like fine particulate matter and nitrogen oxide.
In the United States, the decline in air pollution was one of the great public health achievements of the 20th century, aided by the passage of the Clean Air Act in 1963 and other wide-reaching environmental regulations. But while there are currently 14.2 annual deaths due to air pollution per 100,000 Americans, in some developed countries the mortality rate due to air pollution is nearly three times that. No amount of particulate matter is safe to breathe, and pollution from transportation, industry, and wildfires can lead to significant health burdens and premature death. A closer look at the data reveals the developed countries where air pollution kills the most people.
To determine the developed countries where air pollution kills the most people, 24/7 Wall St. reviewed data on mortality due to air pollution from the World Bank. Countries designated as advanced economies by the International Monetary Fund were ranked based on the annual mortality rate attributed to household and ambient air pollution. Mortality rates are age-standardized, and include respiratory infections estimated for all ages, cerebrovascular diseases in adults, ischaemic heart diseases in adults, chronic obstructive pulmonary diseases in adults, and lung cancer in adults. Supplemental data on the mean annual exposure to PM2.5 air pollution, the percentage of the population exposed to PM2.5 levels exceeding WHO guidelines, and GNI per capita are also from the World Bank. All data is for the most recent period available.
34. Finland

- Mortality rate attributed to air pollution: 7.4 deaths per 100,000 residents
- Mean annual exposure to PM2.5 air pollution: 4.9 micrograms per cubic meter
- Population exposed to PM2.5 air pollution levels exceeding WHO guidelines: 0.0%
- Gross national income: $61,910 per capita
33. Norway

- Mortality rate attributed to air pollution: 7.9 deaths per 100,000 residents
- Mean annual exposure to PM2.5 air pollution: 6.1 micrograms per cubic meter
- Population exposed to PM2.5 air pollution levels exceeding WHO guidelines: 2.0%
- Gross national income: $105,340 per capita
32. Sweden

- Mortality rate attributed to air pollution: 8.1 deaths per 100,000 residents
- Mean annual exposure to PM2.5 air pollution: 5.6 micrograms per cubic meter
- Population exposed to PM2.5 air pollution levels exceeding WHO guidelines: 3.6%
- Gross national income: $69,500 per capita
31. Canada

- Mortality rate attributed to air pollution: 8.1 deaths per 100,000 residents
- Mean annual exposure to PM2.5 air pollution: 6.6 micrograms per cubic meter
- Population exposed to PM2.5 air pollution levels exceeding WHO guidelines: 0.0%
- Gross national income: $62,540 per capita
30. Iceland

- Mortality rate attributed to air pollution: 8.2 deaths per 100,000 residents
- Mean annual exposure to PM2.5 air pollution: 5.1 micrograms per cubic meter
- Population exposed to PM2.5 air pollution levels exceeding WHO guidelines: 10.3%
- Gross national income: $77,490 per capita
29. Australia

- Mortality rate attributed to air pollution: 9.8 deaths per 100,000 residents
- Mean annual exposure to PM2.5 air pollution: 8.3 micrograms per cubic meter
- Population exposed to PM2.5 air pollution levels exceeding WHO guidelines: 24.9%
- Gross national income: $67,310 per capita
28. Portugal

- Mortality rate attributed to air pollution: 10.0 deaths per 100,000 residents
- Mean annual exposure to PM2.5 air pollution: 8.5 micrograms per cubic meter
- Population exposed to PM2.5 air pollution levels exceeding WHO guidelines: 16.0%
- Gross national income: $46,010 per capita
27. France

- Mortality rate attributed to air pollution: 10.0 deaths per 100,000 residents
- Mean annual exposure to PM2.5 air pollution: 9.6 micrograms per cubic meter
- Population exposed to PM2.5 air pollution levels exceeding WHO guidelines: 78.2%
- Gross national income: $58,920 per capita
26. Spain

- Mortality rate attributed to air pollution: 10.1 deaths per 100,000 residents
- Mean annual exposure to PM2.5 air pollution: 9.6 micrograms per cubic meter
- Population exposed to PM2.5 air pollution levels exceeding WHO guidelines: 41.1%
- Gross national income: $52,660 per capita
25. Switzerland

- Mortality rate attributed to air pollution: 10.4 deaths per 100,000 residents
- Mean annual exposure to PM2.5 air pollution: 9.1 micrograms per cubic meter
- Population exposed to PM2.5 air pollution levels exceeding WHO guidelines: 49.3%
- Gross national income: $86,820 per capita
24. Japan

- Mortality rate attributed to air pollution: 11.8 deaths per 100,000 residents
- Mean annual exposure to PM2.5 air pollution: 12.8 micrograms per cubic meter
- Population exposed to PM2.5 air pollution levels exceeding WHO guidelines: 76.8%
- Gross national income: $52,840 per capita
23. New Zealand

- Mortality rate attributed to air pollution: 12.2 deaths per 100,000 residents
- Mean annual exposure to PM2.5 air pollution: 6.5 micrograms per cubic meter
- Population exposed to PM2.5 air pollution levels exceeding WHO guidelines: 0.0%
- Gross national income: $51,780 per capita
22. Luxembourg

- Mortality rate attributed to air pollution: 12.5 deaths per 100,000 residents
- Mean annual exposure to PM2.5 air pollution: 8.7 micrograms per cubic meter
- Population exposed to PM2.5 air pollution levels exceeding WHO guidelines: 68.8%
- Gross national income: $90,540 per capita
21. Ireland

- Mortality rate attributed to air pollution: 12.8 deaths per 100,000 residents
- Mean annual exposure to PM2.5 air pollution: 8.2 micrograms per cubic meter
- Population exposed to PM2.5 air pollution levels exceeding WHO guidelines: 0.3%
- Gross national income: $94,860 per capita
20. Estonia

- Mortality rate attributed to air pollution: 12.8 deaths per 100,000 residents
- Mean annual exposure to PM2.5 air pollution: 6.1 micrograms per cubic meter
- Population exposed to PM2.5 air pollution levels exceeding WHO guidelines: 0.0%
- Gross national income: $45,270 per capita
19. Denmark

- Mortality rate attributed to air pollution: 12.9 deaths per 100,000 residents
- Mean annual exposure to PM2.5 air pollution: 9.1 micrograms per cubic meter
- Population exposed to PM2.5 air pollution levels exceeding WHO guidelines: 56.9%
- Gross national income: $75,640 per capita
18. Netherlands

- Mortality rate attributed to air pollution: 13.1 deaths per 100,000 residents
- Mean annual exposure to PM2.5 air pollution: 10.9 micrograms per cubic meter
- Population exposed to PM2.5 air pollution levels exceeding WHO guidelines: 99.6%
- Gross national income: $77,450 per capita
17. United Kingdom

- Mortality rate attributed to air pollution: 13.4 deaths per 100,000 residents
- Mean annual exposure to PM2.5 air pollution: 9.9 micrograms per cubic meter
- Population exposed to PM2.5 air pollution levels exceeding WHO guidelines: 66.5%
- Gross national income: $56,820 per capita
16. United States

- Mortality rate attributed to air pollution: 14.2 deaths per 100,000 residents
- Mean annual exposure to PM2.5 air pollution: 7.8 micrograms per cubic meter
- Population exposed to PM2.5 air pollution levels exceeding WHO guidelines: 3.3%
- Gross national income: $82,340 per capita
15. Germany
- Mortality rate attributed to air pollution: 14.7 deaths per 100,000 residents
- Mean annual exposure to PM2.5 air pollution: 10.3 micrograms per cubic meter
- Population exposed to PM2.5 air pollution levels exceeding WHO guidelines: 89.2%
- Gross national income: $70,710 per capita
14. Italy

- Mortality rate attributed to air pollution: 15.0 deaths per 100,000 residents
- Mean annual exposure to PM2.5 air pollution: 14.7 micrograms per cubic meter
- Population exposed to PM2.5 air pollution levels exceeding WHO guidelines: 94.8%
- Gross national income: $56,400 per capita
13. Israel

- Mortality rate attributed to air pollution: 15.1 deaths per 100,000 residents
- Mean annual exposure to PM2.5 air pollution: 18.6 micrograms per cubic meter
- Population exposed to PM2.5 air pollution levels exceeding WHO guidelines: 100.0%
- Gross national income: $53,400 per capita
12. Belgium

- Mortality rate attributed to air pollution: 15.3 deaths per 100,000 residents
- Mean annual exposure to PM2.5 air pollution: 11.2 micrograms per cubic meter
- Population exposed to PM2.5 air pollution levels exceeding WHO guidelines: 91.9%
- Gross national income: $69,270 per capita
11. Cyprus

- Mortality rate attributed to air pollution: 15.8 deaths per 100,000 residents
- Mean annual exposure to PM2.5 air pollution: 13.5 micrograms per cubic meter
- Population exposed to PM2.5 air pollution levels exceeding WHO guidelines: 100.0%
- Gross national income: $51,610 per capita
10. Austria

- Mortality rate attributed to air pollution: 17.5 deaths per 100,000 residents
- Mean annual exposure to PM2.5 air pollution: 10.9 micrograms per cubic meter
- Population exposed to PM2.5 air pollution levels exceeding WHO guidelines: 85.1%
- Gross national income: $70,080 per capita
9. Slovenia

- Mortality rate attributed to air pollution: 18.8 deaths per 100,000 residents
- Mean annual exposure to PM2.5 air pollution: 14.3 micrograms per cubic meter
- Population exposed to PM2.5 air pollution levels exceeding WHO guidelines: 99.5%
- Gross national income: $53,080 per capita
8. South Korea

- Mortality rate attributed to air pollution: 18.9 deaths per 100,000 residents
- Mean annual exposure to PM2.5 air pollution: 25.9 micrograms per cubic meter
- Population exposed to PM2.5 air pollution levels exceeding WHO guidelines: 100.0%
- Gross national income: $52,680 per capita
7. Malta
 by KNOW MALTA by Peter Grima from MALTA")
- Mortality rate attributed to air pollution: 20.9 deaths per 100,000 residents
- Mean annual exposure to PM2.5 air pollution: 11.7 micrograms per cubic meter
- Population exposed to PM2.5 air pollution levels exceeding WHO guidelines: 100.0%
- Gross national income: $54,820 per capita
6. Greece

- Mortality rate attributed to air pollution: 23.0 deaths per 100,000 residents
- Mean annual exposure to PM2.5 air pollution: 14.4 micrograms per cubic meter
- Population exposed to PM2.5 air pollution levels exceeding WHO guidelines: 100.0%
- Gross national income: $40,260 per capita
5. Slovak Republic

- Mortality rate attributed to air pollution: 30.3 deaths per 100,000 residents
- Mean annual exposure to PM2.5 air pollution: 15.4 micrograms per cubic meter
- Population exposed to PM2.5 air pollution levels exceeding WHO guidelines: 100.0%
- Gross national income: $42,350 per capita
4. Croatia

- Mortality rate attributed to air pollution: 31.3 deaths per 100,000 residents
- Mean annual exposure to PM2.5 air pollution: 16.1 micrograms per cubic meter
- Population exposed to PM2.5 air pollution levels exceeding WHO guidelines: 99.8%
- Gross national income: $45,330 per capita
3. Czechia

- Mortality rate attributed to air pollution: 32.5 deaths per 100,000 residents
- Mean annual exposure to PM2.5 air pollution: 14.1 micrograms per cubic meter
- Population exposed to PM2.5 air pollution levels exceeding WHO guidelines: 99.7%
- Gross national income: $49,160 per capita
2. Lithuania

- Mortality rate attributed to air pollution: 38.8 deaths per 100,000 residents
- Mean annual exposure to PM2.5 air pollution: 9.2 micrograms per cubic meter
- Population exposed to PM2.5 air pollution levels exceeding WHO guidelines: 96.0%
- Gross national income: $48,850 per capita
1. Latvia

- Mortality rate attributed to air pollution: 40.1 deaths per 100,000 residents
- Mean annual exposure to PM2.5 air pollution: 11.6 micrograms per cubic meter
- Population exposed to PM2.5 air pollution levels exceeding WHO guidelines: 89.0%
- Gross national income: $42,830 per capita
Travel Cards Are Getting Too Good To Ignore (sponsored)
Credit card companies are pulling out all the stops, with the issuers are offering insane travel rewards and perks.
We’re talking huge sign-up bonuses, points on every purchase, and benefits like lounge access, travel credits, and free hotel nights. For travelers, these rewards can add up to thousands of dollars in flights, upgrades, and luxury experiences every year.
It’s like getting paid to travel — and it’s available to qualified borrowers who know where to look.
We’ve rounded up some of the best travel credit cards on the market. Click here to see the list. Don’t miss these offers — they won’t be this good forever.
Thank you for reading! Have some feedback for us?
Contact the 24/7 Wall St. editorial team.
Latest from 24/7


Our expert who first called NVIDIA in 2009 is predicting 2025 will see a historic AI breakthrough.
You can follow him investing $500,000 of his own money on our top AI stocks for free.