NFL viewership reached historic highs in the 2023-2024 season. Across all platforms, the Feb. 11, 2024 broadcast of Super Bowl LVIII had an average of 123.4 million viewers, ranking it as the most watched program ever. Additionally, an average of 17.9 million households tuned in to each of the 272 regular season games, the second most of any year since record-keeping began in 1995.
The NFL’s surging popularity is reflected not only in television ratings, but also in live game attendance. Regular season ticket sales, as reported by ESPN, increased by 12% between 2019 and 2023 — from 16.9 million to 18.8 million. Rising consumer demand, however, has also driven up ticket prices. Most of the millions of fans who pack stadiums across the country every Sunday are now paying far more for tickets than they were even a few years ago. (Here is a look at America’s most valuable sports teams.)
Using data from TickPick, an online marketplace for tickets to live events, 24/7 Wall St. identified the NFL teams with the fastest rising ticket prices. Each team is ranked on the average annual change in the sale price of a typical, regular-season ticket over the three-year period from 2021 to 2023.
Of the 32 teams in the NFL, only seven have reported an average annual decline in ticket prices over the last three seasons. Of the 25 remaining teams, ticket prices have climbed at an average annual rate of anywhere from 1.1% to nearly 200% over the same period.
Ticket prices are largely a product of supply and demand — and in the NFL, consumer demand can hinge on any number of factors. Some of the teams that have reported the steepest increases in ticket prices have also improved meaningfully in recent years. The Detroit Lions, for example, won only 20.6% of their games in 2021, compared to 52.9% in 2022. In 2023, the Lions finished the regular season at the top of their division for the first time in three decades, with a 70.6% win-record. Unfortunately for the team’s most dedicated fans, the average ticket price in the 2023 season was $253, up from $145 in 2022 and $54 in 2021.
Many teams with soaring ticket prices also have star-players on their roster. Quarterbacks like Buffalo’s Josh Allen and Philadelphia’s Jalen Hurts have performed season after season, leading their teams to multiple consecutive playoff appearances in recent years. Ticket prices for both the Bills and the Eagles climbed at an average annual rate of more than 100% between 2021 and 2023. (Here is a look at the most popular football teams according to Baby Boomers.)
It is important to note that teams with surging ticket prices do necessarily have the league’s most expensive tickets. For example, even though the price of a Jacksonville Jaguars ticket has increased by an annual average of 150% over the last three seasons, at $145 in 2023, Jacksonville still has one of the lowest average ticket prices in the league.
Why It Matters
The NFL is the most popular professional sports league in the United States, and, from a revenue perspective, one of the most successful leagues in the world. While each of the 32 NFL teams benefit equally from national sources of revenue, like broadcasting contracts with media companies, they also generate millions of dollars from ticket sales. In recent years, certain teams have been able to justify surging ticket prices.
32. Arizona Cardinals

- Avg. annual change in ticket price, 2021-2023: -32.7%.
- Avg. ticket price by year: $186 in 2021; $150 in 2022; $81 in 2023
- Avg. home game attendance by year: 62,622 in 2021; 65,203 in 2022; 62,864 in 2023
- Reg. season win pct. by year: 64.7% in 2021; 23.5% in 2022; 23.5% in 2023
- Most recent championship win: Never
31. Indianapolis Colts

- Avg. annual change in ticket price, 2021-2023: -26.9%
- Avg. ticket price by year: $220 in 2021; $129 in 2022; $113 in 2023
- Avg. home game attendance by year: 62,475 in 2021; 65,559 in 2022; 65,230 in 2023
- Reg. season win pct. by year: 52.9% in 2021; 26.5% in 2022; 52.9% in 2023
- Most recent championship win: 2007
30. Miami Dolphins

- Avg. annual change in ticket price, 2021-2023: -19.7%
- Avg. ticket price by year: $536 in 2021; $189 in 2022; $237 in 2023
- Avg. home game attendance by year: 64,374 in 2021; 66,230 in 2022; 65,922 in 2023
- Reg. season win pct. by year: 52.9% in 2021; 52.9% in 2022; 64.7% in 2023
- Most recent championship win: 1974
29. Las Vegas Raiders

- Avg. annual change in ticket price, 2021-2023: -2.3%
- Avg. ticket price by year: $454 in 2021; $448 in 2022; $433 in 2023
- Avg. home game attendance by year: 61,185 in 2021; 62,045 in 2022; 62,190 in 2023
- Reg. season win pct. by year: 58.8% in 2021; 35.3% in 2022; 47.1% in 2023
- Most recent championship win: 1984
28. Pittsburgh Steelers
- Avg. annual change in ticket price, 2021-2023: -1.6%
- Avg. ticket price by year: $239 in 2021; $227 in 2022; $231 in 2023
- Avg. home game attendance by year: 60,488 in 2021; 66,280 in 2022; 66,977 in 2023
- Reg. season win pct. by year: 55.9% in 2021; 52.9% in 2022; 58.8% in 2023
- Most recent championship win: 2009
27. Cleveland Browns

- Avg. annual change in ticket price, 2021-2023: -1.6%
- Avg. ticket price by year: $124 in 2021; $125 in 2022; $120 in 2023
- Avg. home game attendance by year: 67,431 in 2021; 67,431 in 2022; 67,810 in 2023
- Reg. season win pct. by year: 47.1% in 2021; 41.2% in 2022; 64.7% in 2023
- Most recent championship win: Never
26. New England Patriots

- Avg. annual change in ticket price, 2021-2023: -0.3%
- Avg. ticket price by year: $276 in 2021; $286 in 2022; $274 in 2023
- Avg. home game attendance by year: 65,878 in 2021; 65,878 in 2022; 63,018 in 2023
- Reg. season win pct. by year: 58.8% in 2021; 47.1% in 2022; 23.5% in 2023
- Most recent championship win: 2019
25. Tennessee Titans

- Avg. annual change in ticket price, 2021-2023: +1.1%
- Avg. ticket price by year: $143 in 2021; $197 in 2022; $127 in 2023
- Avg. home game attendance by year: 68,566 in 2021; 68,616 in 2022; 64,520 in 2023
- Reg. season win pct. by year: 70.6% in 2021; 41.2% in 2022; 35.3% in 2023
- Most recent championship win: Never
24. Tampa Bay Buccaneers
- Avg. annual change in ticket price, 2021-2023: +4.7%
- Avg. ticket price by year: $195 in 2021; $311 in 2022; $155 in 2023
- Avg. home game attendance by year: 65,372 in 2021; 68,988 in 2022; 63,756 in 2023
- Reg. season win pct. by year: 76.5% in 2021; 47.1% in 2022; 52.9% in 2023
- Most recent championship win: 2021
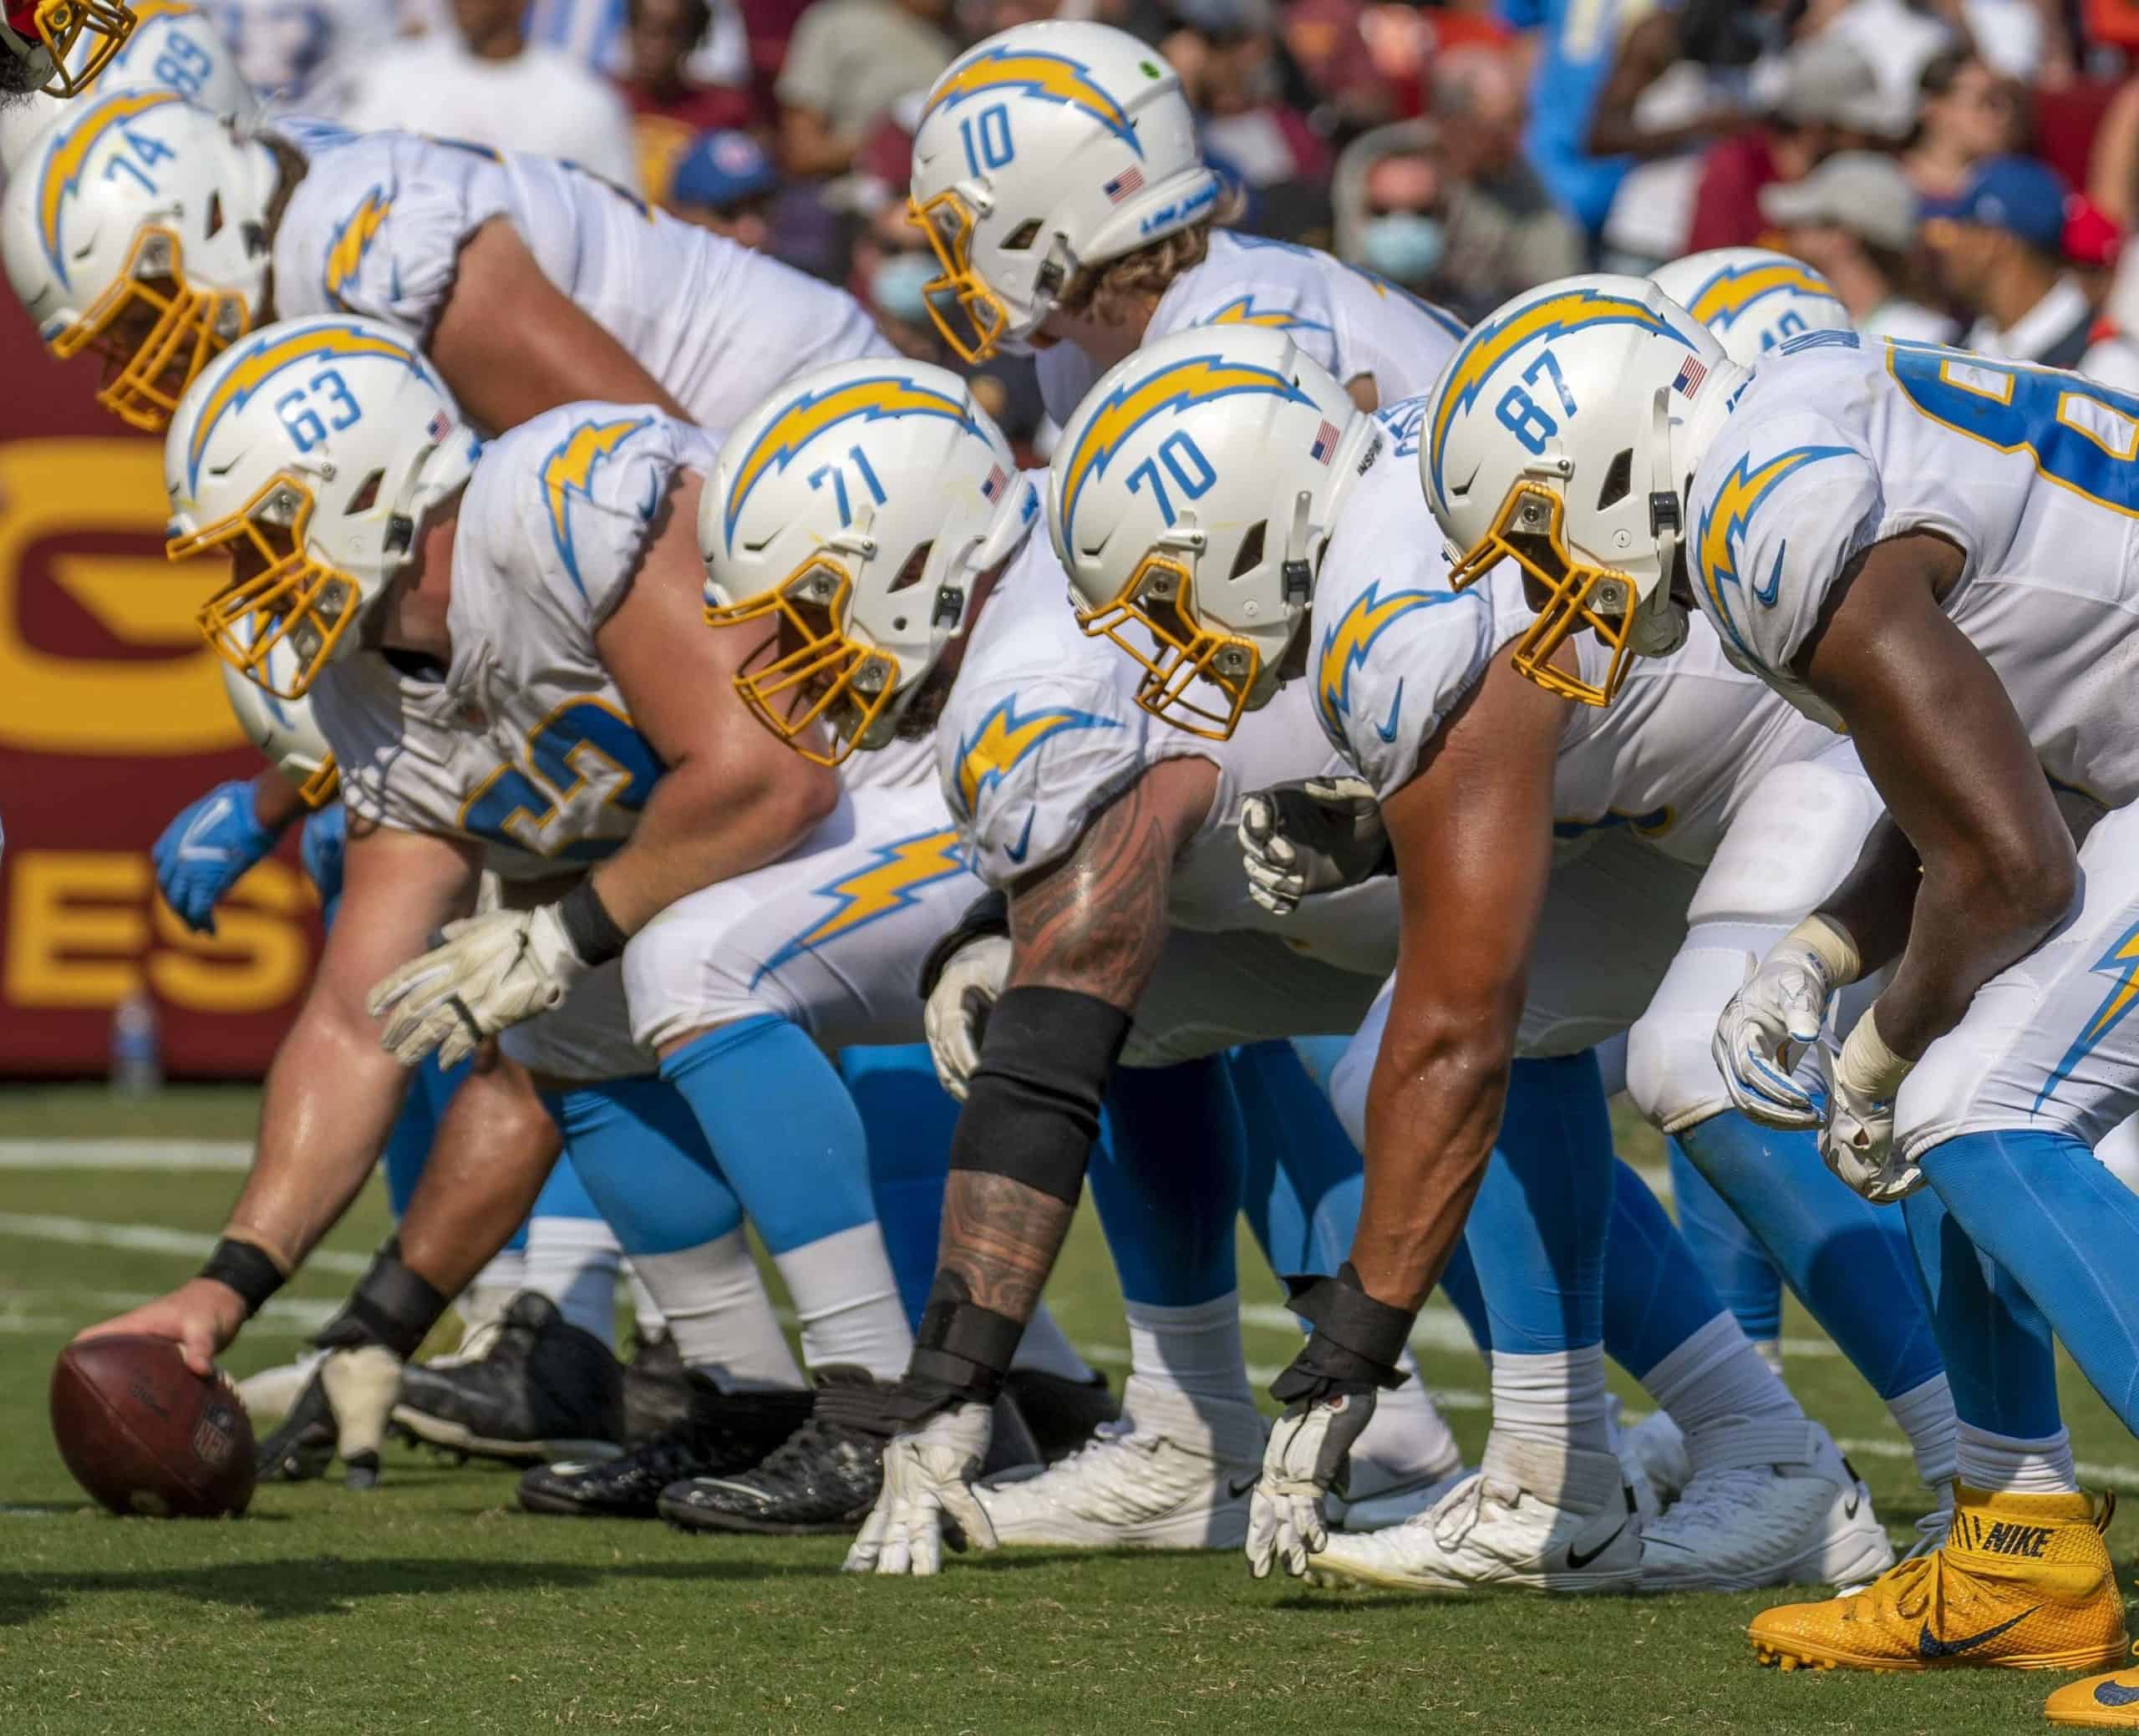
23. Los Angeles Chargers
- Avg. annual change in ticket price, 2021-2023: +4.9%
- Avg. ticket price by year: $150 in 2021; $170 in 2022; $164 in 2023
- Avg. home game attendance by year: 70,240 in 2021; 69,955 in 2022; 69,736 in 2023
- Reg. season win pct. by year: 52.9% in 2021; 58.8% in 2022; 29.4% in 2023
- Most recent championship win: Never
22. Los Angeles Rams
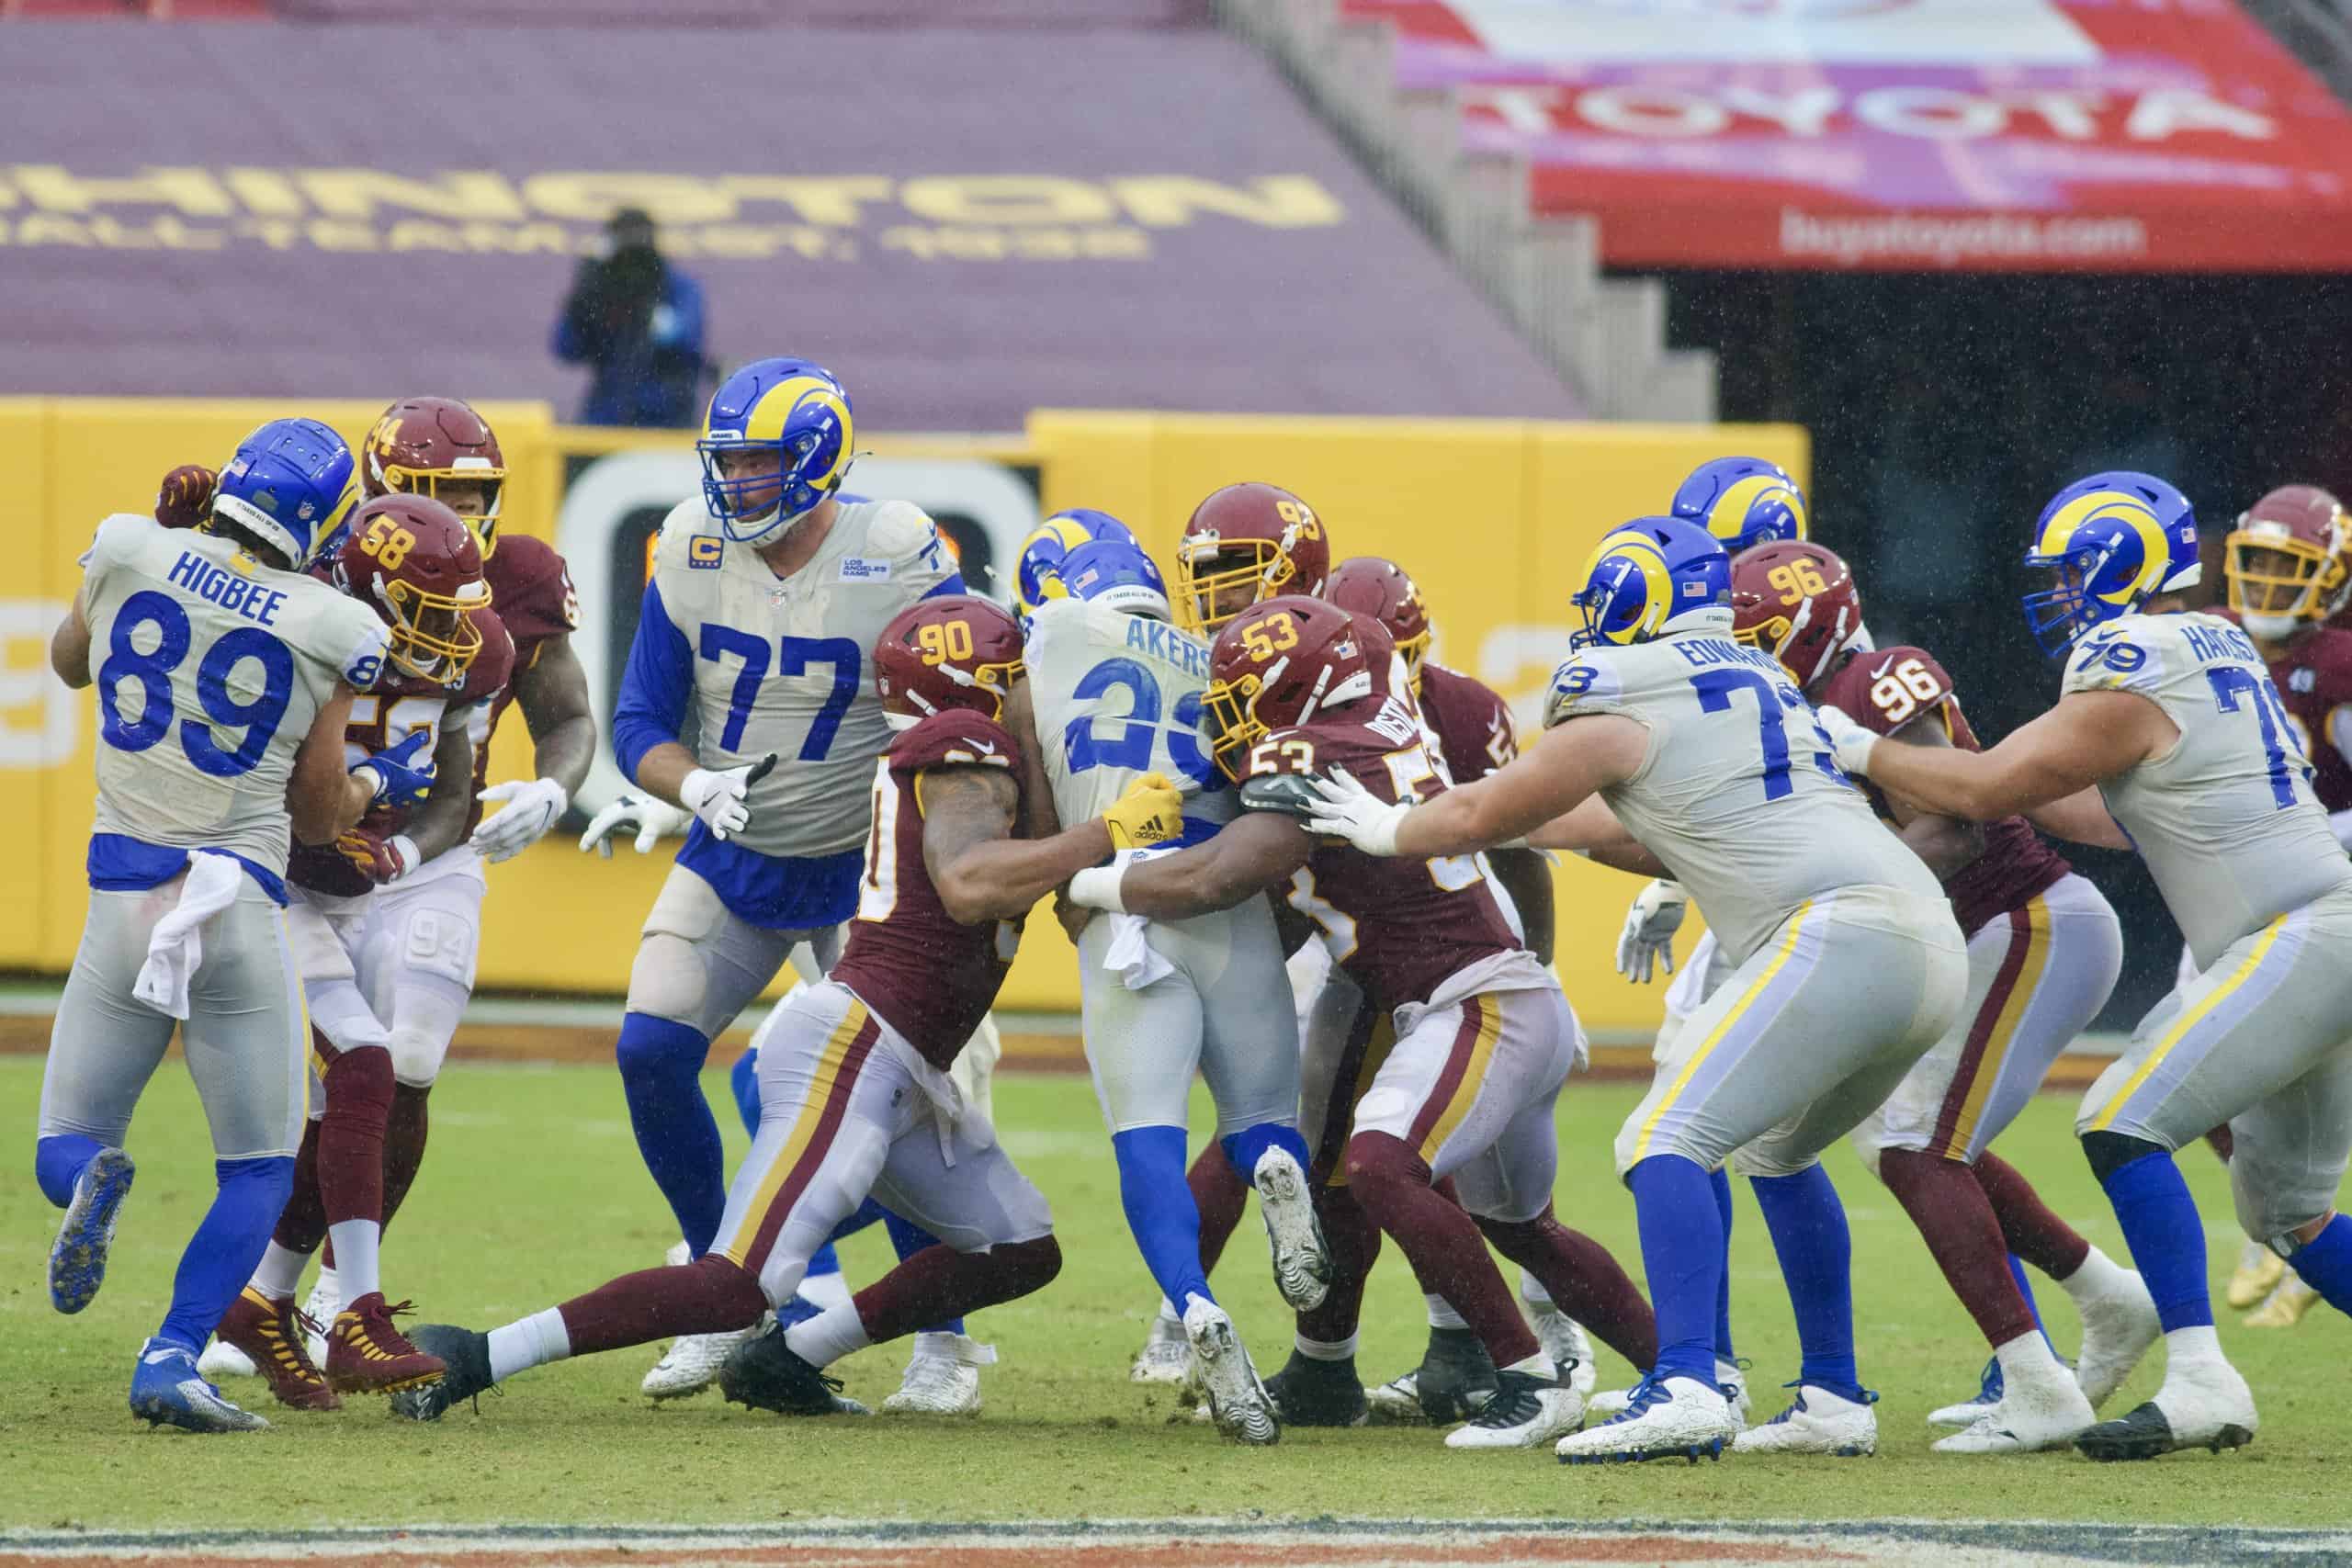
- Avg. annual change in ticket price, 2021-2023: +9.9%
- Avg. ticket price by year: $170 in 2021; $227 in 2022; $196 in 2023
- Avg. home game attendance by year: 71,598 in 2021; 72,734 in 2022; 73,150 in 2023
- Reg. season win pct. by year: 70.6% in 2021; 29.4% in 2022; 58.8% in 2023
- Most recent championship win: 2022
21. Cincinnati Bengals

- Avg. annual change in ticket price, 2021-2023: +11.7%
- Avg. ticket price by year: $157 in 2021; $196 in 2022; $193 in 2023
- Avg. home game attendance by year: 60,325 in 2021; 66,247 in 2022; 66,040 in 2023
- Reg. season win pct. by year: 58.8% in 2021; 75.0% in 2022; 52.9% in 2023
- Most recent championship win: Never
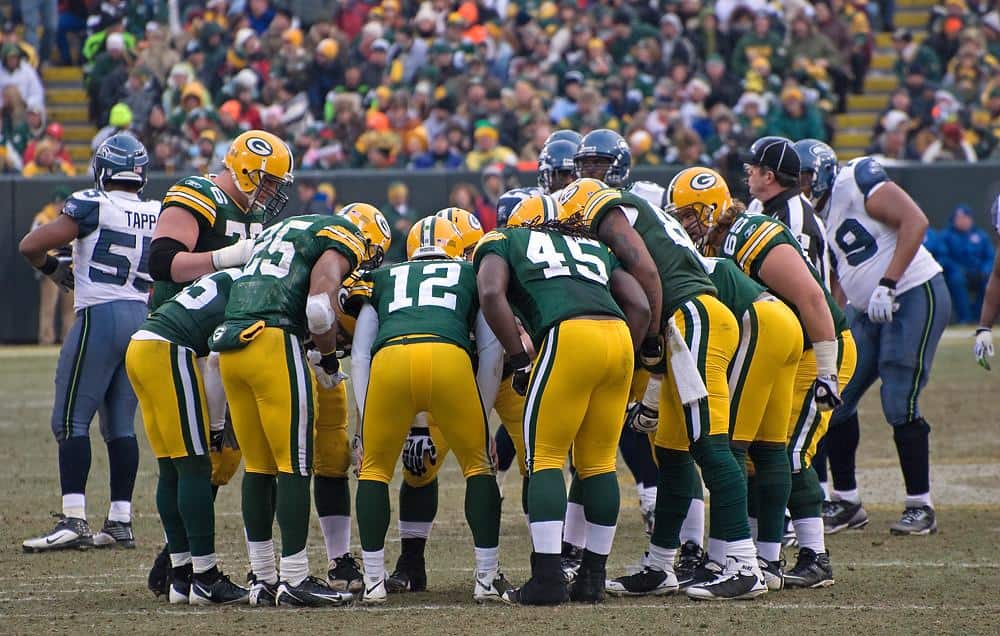
20. Green Bay Packers
- Avg. annual change in ticket price, 2021-2023: +17.5%
- Avg. ticket price by year: $180 in 2021; $282 in 2022; $221 in 2023
- Avg. home game attendance by year: 77,991 in 2021; 76,180 in 2022; 77,829 in 2023
- Reg. season win pct. by year: 76.5% in 2021; 47.1% in 2022; 52.9% in 2023
- Most recent championship win: 2011
19. Baltimore Ravens

- Avg. annual change in ticket price, 2021-2023: +18.1%
- Avg. ticket price by year: $118 in 2021; $167 in 2022; $158 in 2023
- Avg. home game attendance by year: 70,537 in 2021; 70,589 in 2022; 70,597 in 2023
- Reg. season win pct. by year: 47.1% in 2021; 58.8% in 2022; 76.5% in 2023
- Most recent championship win: 2013
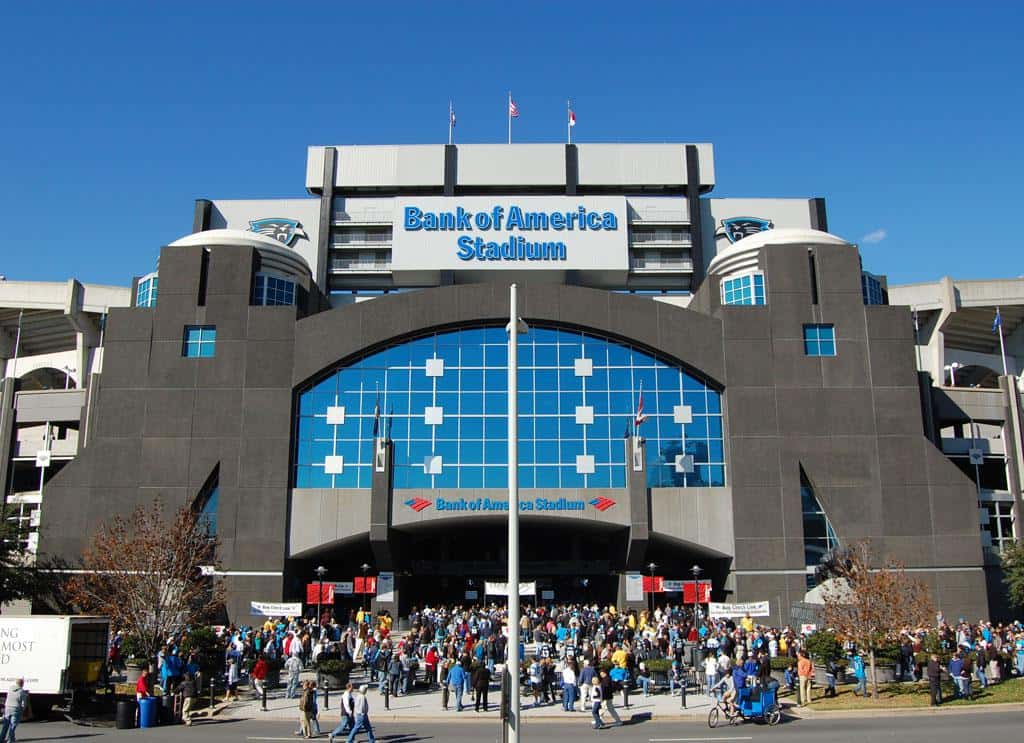
18. Carolina Panthers
- Avg. annual change in ticket price, 2021-2023: +22.9%
- Avg. ticket price by year: $98 in 2021; $156 in 2022; $135 in 2023
- Avg. home game attendance by year: 71,906 in 2021; 71,351 in 2022; 71,635 in 2023
- Reg. season win pct. by year: 29.4% in 2021; 41.2% in 2022; 11.8% in 2023
- Most recent championship win: Never
17. Chicago Bears
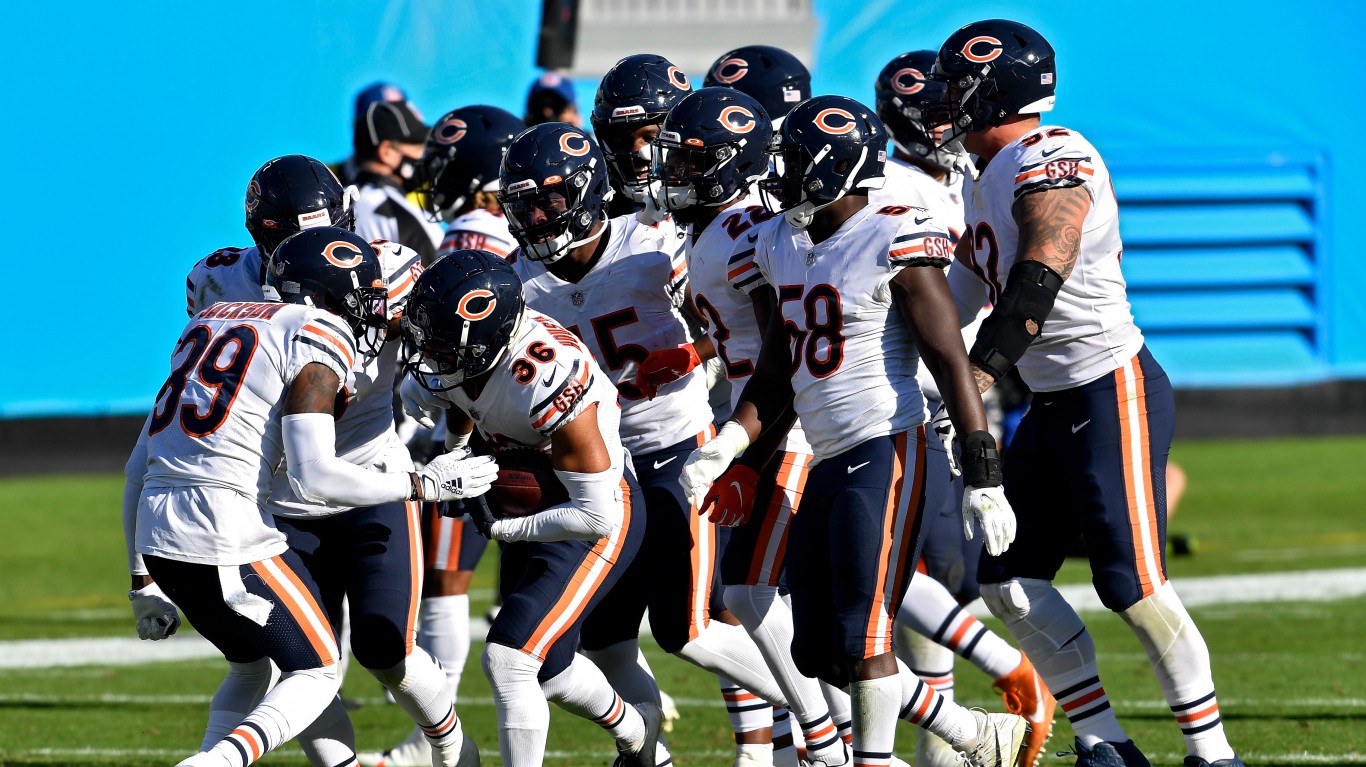
- Avg. annual change in ticket price, 2021-2023: +30.3%
- Avg. ticket price by year: $134 in 2021; $234 in 2022; $201 in 2023
- Avg. home game attendance by year: 60,834 in 2021; 59,823 in 2022; 61,769 in 2023
- Reg. season win pct. by year: 35.3% in 2021; 17.6% in 2022; 41.2% in 2023
- Most recent championship win: 1986
16. San Francisco 49ers

- Avg. annual change in ticket price, 2021-2023: +31.5%
- Avg. ticket price by year: $173 in 2021; $228 in 2022; $299 in 2023
- Avg. home game attendance by year: 66,670 in 2021; 71,629 in 2022; 71,655 in 2023
- Reg. season win pct. by year: 58.8% in 2021; 76.5% in 2022; 70.6% in 2023
- Most recent championship win: 1995
15. Dallas Cowboys

- Avg. annual change in ticket price, 2021-2023: +37.8%
- Avg. ticket price by year: $107 in 2021; $175 in 2022; $196 in 2023
- Avg. home game attendance by year: 93,421 in 2021; 93,465 in 2022; 93,594 in 2023
- Reg. season win pct. by year: 70.6% in 2021; 70.6% in 2022; 70.6% in 2023
- Most recent championship win: 1996
14. Kansas City Chiefs

- Avg. annual change in ticket price, 2021-2023: +38.0%
- Avg. ticket price by year: $196 in 2021; $250 in 2022; $371 in 2023
- Avg. home game attendance by year: 73,227 in 2021; 73,499 in 2022; 70,968 in 2023
- Reg. season win pct. by year: 70.6% in 2021; 82.4% in 2022; 64.7% in 2023
- Most recent championship win: 2024
13. New Orleans Saints

- Avg. annual change in ticket price, 2021-2023: +49.9%
- Avg. ticket price by year: $69 in 2021; $164 in 2022; $102 in 2023
- Avg. home game attendance by year: 64,929 in 2021; 68,987 in 2022; 70,020 in 2023
- Reg. season win pct. by year: 52.9% in 2021; 41.2% in 2022; 52.9% in 2023
- Most recent championship win: 2010
12. New York Giants
- Avg. annual change in ticket price, 2021-2023: +54.8%
- Avg. ticket price by year: $83 in 2021; $167 in 2022; $181 in 2023
- Avg. home game attendance by year: 73,882 in 2021; 76,474 in 2022; 79,307 in 2023
- Reg. season win pct. by year: 23.5% in 2021; 55.9% in 2022; 35.3% in 2023
- Most recent championship win: 2012
11. Denver Broncos
- Avg. annual change in ticket price, 2021-2023: +55.1%
- Avg. ticket price by year: $104 in 2021; $235 in 2022; $198 in 2023
- Avg. home game attendance by year: 76,236 in 2021; 75,980 in 2022; 76,388 in 2023
- Reg. season win pct. by year: 41.2% in 2021; 29.4% in 2022; 47.1% in 2023
- Most recent championship win: 2016
10. Atlanta Falcons

- Avg. annual change in ticket price, 2021-2023: +55.9%
- Avg. ticket price by year: $60 in 2021; $138 in 2022; $113 in 2023
- Avg. home game attendance by year: 67,586 in 2021; 69,583 in 2022; 69,603 in 2023
- Reg. season win pct. by year: 41.2% in 2021; 41.2% in 2022; 41.2% in 2023
- Most recent championship win: Never
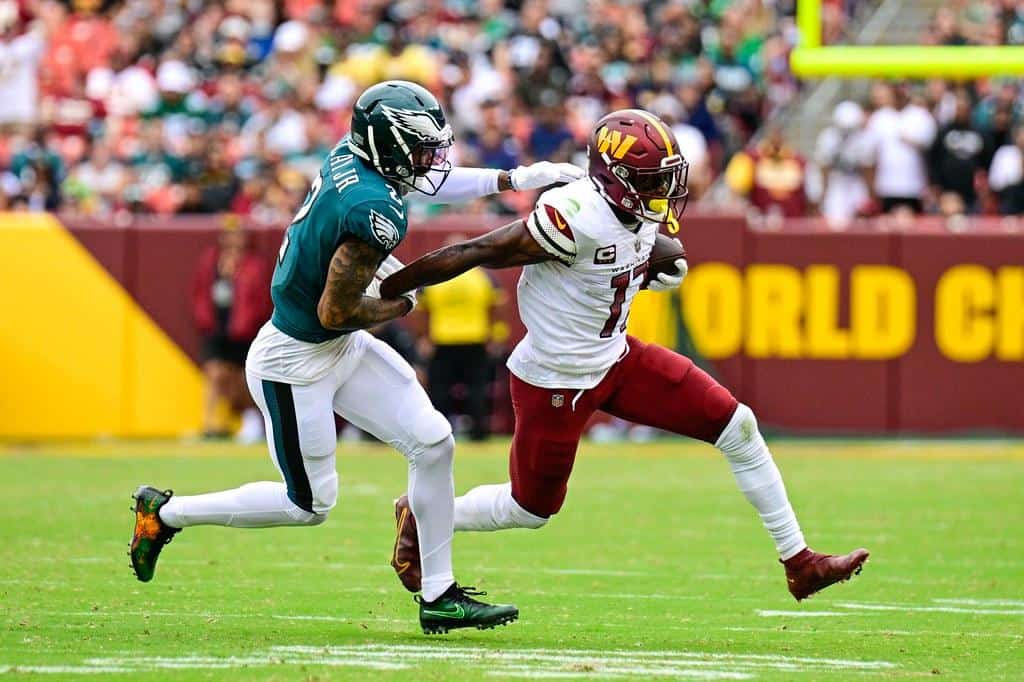
9. Washington Commanders
- Avg. annual change in ticket price, 2021-2023: +57.2%
- Avg. ticket price by year: $70 in 2021; $132 in 2022; $166 in 2023
- Avg. home game attendance by year: 52,751 in 2021; 58,106 in 2022; 63,950 in 2023
- Reg. season win pct. by year: 41.2% in 2021; 50.0% in 2022; 23.5% in 2023
- Most recent championship win: 1992
8. Minnesota Vikings
- Avg. annual change in ticket price, 2021-2023: +64.2%
- Avg. ticket price by year: $82 in 2021; $178 in 2022; $198 in 2023
- Avg. home game attendance by year: 66,701 in 2021; 66,687 in 2022; 66,913 in 2023
- Reg. season win pct. by year: 47.1% in 2021; 76.5% in 2022; 41.2% in 2023
- Most recent championship win: Never
7. Seattle Seahawks

- Avg. annual change in ticket price, 2021-2023: +90.2%
- Avg. ticket price by year: $79 in 2021; $209 in 2022; $242 in 2023
- Avg. home game attendance by year: 68,408 in 2021; 68,832 in 2022; 68,735 in 2023
- Reg. season win pct. by year: 41.2% in 2021; 52.9% in 2022; 52.9% in 2023
- Most recent championship win: 2014
6. Philadelphia Eagles

- Avg. annual change in ticket price, 2021-2023: +101.2%
- Avg. ticket price by year: $110 in 2021; $287 in 2022; $406 in 2023
- Avg. home game attendance by year: 69,796 in 2021; 69,869 in 2022; 69,878 in 2023
- Reg. season win pct. by year: 52.9% in 2021; 82.4% in 2022; 64.7% in 2023
- Most recent championship win: 2018
5. Buffalo Bills

- Avg. annual change in ticket price, 2021-2023: +106.8%
- Avg. ticket price by year: $65 in 2021; $186 in 2022; $237 in 2023
- Avg. home game attendance by year: 67,816 in 2021; 68,431 in 2022; 69,609 in 2023
- Reg. season win pct. by year: 64.7% in 2021; 81.3% in 2022; 64.7% in 2023
- Most recent championship win: Never
4. New York Jets
- Avg. annual change in ticket price, 2021-2023: +119.9%
- Avg. ticket price by year: $41 in 2021; $121 in 2022; $175 in 2023
- Avg. home game attendance by year: 71,676 in 2021; 78,009 in 2022; 77,890 in 2023
- Reg. season win pct. by year: 23.5% in 2021; 41.2% in 2022; 41.2% in 2023
- Most recent championship win: 1969
3. Detroit Lions
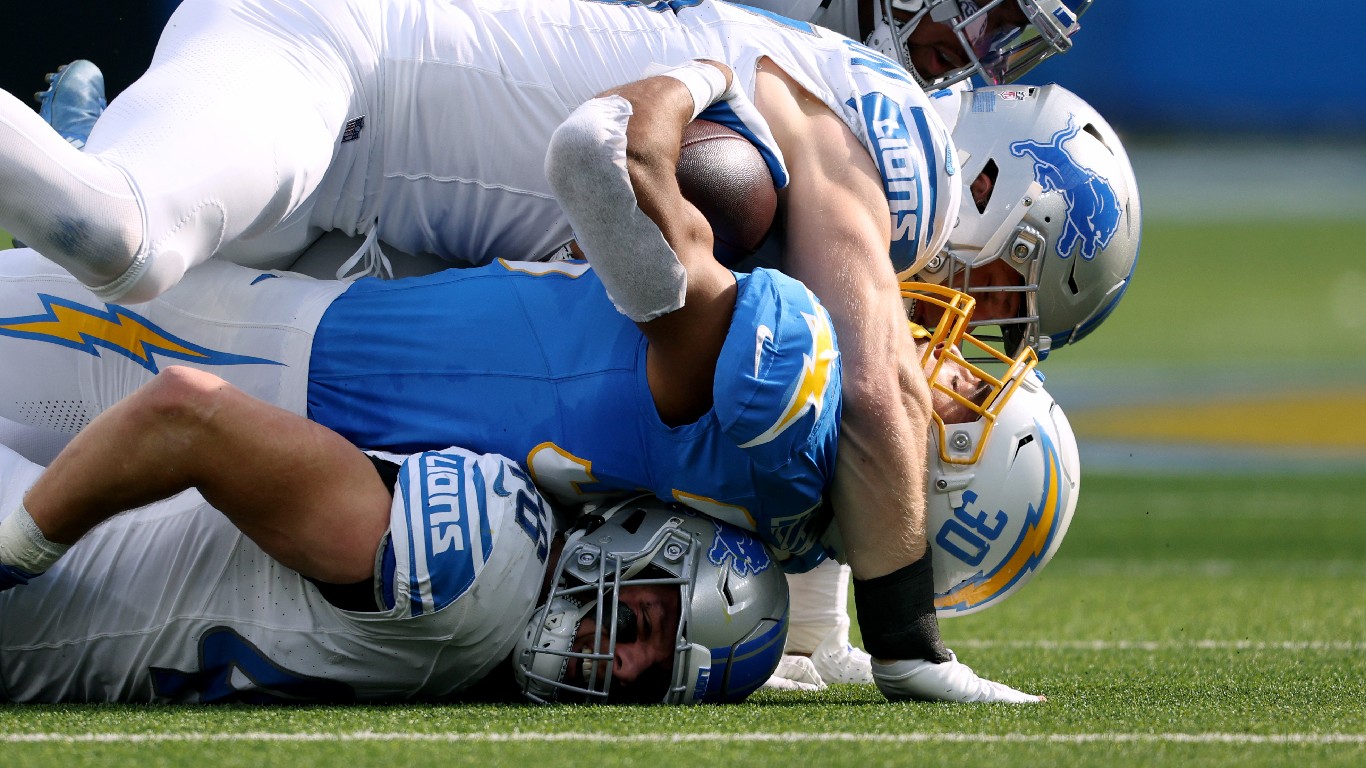
- Avg. annual change in ticket price, 2021-2023: +121.5%
- Avg. ticket price by year: $54 in 2021; $145 in 2022; $253 in 2023
- Avg. home game attendance by year: 51,522 in 2021; 63,423 in 2022; 64,850 in 2023
- Reg. season win pct. by year: 20.6% in 2021; 52.9% in 2022; 70.6% in 2023
- Most recent championship win: Never
2. Jacksonville Jaguars

- Avg. annual change in ticket price, 2021-2023: +150.3%
- Avg. ticket price by year: $36 in 2021; $144 in 2022; $145 in 2023
- Avg. home game attendance by year: 59,968 in 2021; 66,459 in 2022; 69,031 in 2023
- Reg. season win pct. by year: 17.6% in 2021; 52.9% in 2022; 52.9% in 2023
- Most recent championship win: Never
1. Houston Texans
- Avg. annual change in ticket price, 2021-2023: +194.5%
- Avg. ticket price by year: $22 in 2021; $104 in 2022; $121 in 2023
- Avg. home game attendance by year: 66,811 in 2021; 67,911 in 2022; 71,193 in 2023
- Reg. season win pct. by year: 23.5% in 2021; 20.6% in 2022; 58.8% in 2023
- Most recent championship win: Never
The Average American Has No Idea How Much Money You Can Make Today (Sponsor)
The last few years made people forget how much banks and CD’s can pay. Meanwhile, interest rates have spiked and many can afford to pay you much more, but most are keeping yields low and hoping you won’t notice.
But there is good news. To win qualified customers, some accounts are paying almost 10x the national average! That’s an incredible way to keep your money safe and earn more at the same time. Our top pick for high yield savings accounts includes other benefits as well. You can earn up to 3.80% with a Checking & Savings Account today Sign up and get up to $300 with direct deposit. No account fees. FDIC Insured.
Click here to see how much more you could be earning on your savings today. It takes just a few minutes to open an account to make your money work for you.
Our top pick for high yield savings accounts includes other benefits as well. You can earn up to 4.00% with a Checking & Savings Account from Sofi. Sign up and get up to $300 with direct deposit. No account fees. FDIC Insured.
Thank you for reading! Have some feedback for us?
Contact the 24/7 Wall St. editorial team.


