Special Report
Here Is How Much People Pay in Property Taxes in Tennessee
Published:
Last Updated:
Property tax regularly ranks among the least popular forms of taxation in the United States. Though property taxes are generally set by local authorities such as cities, counties, and school boards, states often establish parameters in order to keep tax rates somewhat uniform. Each state, however, has different parameters, and as a result, what homeowners end up paying out of pocket can vary considerably from state to state.
In some parts of the country, property taxes are so low as to be almost trivial. In others, however, they can be a major financial burden.
Using data from tax policy research organization the Tax Foundation, 24/7 Wall St. reviewed total annual property tax collections as a share of the total value of owner-occupied housing units at the state level to identify the states with the highest (and lowest) property taxes.
It is important to note that a low property tax rate does not necessarily mean a low overall tax burden. State and local governments need to meet their financial obligations one way or another, and a low effective property tax rate can often mean that other tax rates, like sales or income taxes, might be higher.
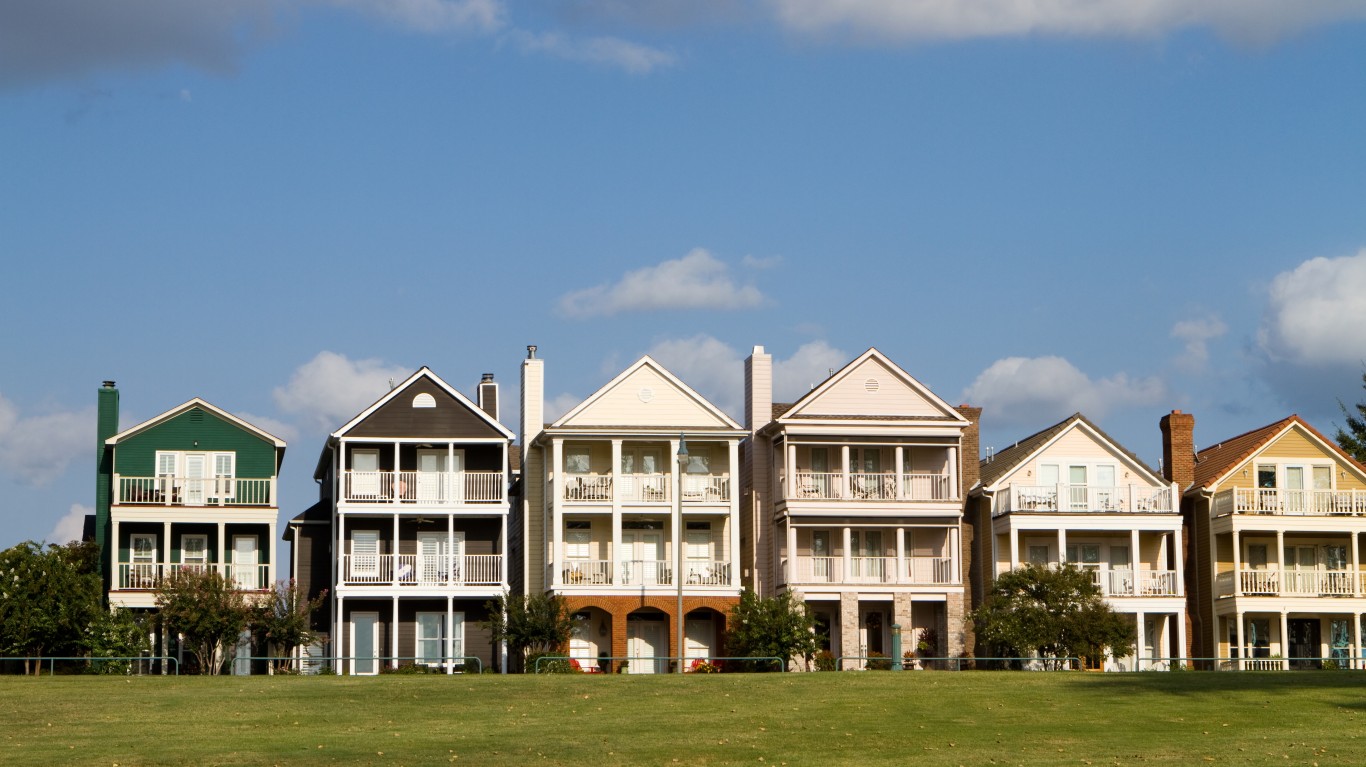
In Tennessee in 2018, $2.7 billion were paid in state and local real estate taxes, equal to 0.63% of the state’s aggregate home value of $434.2 billion. That effective property tax rate ranks 15th lowest among states and is lower than the national effective property tax rate of 1%. On a per capita basis, Tennessee residents paid $793 in state and local property taxes, fourth lowest among states and lower than the national per capita property taxes paid of $1,667.
Not all residents in the state pay property taxes. An estimated 66.5% of homes in the state are owner-occupied, the 24th highest homeownership rate among states and higher than the national rate of 64.1%. The typical Tennessee home value is $191,900, the 18th lowest of any state. In comparison the U.S. median home value is $240,500.
To determine the states with the highest and lowest property taxes, 24/7 Wall St. calculated the effective property tax rate — the total amount of property taxes paid annually as a percentage of the total value of all occupied homes — for all 50 states using data from the U.S. Census Bureau’s 2019 American Community Survey. Data on median home value, median household income, and population also came from the 2019 ACS. Data on state and local property tax revenue used to calculate per capita property taxes came from the Census Bureau’s 2018 Annual Survey of State and Local Government Finances and were adjusted for the adult population using the total number of residents 18 years and up.
| State | Real estate taxes paid (2018) | Rank | Total home value (2018) | Rank | Effective property tax rate (2018) | Rank | State and local property taxes paid per capita (2018) | Rank |
|---|---|---|---|---|---|---|---|---|
| Alaska | $471 million | 47 | $48.2 billion | 50 | 1.00% | 21 | $2,206 | 10 |
| Alabama | $931 million | 37 | $249.6 billion | 27 | 0.40% | 49 | $596 | 50 |
| Arizona | $3.2 billion | 22 | $534.5 billion | 17 | 0.60% | 39 | $1,106 | 34 |
| Arkansas | $797 million | 41 | $129.8 billion | 37 | 0.60% | 38 | $774 | 48 |
| California | $36.8 billion | 1 | $5.3 trillion | 1 | 0.70% | 34 | $1,678 | 18 |
| Colorado | $3.5 billion | 20 | $677.3 billion | 11 | 0.50% | 46 | $1,597 | 24 |
| Connecticut | $5.9 billion | 13 | $341.5 billion | 23 | 1.70% | 5 | $3,112 | 3 |
| Delaware | $473 million | 46 | $80.6 billion | 45 | 0.60% | 41 | $923 | 43 |
| Florida | $13.9 billion | 6 | $1.6 trillion | 3 | 0.90% | 26 | $1,363 | 29 |
| Georgia | $5.6 billion | 16 | $638.4 billion | 13 | 0.90% | 25 | $1,193 | 33 |
| Hawaii | $642 million | 44 | $209.9 billion | 31 | 0.30% | 50 | $1,362 | 30 |
| Idaho | $927 million | 38 | $143. billion | 36 | 0.60% | 35 | $1,001 | 40 |
| Illinois | $16.7 billion | 5 | $846.2 billion | 7 | 2.00% | 2 | $2,286 | 8 |
| Indiana | $2.8 billion | 23 | $342.6 billion | 22 | 0.80% | 30 | $1,028 | 38 |
| Iowa | $2.5 billion | 25 | $177. billion | 33 | 1.40% | 10 | $1,698 | 14 |
| Kansas | $2.0 billion | 27 | $152. billion | 34 | 1.30% | 15 | $1,604 | 23 |
| Kentucky | $1.7 billion | 29 | $219.8 billion | 30 | 0.80% | 31 | $844 | 45 |
| Louisiana | $1.3 billion | 34 | $246.6 billion | 28 | 0.50% | 48 | $896 | 44 |
| Maine | $1.2 billion | 35 | $101.3 billion | 41 | 1.20% | 16 | $2,241 | 9 |
| Maryland | $5.8 billion | 14 | $575.7 billion | 16 | 1.00% | 20 | $1,691 | 17 |
| Massachusetts | $9.1 billion | 9 | $834.6 billion | 9 | 1.10% | 18 | $2,562 | 6 |
| Michigan | $7.8 billion | 10 | $594.9 billion | 15 | 1.30% | 13 | $1,464 | 28 |
| Minnesota | $4.7 billion | 18 | $450.2 billion | 18 | 1.10% | 19 | $1,639 | 21 |
| Mississippi | $769 million | 42 | $122.7 billion | 38 | 0.60% | 37 | $1,063 | 36 |
| Missouri | $3.3 billion | 21 | $341.2 billion | 24 | 1.00% | 22 | $1,070 | 35 |
| Montana | $666 million | 43 | $90.3 billion | 42 | 0.70% | 33 | $1,698 | 15 |
| Nebraska | $1.6 billion | 30 | $105.4 billion | 40 | 1.50% | 7 | $2,001 | 12 |
| Nevada | $1.4 billion | 33 | $242.1 billion | 29 | 0.60% | 42 | $1,026 | 39 |
| New Hampshire | $2.2 billion | 26 | $118.6 billion | 39 | 1.90% | 3 | $3,347 | 2 |
| New Jersey | $18.1 billion | 4 | $848.5 billion | 6 | 2.10% | 1 | $3,379 | 1 |
| New Mexico | $854 million | 40 | $143.9 billion | 35 | 0.60% | 40 | $831 | 46 |
| New York | $25.5 billion | 2 | $2.0 trillion | 2 | 1.30% | 14 | $3,037 | 4 |
| North Carolina | $5.0 billion | 17 | $639.2 billion | 12 | 0.80% | 32 | $983 | 41 |
| North Dakota | $431 million | 49 | $48.9 billion | 49 | 0.90% | 24 | $1,640 | 20 |
| Ohio | $9.1 billion | 8 | $598.2 billion | 14 | 1.50% | 9 | $1,355 | 31 |
| Oklahoma | $1.5 billion | 31 | $183.2 billion | 32 | 0.80% | 29 | $767 | 49 |
| Oregon | $3.7 billion | 19 | $406.9 billion | 20 | 0.90% | 23 | $1,544 | 27 |
| Pennsylvania | $11.9 billion | 7 | $835. billion | 8 | 1.40% | 11 | $1,584 | 25 |
| Rhode Island | $1.2 billion | 36 | $85.2 billion | 43 | 1.40% | 12 | $2,429 | 7 |
| South Carolina | $1.7 billion | 28 | $329.6 billion | 25 | 0.50% | 44 | $1,196 | 32 |
| South Dakota | $573 million | 45 | $50.4 billion | 47 | 1.10% | 17 | $1,575 | 26 |
| Tennessee | $2.7 billion | 24 | $434.2 billion | 19 | 0.60% | 36 | $793 | 47 |
| Texas | $25.3 billion | 3 | $1,582.7 billion | 4 | 1.60% | 6 | $1,948 | 13 |
| Utah | $1.5 billion | 32 | $270.5 billion | 26 | 0.60% | 43 | $1,052 | 37 |
| Vermont | $864 million | 39 | $49.2 billion | 48 | 1.80% | 4 | $2,740 | 5 |
| Virginia | $6.4 billion | 12 | $767.5 billion | 10 | 0.80% | 28 | $1,693 | 16 |
| Washington | $7.4 billion | 11 | $886.2 billion | 5 | 0.80% | 27 | $1,626 | 22 |
| West Virginia | $435 million | 48 | $82. billion | 44 | 0.50% | 45 | $956 | 42 |
| Wisconsin | $5.7 billion | 15 | $375.5 billion | 21 | 1.50% | 8 | $1,676 | 19 |
| Wyoming | $261 million | 50 | $51.3 billion | 46 | 0.50% | 47 | $2,008 | 11 |
The Average American Is Losing Momentum on Their Savings Every Day (Sponsor)
If you’re like many Americans and keep your money ‘safe’ in a checking or savings account, think again. The average yield on a savings account is a paltry .4%* today. Checking accounts are even worse.
But there is good news. To win qualified customers, some accounts are paying nearly 10x the national average! That’s an incredible way to keep your money safe and earn more at the same time. Our top pick for high yield savings accounts includes other benefits as well. You can earn up to 3.80% with a Checking & Savings Account today Sign up and get up to $300 with direct deposit. No account fees. FDIC Insured.
Click here to see how much more you could be earning on your savings today. It takes just a few minutes to open an account to make your money work for you.
Thank you for reading! Have some feedback for us?
Contact the 24/7 Wall St. editorial team.