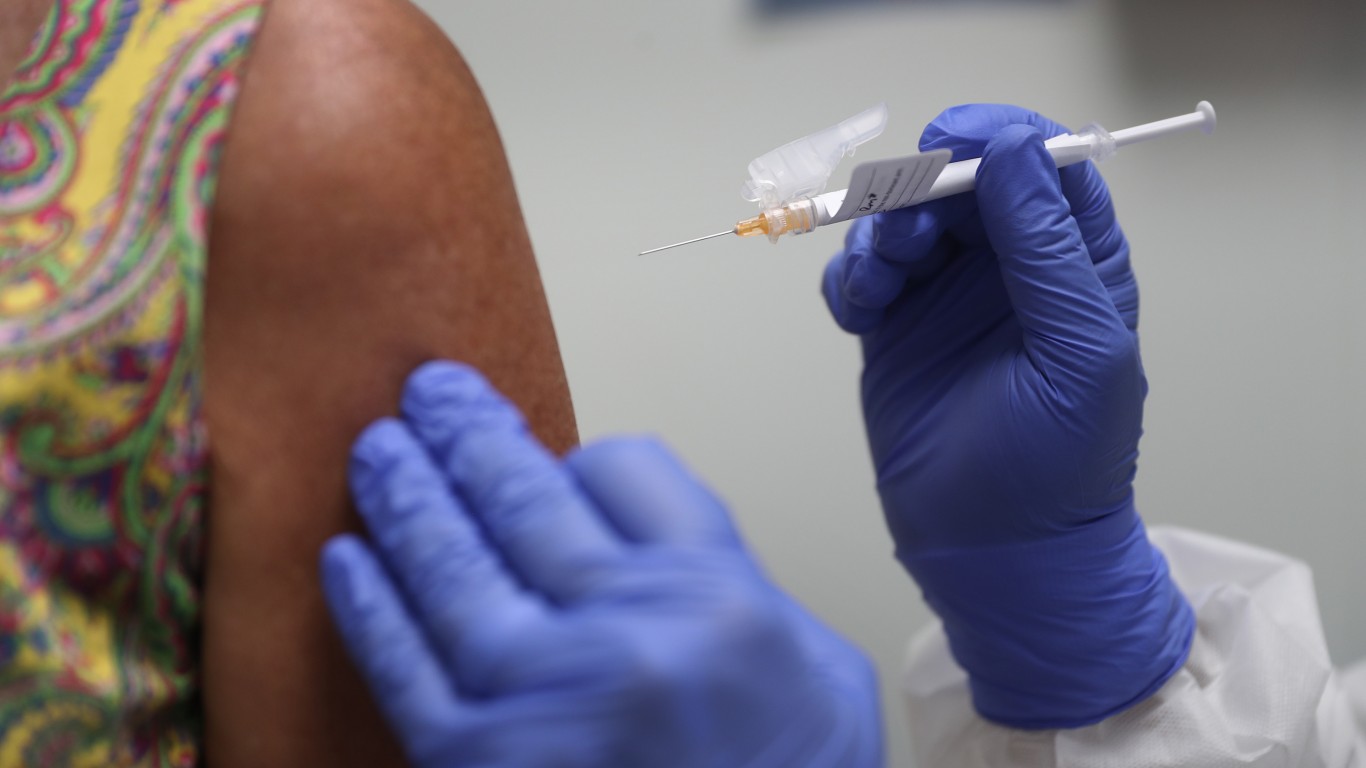
An estimated 222,682,315 Americans have been fully vaccinated against COVID-19, or 68.1% of the U.S. population.
Some states are proving more effective than others in getting their residents vaccinated. In Kansas, 62.7% of the population are fully vaccinated, lower than the U.S. average.
Lower than average vaccination rates in Kansas appear to be attributable in part to vaccine hesitancy and resistance among residents. As of July 18, Kansas has received about 6,545,100 vaccinations and administered about 71.8% of those doses.
Meanwhile, the virus continues to spread. In total, there have been 819,675 confirmed cases of the virus in Kansas as of July 18 — or 28,153 for every 100,000 people. For context, there have been 26,906 known infections for every 100,000 people nationwide.
All COVID-19 and vaccination data used in this story are current as of July 18, 2022.
These are all the counties in Kansas where COVID-19 is slowing (and where it’s still getting worse).
| Rank | Place | Share of pop. fully vaccinated | Fully vaccinated residents | Total COVID-19 cases per 100k people |
|---|---|---|---|---|
| 1 | Rhode Island | 84.1% | 889,412 | 36,522 |
| 2 | Vermont | 81.8% | 512,291 | 20,280 |
| 3 | Maine | 81.0% | 1,084,551 | 20,370 |
| 4 | Connecticut | 80.1% | 2,860,091 | 23,514 |
| 5 | Massachusetts | 80.0% | 5,524,061 | 28,056 |
| 6 | Washington D.C. | 79.0% | 540,890 | 23,301 |
| 7 | Hawaii | 79.0% | 1,122,122 | 21,793 |
| 8 | New York | 77.6% | 15,162,143 | 29,123 |
| 9 | Maryland | 76.6% | 4,630,717 | 19,114 |
| 10 | New Jersey | 76.4% | 6,802,022 | 28,409 |
| 11 | Virginia | 74.1% | 6,307,510 | 22,409 |
| 12 | Washington | 73.9% | 5,567,197 | 22,505 |
| 13 | California | 72.9% | 28,824,931 | 26,153 |
| 14 | New Mexico | 72.2% | 1,512,682 | 27,454 |
| 15 | New Hampshire | 71.9% | 975,450 | 24,685 |
| 16 | Colorado | 71.8% | 4,087,310 | 27,457 |
| 17 | Oregon | 70.8% | 2,966,806 | 19,807 |
| 18 | Delaware | 70.7% | 684,079 | 29,838 |
| 19 | Minnesota | 70.2% | 3,938,992 | 27,828 |
| 20 | Pennsylvania | 69.7% | 8,932,293 | 23,722 |
| 21 | Illinois | 68.8% | 8,762,881 | 27,361 |
| 22 | Florida | 68.3% | 14,549,762 | 31,120 |
| 23 | Wisconsin | 66.3% | 3,855,151 | 30,039 |
| 24 | Utah | 65.8% | 2,080,418 | 31,311 |
| 25 | Nebraska | 64.4% | 1,241,668 | 26,306 |
| 26 | Arizona | 63.5% | 4,552,363 | 30,133 |
| 27 | North Carolina | 63.3% | 6,576,141 | 28,162 |
| 28 | Texas | 63.1% | 18,103,722 | 25,226 |
| 29 | South Dakota | 62.9% | 555,362 | 28,028 |
| 30 | Kansas | 62.7% | 1,826,799 | 28,153 |
| 31 | Iowa | 62.5% | 1,972,517 | 25,532 |
| 32 | Nevada | 62.5% | 1,895,353 | 26,029 |
| 33 | Alaska | 62.3% | 459,677 | 36,166 |
| 34 | Michigan | 60.7% | 6,063,790 | 26,373 |
| 35 | Ohio | 58.9% | 6,885,058 | 24,529 |
| 36 | South Carolina | 58.5% | 2,974,902 | 30,951 |
| 37 | Oklahoma | 58.3% | 2,297,268 | 27,819 |
| 38 | Kentucky | 58.0% | 2,590,737 | 31,884 |
| 39 | Montana | 57.8% | 613,840 | 27,237 |
| 40 | West Virginia | 57.8% | 1,043,095 | 29,962 |
| 41 | Idaho | 57.0% | 999,610 | 26,819 |
| 42 | Missouri | 56.9% | 3,485,985 | 24,852 |
| 43 | Indiana | 56.8% | 3,803,600 | 26,818 |
| 44 | North Dakota | 56.3% | 428,006 | 33,287 |
| 45 | Georgia | 56.0% | 5,894,561 | 25,611 |
| 46 | Tennessee | 55.5% | 3,756,545 | 31,853 |
| 47 | Arkansas | 55.2% | 1,664,181 | 29,246 |
| 48 | Louisiana | 53.9% | 2,511,808 | 26,934 |
| 49 | Mississippi | 52.3% | 1,561,513 | 28,542 |
| 50 | Alabama | 51.9% | 2,534,488 | 28,391 |
| 51 | Wyoming | 51.6% | 297,846 | 28,973 |
Get Ready To Retire (Sponsored)
Start by taking a quick retirement quiz from SmartAsset that will match you with up to 3 financial advisors that serve your area and beyond in 5 minutes, or less.
Each advisor has been vetted by SmartAsset and is held to a fiduciary standard to act in your best interests.
Here’s how it works:
1. Answer SmartAsset advisor match quiz
2. Review your pre-screened matches at your leisure. Check out the advisors’ profiles.
3. Speak with advisors at no cost to you. Have an introductory call on the phone or introduction in person and choose whom to work with in the future
Thank you for reading! Have some feedback for us?
Contact the 24/7 Wall St. editorial team.