On June 18, 2024, Florida governor Ron DeSantis signed three separate health care bills, one of which allows Medicaid coverage for biomarker testing, a way of analyzing genes for potential disease. With affordable healthcare still on the minds of many Americans, the cost and quality of U.S. healthcare has been the subject of much debate in recent years. This is particularly true as election season ramps up. After a global pandemic, health-conscious Americans remain focused on ways to stay fit and live longer. In fact, in the search for the best counties to live in America, life expectancy is a key factor.
What any one person considers a county worth living in is obviously subjective. One citizen may look for a slow-paced lifestyle and affordability, while another individual may prioritize public transportation and job opportunities. Though people across the nation look for different factors, health does indeed tend to top the list.
In addition to health and safety, U.S. citizens looking for the best places to live in their state focus on several other points of interest. The big three factors laid out by the United Nations Development Program’s Human Development Index (HDI) are financial stability, educational attainment, and life expectancy. These are all strong indications of an area’s standard of living.
When compared to other countries, the United States ranks high on these factors, but is by no means first on the list. It sits in 21st place and is outranked by several European and Asian countries. Australia and Canada also overshadow America.
The staff of 24/7 Wall Street used the HDI to identify the best county to live in each state. The three measures chosen for rankings include life expectancy, the number of adults with bachelor’s degrees, and poverty rate. To calculate each state, we averaged a five-year period of information taken from the 2022 US Census Bureau’s American Community Survey and County Health Rankings & Roadmaps. This program was a collaboration between the Robert Wood Johnson Foundation and the University of Wisconsin Population Health Institute. We excluded any county that did not attain the necessary data.
Each state, no matter its overall ranking on issues like poverty, includes at least one county where residents are healthier, more financially secure, and better educated than the average U.S. citizens. These measures stand alone as individual data points. However, we cannot ignore the fact that they are correlated. For example, those with a college degree are less likely to live in poverty at any point in time than those without a degree. Likewise, educated and wealthy people tend to be healthier.
Most of these counties have a median income thousands of dollars higher than the state median. For reference, 12.5% of Americans live below the poverty line and 34.3% of adults have an educational minimum of a bachelor’s degree. Additionally, the average life expectancy is 78.5 nationally.
Why We Are Covering This

In post-pandemic years, Americans are moving out of large cities faster than during pre-pandemic years, according to a new census analysis by Goldman Sachs. This migration is due in part to the work-from-home trend spawned by Covid. As citizens leave the big city behind, they are tasked with finding a new place to live. When faced with such a decision, it is important to be able to assess which counties offer the best quality of life.
Alabama: Shelby County

- Avg. life expectancy at birth: 80.3 years (state: 74.8 years)
- Poverty rate: 6.9% (state: 15.7%)
- Adults with a bachelor’s degree: 45.6% (state: 27.2%)
- Median household income: $90,618 (state: $59,609)
- County seat: Columbiana
- Counties considered in state: 67
Alaska: Aleutians East Borough

- Avg. life expectancy at birth: 100+ years (state: 78.6 years)
- Poverty rate: 12.6% (state: 10.5%)
- Adults with a bachelor’s degree: 16.9% (state: 30.7%)
- Median household income: $79,961 (state: $86,370)
- County seat: Sand Point
- Counties considered in state: 24
Arizona: Maricopa County

- Avg. life expectancy at birth: 79.6 years (state: 79.1 years)
- Poverty rate: 11.5% (state: 13.1%)
- Adults with a bachelor’s degree: 35.0% (state: 31.8%)
- Median household income: $80,675 (state: $72,581)
- County seat: Phoenix
- Counties considered in state: 15
Arkansas: Benton County

- Avg. life expectancy at birth: 79.5 years (state: 75.5 years)
- Poverty rate: 7.9% (state: 16.2%)
- Adults with a bachelor’s degree: 35.5% (state: 24.7%)
- Median household income: $85,269 (state: $56,335)
- County seat: Bentonville
- Counties considered in state: 75
California: Marin County

- Avg. life expectancy at birth: 85.3 years (state: 81.0 years)
- Poverty rate: 7.0% (state: 12.1%)
- Adults with a bachelor’s degree: 61.1% (state: 35.9%)
- Median household income: $142,019 (state: $91,905)
- County seat: San Rafael
- Counties considered in state: 57
Colorado: Pitkin County

- Avg. life expectancy at birth: 92.5 years (state: 80.0 years)
- Poverty rate: 6.7% (state: 9.6%)
- Adults with a bachelor’s degree: 63.1% (state: 43.7%)
- Median household income: $96,123 (state: $87,598)
- County seat: Aspen
- Counties considered in state: 59
Connecticut: Fairfield County

- Avg. life expectancy at birth: 82.1 years (state: 80.1 years)
- Poverty rate: 9.2% (state: 10.1%)
- Adults with a bachelor’s degree: 49.2% (state: 41.4%)
- Median household income: $101,194 (state: $90,213)
- County seat: None
- County equivalents considered in state: 8
Delaware: New Castle County

- Avg. life expectancy at birth: 77.9 years (state: 78.0 years)
- Poverty rate: 10.5% (state: 11.1%)
- Adults with a bachelor’s degree: 38.3% (state: 34.5%)
- Median household income: $85,309 (state: $79,325)
- County seat: Wilmington
- Counties considered in state: 3
Florida: St. Johns County

- Avg. life expectancy at birth: 81.9 years (state: 79.7 years)
- Poverty rate: 6.8% (state: 12.9%)
- Adults with a bachelor’s degree: 47.4% (state: 32.3%)
- Median household income: $100,020 (state: $67,917)
- County seat: St. Augustine
- Counties considered in state: 67
Georgia: Forsyth County

- Avg. life expectancy at birth: 82.3 years (state: 77.3 years)
- Poverty rate: 4.6% (state: 13.5%)
- Adults with a bachelor’s degree: 56.2% (state: 33.6%)
- Median household income: $131,660 (state: $71,355)
- County seat: Cumming
- Counties considered in state: 158
Hawaii: Honolulu County

- Avg. life expectancy at birth: 82.4 years (state: 82.3 years)
- Poverty rate: 8.8% (state: 9.6%)
- Adults with a bachelor’s degree: 36.6% (state: 34.7%)
- Median household income: $99,816 (state: $94,814)
- County seat: Honolulu
- Counties considered in state: 4
Idaho: Blaine County

- Avg. life expectancy at birth: 85.3 years (state: 79.2 years)
- Poverty rate: 6.9% (state: 11.0%)
- Adults with a bachelor’s degree: 44.5% (state: 30.2%)
- Median household income: $81,794 (state: $70,214)
- County seat: Hailey
- Counties considered in state: 42
Illinois: DuPage County

- Avg. life expectancy at birth: 81.9 years (state: 78.6 years)
- Poverty rate: 6.3% (state: 11.8%)
- Adults with a bachelor’s degree: 51.1% (state: 36.7%)
- Median household income: $107,035 (state: $78,433)
- County seat: Wheaton
- Counties considered in state: 102
Indiana: Hamilton County

- Avg. life expectancy at birth: 81.6 years (state: 76.5 years)
- Poverty rate: 4.2% (state: 12.3%)
- Adults with a bachelor’s degree: 60.8% (state: 28.2%)
- Median household income: $114,866 (state: $67,173)
- County seat: Noblesville
- Counties considered in state: 92
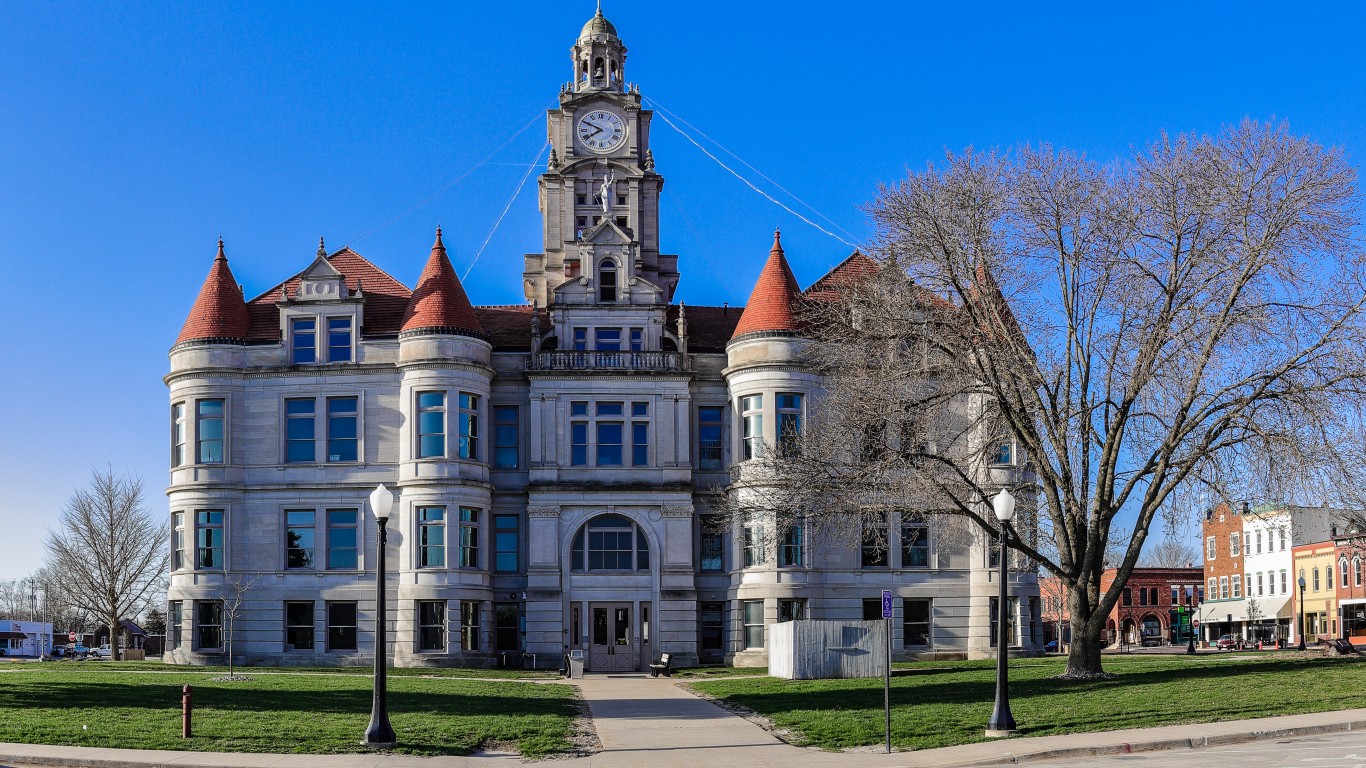
Iowa: Dallas County

- Avg. life expectancy at birth: 81.8 years (state: 78.7 years)
- Poverty rate: 5.7% (state: 11.1%)
- Adults with a bachelor’s degree: 51.5% (state: 30.3%)
- Median household income: $99,533 (state: $70,571)
- County seat: Adel
- Counties considered in state: 99
Kansas: Johnson County

- Avg. life expectancy at birth: 81.4 years (state: 77.8 years)
- Poverty rate: 5.3% (state: 11.6%)
- Adults with a bachelor’s degree: 56.7% (state: 34.7%)
- Median household income: $103,644 (state: $69,747)
- County seat: Olathe
- Counties considered in state: 102
Kentucky: Oldham County
- Avg. life expectancy at birth: 79.8 years (state: 75.1 years)
- Poverty rate: 4.0% (state: 16.1%)
- Adults with a bachelor’s degree: 45.4% (state: 26.5%)
- Median household income: $117,334 (state: $60,183)
- County seat: La Grange
- Counties considered in state: 120
Louisiana: St. Tammany Parish

- Avg. life expectancy at birth: 77.8 years (state: 75.2 years)
- Poverty rate: 11.7% (state: 18.7%)
- Adults with a bachelor’s degree: 36.4% (state: 26.1%)
- Median household income: $76,914 (state: $57,852)
- Parish seat: Covington
- Parishes considered in state: 64
Maine: Cumberland County

- Avg. life expectancy at birth: 80.2 years (state: 78.6 years)
- Poverty rate: 7.2% (state: 10.9%)
- Adults with a bachelor’s degree: 50.6% (state: 34.1%)
- Median household income: $87,710 (state: $68,251)
- County seat: Portland
- Counties considered in state: 16
Maryland: Howard County

- Avg. life expectancy at birth: 82.7 years (state: 78.6 years)
- Poverty rate: 5.4% (state: 9.3%)
- Adults with a bachelor’s degree: 64.0% (state: 42.2%)
- Median household income: $140,971 (state: $98,461)
- County seat: Ellicott City
- Counties considered in state: 24
Massachusetts: Nantucket County

- Avg. life expectancy at birth: 83.0 years (state: 80.2 years)
- Poverty rate: 4.9% (state: 9.9%)
- Adults with a bachelor’s degree: 57.4% (state: 45.9%)
- Median household income: $135,590 (state: $96,505)
- County seat: Nantucket
- Counties considered in state: 14
Michigan: Leelanau County

- Avg. life expectancy at birth: 82.3 years (state: 77.5 years)
- Poverty rate: 6.7% (state: 13.1%)
- Adults with a bachelor’s degree: 48.6% (state: 31.1%)
- Median household income: $82,345 (state: $68,505)
- County seat: Suttons Bay Township
- Counties considered in state: 83
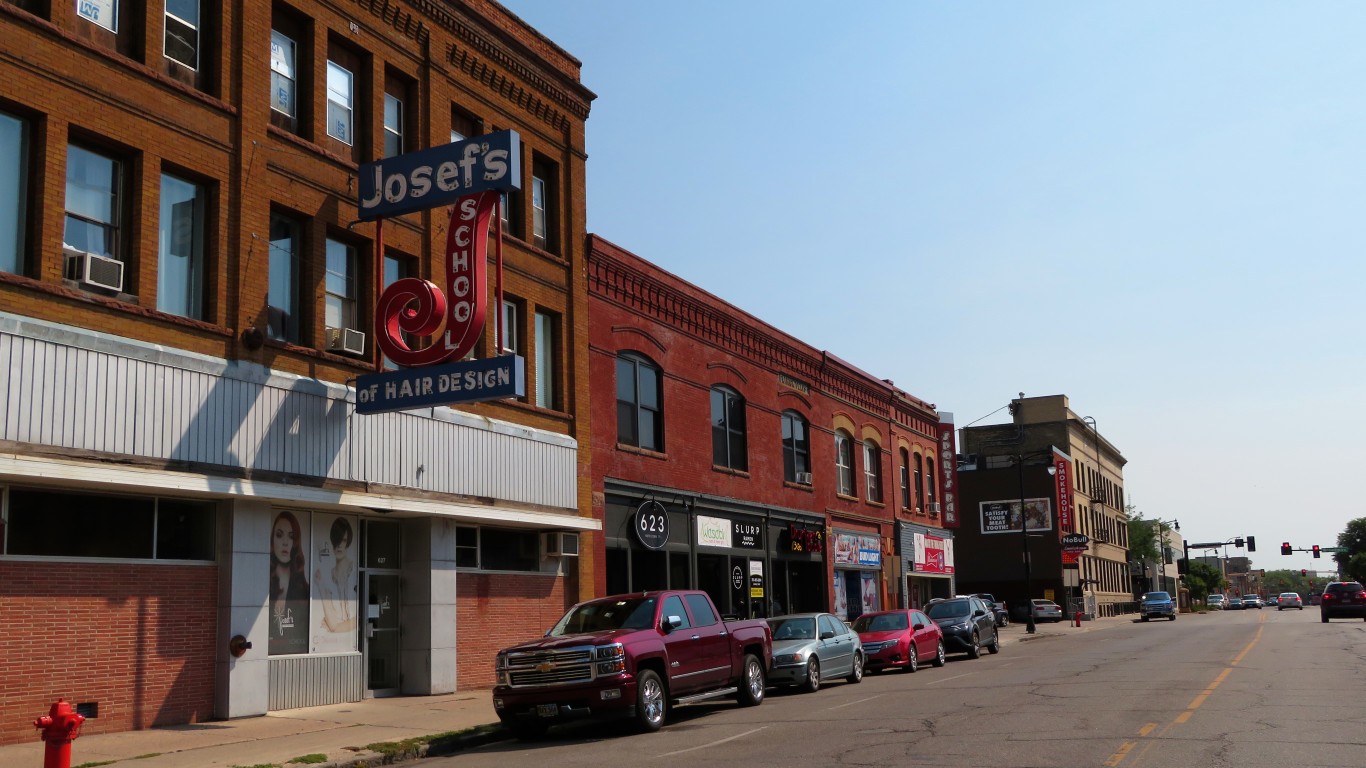
Minnesota: Carver County

- Avg. life expectancy at birth: 83.2 years (state: 80.4 years)
- Poverty rate: 3.8% (state: 9.3%)
- Adults with a bachelor’s degree: 49.8% (state: 38.2%)
- Median household income: $116,308 (state: $84,313)
- County seat: Chaska
- Counties considered in state: 87
Mississippi: Madison County

- Avg. life expectancy at birth: 76.1 years (state: 73.9 years)
- Poverty rate: 9.8% (state: 19.2%)
- Adults with a bachelor’s degree: 49.5% (state: 23.9%)
- Median household income: $79,105 (state: $52,985)
- County seat: Canton
- Counties considered in state: 81
Missouri: St. Charles County

- Avg. life expectancy at birth: 79.6 years (state: 76.6 years)
- Poverty rate: 4.5% (state: 12.8%)
- Adults with a bachelor’s degree: 42.0% (state: 31.2%)
- Median household income: $99,596 (state: $65,920)
- County seat: St. Charles
- Counties considered in state: 115
Montana: Gallatin County

- Avg. life expectancy at birth: 82.7 years (state: 78.4 years)
- Poverty rate: 10.6% (state: 12.4%)
- Adults with a bachelor’s degree: 52.9% (state: 34.0%)
- Median household income: $83,434 (state: $66,341)
- County seat: Bozeman
- Counties considered in state: 48
Nebraska: Sarpy County
- Avg. life expectancy at birth: 80.7 years (state: 79.0 years)
- Poverty rate: 5.5% (state: 10.4%)
- Adults with a bachelor’s degree: 41.2% (state: 33.5%)
- Median household income: $95,911 (state: $71,722)
- County seat: Papillion
- Counties considered in state: 79
Nevada: Storey County

- Avg. life expectancy at birth: 82.9 years (state: 78.1 years)
- Poverty rate: 9.1% (state: 12.7%)
- Adults with a bachelor’s degree: 31.4% (state: 26.5%)
- Median household income: $86,932 (state: $71,646)
- County seat: Virginia City
- Counties considered in state: 16
New Hampshire: Rockingham County

- Avg. life expectancy at birth: 80.8 years (state: 79.6 years)
- Poverty rate: 4.8% (state: 7.3%)
- Adults with a bachelor’s degree: 43.6% (state: 39.0%)
- Median household income: $110,225 (state: $90,845)
- County seat: Brentwood
- Counties considered in state: 10
New Jersey: Hunterdon County

- Avg. life expectancy at birth: 83.2 years (state: 79.5 years)
- Poverty rate: 3.7% (state: 9.7%)
- Adults with a bachelor’s degree: 55.5% (state: 42.3%)
- Median household income: $133,534 (state: $97,126)
- County seat: Flemington
- Counties considered in state: 21
New Mexico: Los Alamos County

- Avg. life expectancy at birth: 83.9 years (state: 76.9 years)
- Poverty rate: 3.7% (state: 18.3%)
- Adults with a bachelor’s degree: 69.7% (state: 29.1%)
- Median household income: $135,801 (state: $58,722)
- County seat: Los Alamos
- Counties considered in state: 32
New York: New York County

- Avg. life expectancy at birth: 83.7 years (state: 80.3 years)
- Poverty rate: 15.8% (state: 13.6%)
- Adults with a bachelor’s degree: 62.8% (state: 38.8%)
- Median household income: $99,880 (state: $81,386)
- County seat: Manhattan
- Counties considered in state: 62
North Carolina: Orange County

- Avg. life expectancy at birth: 82.1 years (state: 77.7 years)
- Poverty rate: 12.3% (state: 13.3%)
- Adults with a bachelor’s degree: 61.7% (state: 33.9%)
- Median household income: $85,785 (state: $66,186)
- County seat: Hillsborough
- Counties considered in state: 100
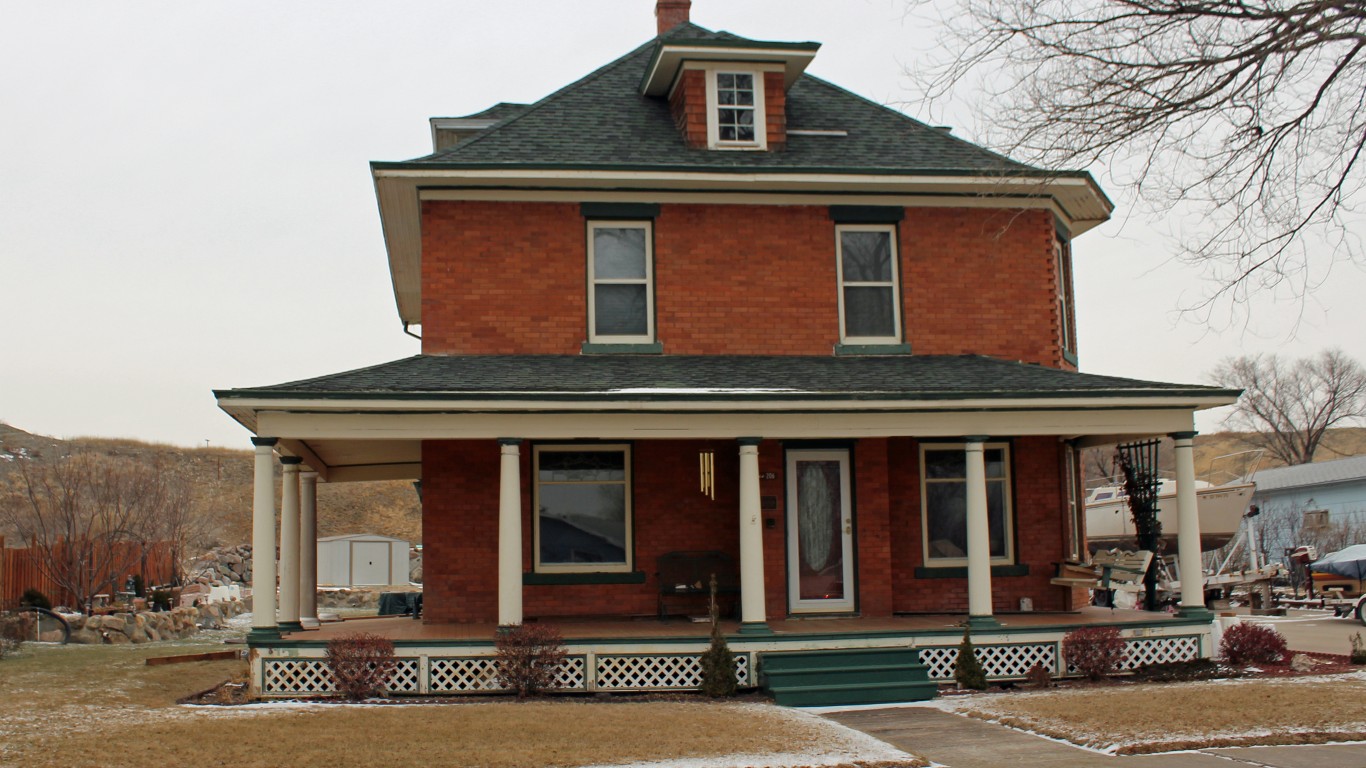
North Dakota: Cass County

- Avg. life expectancy at birth: 79.9 years (state: 78.8 years)
- Poverty rate: 10.8% (state: 10.8%)
- Adults with a bachelor’s degree: 42.6% (state: 31.4%)
- Median household income: $73,249 (state: $73,959)
- County seat: Fargo
- Counties considered in state: 50
Ohio: Delaware County

- Avg. life expectancy at birth: 81.7 years (state: 76.5 years)
- Poverty rate: 4.5% (state: 13.3%)
- Adults with a bachelor’s degree: 57.4% (state: 30.4%)
- Median household income: $123,995 (state: $66,990)
- County seat: Delaware
- Counties considered in state: 88
Oklahoma: Cimarron County

- Avg. life expectancy at birth: 81.8 years (state: 75.5 years)
- Poverty rate: 10.9% (state: 15.2%)
- Adults with a bachelor’s degree: 31.7% (state: 27.3%)
- Median household income: $57,100 (state: $61,364)
- County seat: Boise City
- Counties considered in state: 77
Oregon: Washington County

- Avg. life expectancy at birth: 82.7 years (state: 79.7 years)
- Poverty rate: 8.2% (state: 11.9%)
- Adults with a bachelor’s degree: 45.8% (state: 35.5%)
- Median household income: $100,121 (state: $76,632)
- County seat: Hillsboro
- Counties considered in state: 35
Pennsylvania: Chester County

- Avg. life expectancy at birth: 81.2 years (state: 78.0 years)
- Poverty rate: 6.0% (state: 11.8%)
- Adults with a bachelor’s degree: 56.1% (state: 33.8%)
- Median household income: $118,574 (state: $73,170)
- County seat: West Chester
- Counties considered in state: 67
Rhode Island: Newport County

- Avg. life expectancy at birth: 82.0 years (state: 79.4 years)
- Poverty rate: 7.8% (state: 11.2%)
- Adults with a bachelor’s degree: 52.1% (state: 36.3%)
- Median household income: $96,319 (state: $81,370)
- County seat: Newport
- Counties considered in state: 5
South Carolina: Beaufort County

- Avg. life expectancy at birth: 82.6 years (state: 76.4 years)
- Poverty rate: 10.4% (state: 14.4%)
- Adults with a bachelor’s degree: 43.4% (state: 30.6%)
- Median household income: $81,260 (state: $63,623)
- County seat: Beaufort
- Counties considered in state: 46
South Dakota: Stanley County

- Avg. life expectancy at birth: 91.9 years (state: 78.2 years)
- Poverty rate: 3.2% (state: 12.3%)
- Adults with a bachelor’s degree: 26.9% (state: 30.4%)
- Median household income: $82,298 (state: $69,457)
- County seat: Fort Pierre
- Counties considered in state: 61
Tennessee: Williamson County

- Avg. life expectancy at birth: 81.5 years (state: 75.3 years)
- Poverty rate: 4.2% (state: 14.0%)
- Adults with a bachelor’s degree: 62.0% (state: 29.7%)
- Median household income: $125,943 (state: $64,035)
- County seat: Franklin
- Counties considered in state: 95
Texas: Collin County

- Avg. life expectancy at birth: 82.2 years (state: 78.4 years)
- Poverty rate: 6.3% (state: 13.9%)
- Adults with a bachelor’s degree: 54.3% (state: 32.3%)
- Median household income: $113,255 (state: $73,035)
- County seat: McKinney
- Counties considered in state: 237
Utah: Summit County

- Avg. life expectancy at birth: 85.6 years (state: 79.7 years)
- Poverty rate: 5.2% (state: 8.5%)
- Adults with a bachelor’s degree: 57.4% (state: 36.1%)
- Median household income: $126,392 (state: $86,833)
- County seat: Coalville
- Counties considered in state: 27
Vermont: Chittenden County

- Avg. life expectancy at birth: 81.7 years (state: 79.7 years)
- Poverty rate: 11.2% (state: 10.4%)
- Adults with a bachelor’s degree: 55.7% (state: 41.7%)
- Median household income: $89,494 (state: $74,014)
- County seat: Burlington
- Counties considered in state: 14
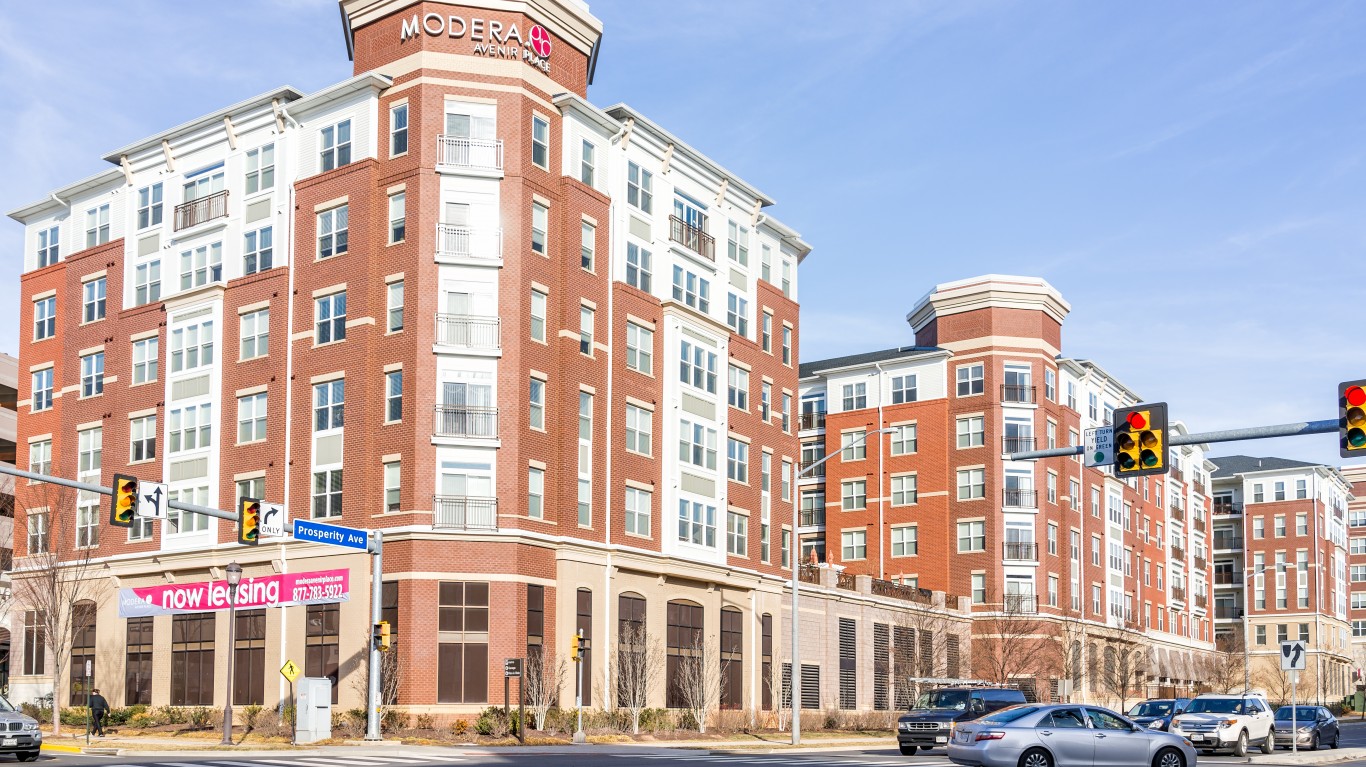
Virginia: Falls Church (independent city)

- Avg. life expectancy at birth: 80.6 years (state: 79.1 years)
- Poverty rate: 2.3% (state: 10.0%)
- Adults with a bachelor’s degree: 78.9% (state: 41.0%)
- Median household income: $164,536 (state: $87,249)
- County seat: None
- County equivalents considered in state: 133
Washington: San Juan County

- Avg. life expectancy at birth: 86.3 years (state: 80.2 years)
- Poverty rate: 11.0% (state: 9.9%)
- Adults with a bachelor’s degree: 52.6% (state: 38.0%)
- Median household income: $76,745 (state: $90,325)
- County seat: Friday Harbor
- Counties considered in state: 39
West Virginia: Monongalia County

- Avg. life expectancy at birth: 79.3 years (state: 74.3 years)
- Poverty rate: 20.6% (state: 16.8%)
- Adults with a bachelor’s degree: 48.3% (state: 22.7%)
- Median household income: $60,893 (state: $55,217)
- County seat: Morgantown
- Counties considered in state: 55
Wisconsin: Ozaukee County

- Avg. life expectancy at birth: 81.9 years (state: 78.9 years)
- Poverty rate: 4.5% (state: 10.7%)
- Adults with a bachelor’s degree: 49.8% (state: 32.0%)
- Median household income: $92,258 (state: $72,458)
- County seat: Port Washington
- Counties considered in state: 72
Wyoming: Teton County

- Avg. life expectancy at birth: 86.7 years (state: 78.1 years)
- Poverty rate: 6.9% (state: 10.7%)
- Adults with a bachelor’s degree: 60.3% (state: 29.0%)
- Median household income: $108,279 (state: $72,495)
- County seat: Jackson
- Counties considered in state: 23
The #1 Thing to Do Before You Claim Social Security (Sponsor)
Choosing the right (or wrong) time to claim Social Security can dramatically change your retirement. So, before making one of the biggest decisions of your financial life, it’s a smart idea to get an extra set of eyes on your complete financial situation.
A financial advisor can help you decide the right Social Security option for you and your family. Finding a qualified financial advisor doesn’t have to be hard. SmartAsset’s free tool matches you with up to three financial advisors who serve your area, and you can interview your advisor matches at no cost to decide which one is right for you.
Click here to match with up to 3 financial pros who would be excited to help you optimize your Social Security outcomes.
Have questions about retirement or personal finance? Email us at [email protected]!
By emailing your questions to 24/7 Wall St., you agree to have them published anonymously on a673b.bigscoots-temp.com.
By submitting your story, you understand and agree that we may use your story, or versions of it, in all media and platforms, including via third parties.
Thank you for reading! Have some feedback for us?
Contact the 24/7 Wall St. editorial team.


