What’s the best weather? Well, that’s debatable, obviously. Some prefer somewhat cooler temperatures, while others love the heat. There are those who prefer drier climates, while others thrive with greater humidity. And let’s not forget rain, wind, cloud cover conditions, and so on and so on.
Complicating matters further is that some conditions work well together, mitigating extremes. For example, higher temperatures can often be better tolerated if the air is drier. But that could contribute to arid conditions, which usually is not ideal. Trying to find a balance to calculate the absolute perfect weather is therefore nearly impossible. But we tried anyway.
To determine the city with the best weather, 24/7 Wall St. used Comparative Climatic Data from the National Oceanic and Atmospheric Administration to create an index based on average temperatures, precipitation, cloud cover, wind, humidity, and more. We aimed to use the most preferred conditions as ideals. For example, 72 degrees Fahrenheit was our ideal temperature and we penalized cities that deviated too far from this temperature one way or another. Similarly, 40 inches of rain and 40% humidity were determined as ideals, and cities were penalized if they deviated too much from those points. The result is a list of 50 cities that when we averaged their weather conditions ranked the highest on our index, though some may question their presence here and not others.
It is worth noting that the data we used is averaging decades and decades of data points — including observations from early in the previous century. But in today’s global warming environment, the weather in many cities is changing, with some cities becoming hotter and with less precipitation, while others are suffering from more frequent natural disasters. (Also see: US Cities That Don’t See The Sun During Winter.)
Naturally, warmer climates dominate the list, and cities in only 11 states made the list. Of those, 10 cities are in California (including seven in the top 10), 10 are in Florida, nine in Texas, and six in Georgia. South and North Carolina are home to seven cities on the list, and Hawaii is home to three. No cities in the Midwest or the Northeast made the list.
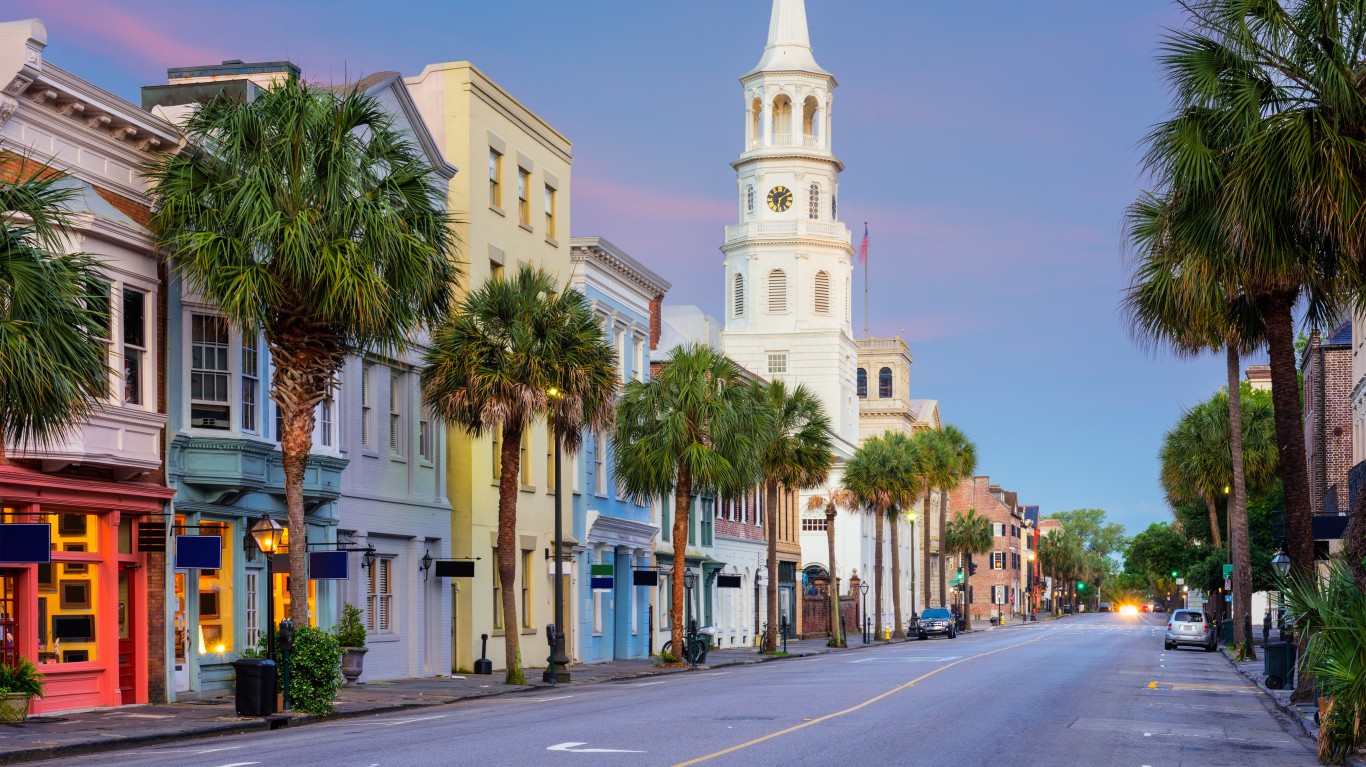
At the absolute top of the list, Long Beach, California, received the highest index score and was determined to have the absolute best weather nationwide. Los Angeles and San Diego came in second and third, while Charleston, South Carolina, ranked No. 4. Honolulu and Maui’s Kahului rank in fifth and sixth place. Rounding out the top 10 are four more cities in California.
Why Are We Covering This
Full methodology:

The exact measures included in the index are:
Observed data:
- The average number of days per year with a maximum temperature of 90° F or higher
- The average number of days per year with a minimum temperature of 32° F or lower
- The average number of days per year with 0.01 inches of precipitation or more
- The average wind speed
- The mean number of cloudy days per year
- The absolute difference in average year-round relative humidity in the afternoon from an ideal 40% humidity level
Climatological normals:
- The absolute difference in normal daily maximum temperature from an ideal temperature of 72° F
- The absolute difference in normal daily minimum temperature from 72° F
- The absolute difference in normal daily mean temperature from 72° F
- Normal heating degree days (the number of degrees that the daily average temperature falls below 65° F)
- The absolute difference in average annual precipitation from an ideal annual rainfall total of 40 inches
50. Norfolk, Virginia (77.9/100)

- Avg. annual temperature: 61.6 F
- Avg. rainy days per year: 117 days for an avg of 49.2 inches annually
- Avg. days of over 90F per year: 34 days
- Avg. days below freezing per year: 48 days
- Avg. sunny or partly cloudy days per year: 212 days
49. Tucson, Arizona (77.9/100)
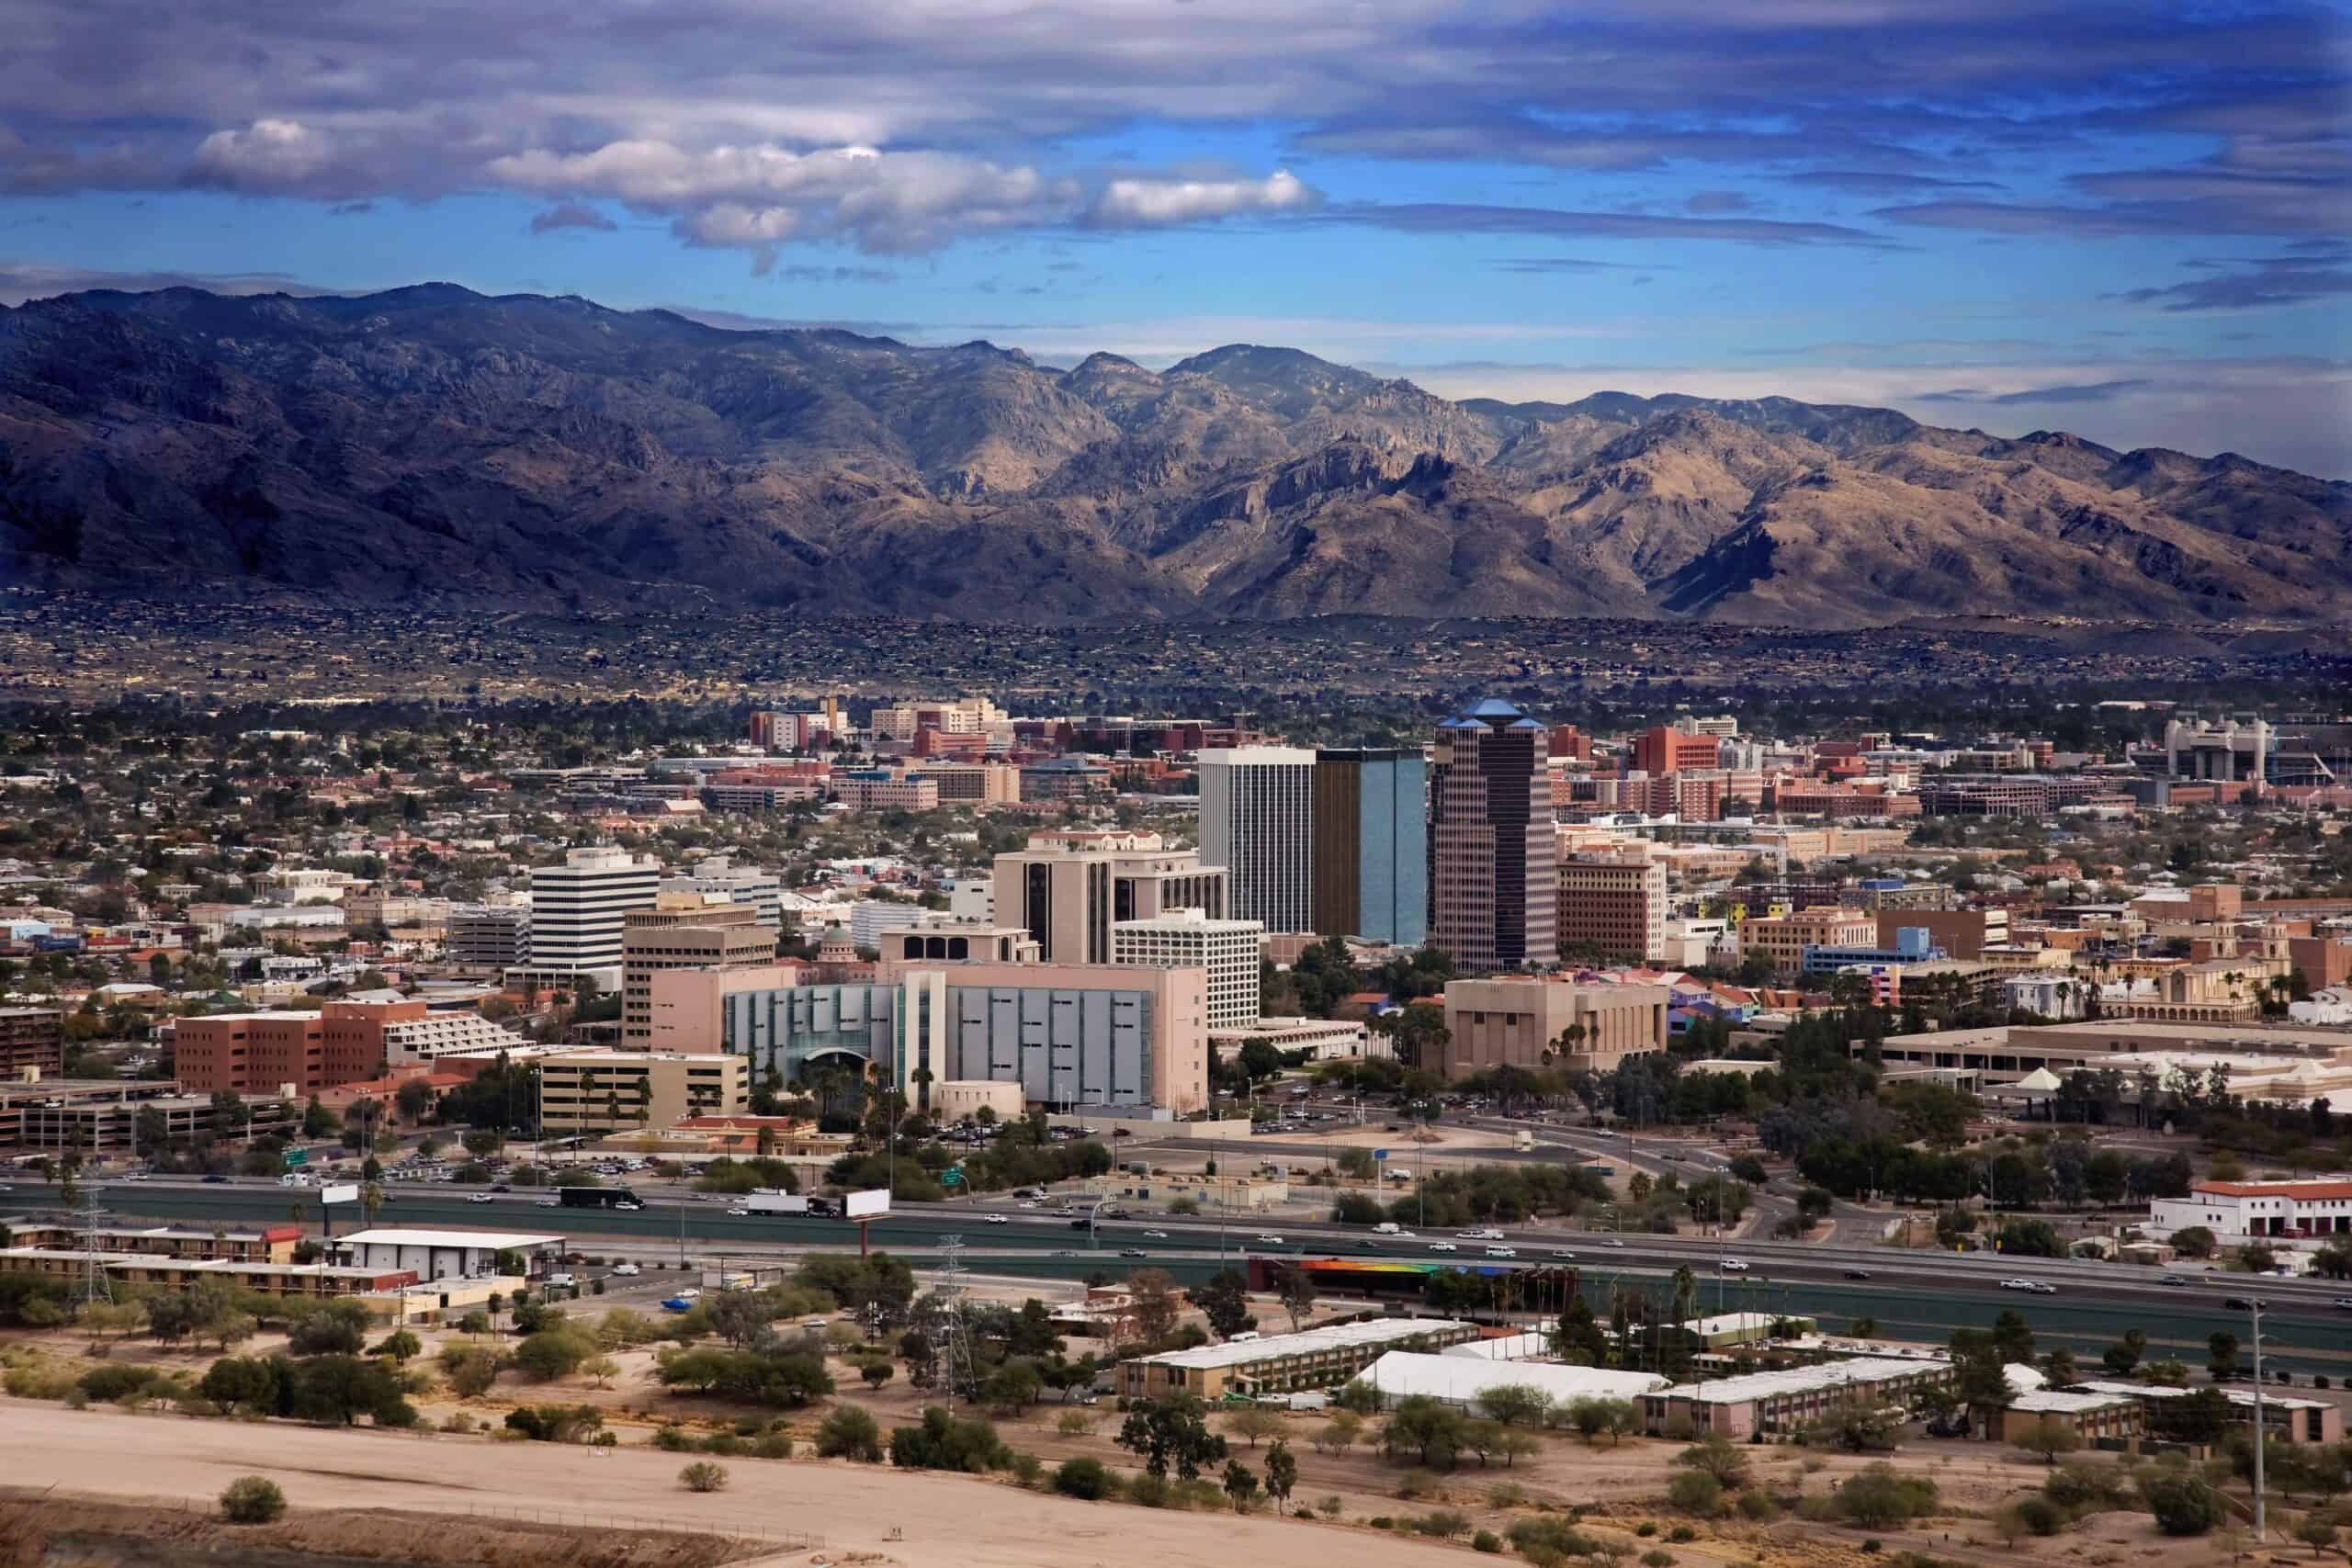
- Avg. annual temperature: 70.6 F
- Avg. rainy days per year: 51 days for an avg of 10.6 inches annually
- Avg. days of over 90F per year: 148 days
- Avg. days below freezing per year: 15 days
- Avg. sunny or partly cloudy days per year: 284 days
48. Del Rio, Texas (77.9/100)
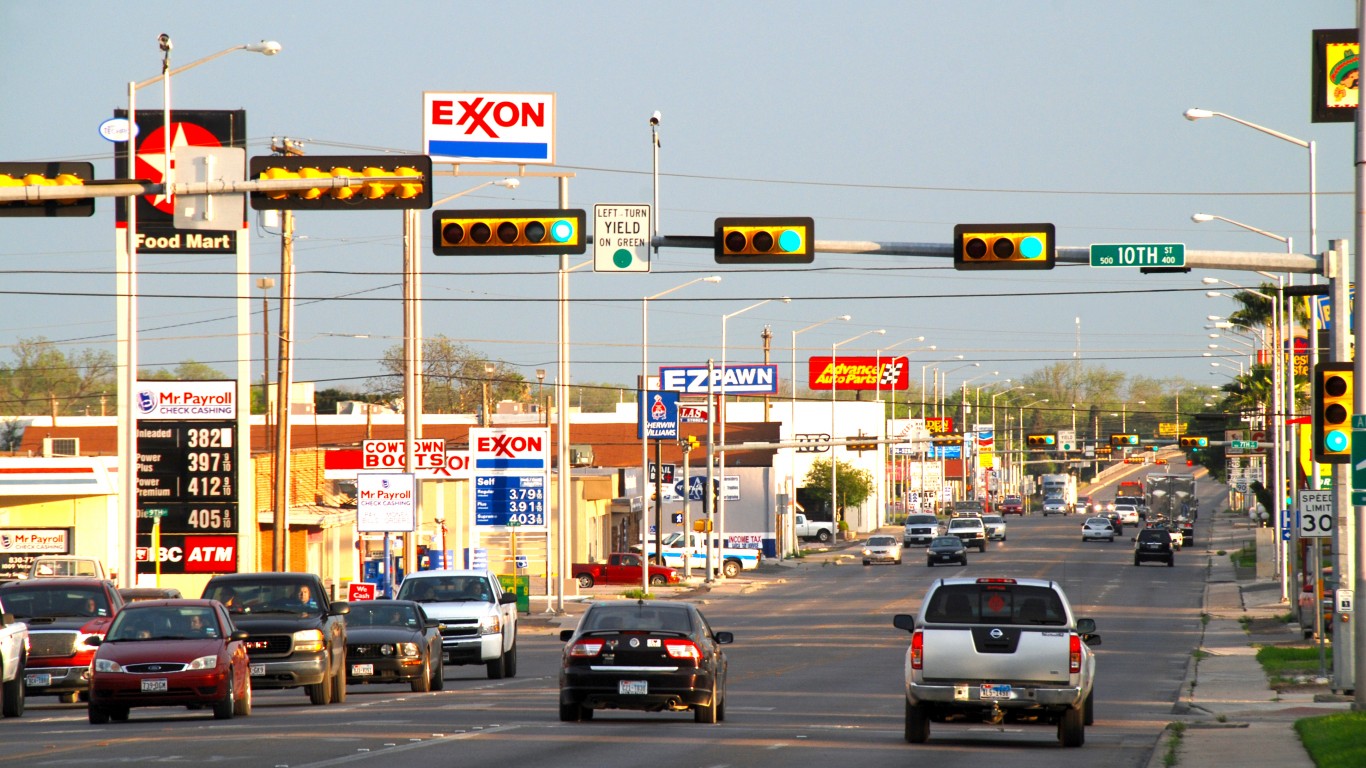
- Avg. annual temperature: 71.5 F
- Avg. rainy days per year: 58 days for an avg of 19.8 inches annually
- Avg. days of over 90F per year: 136 days
- Avg. days below freezing per year: 14 days
- Avg. sunny or partly cloudy days per year: 227 days
47. New Orleans, Louisiana (78.0/100)
- Avg. annual temperature: 70.5 F
- Avg. rainy days per year: 114 days for an avg of 63.4 inches annually
- Avg. days of over 90F per year: 77 days
- Avg. days below freezing per year: 10 days
- Avg. sunny or partly cloudy days per year: 219 days
46. Corpus Christi, Texas (78.0/100)
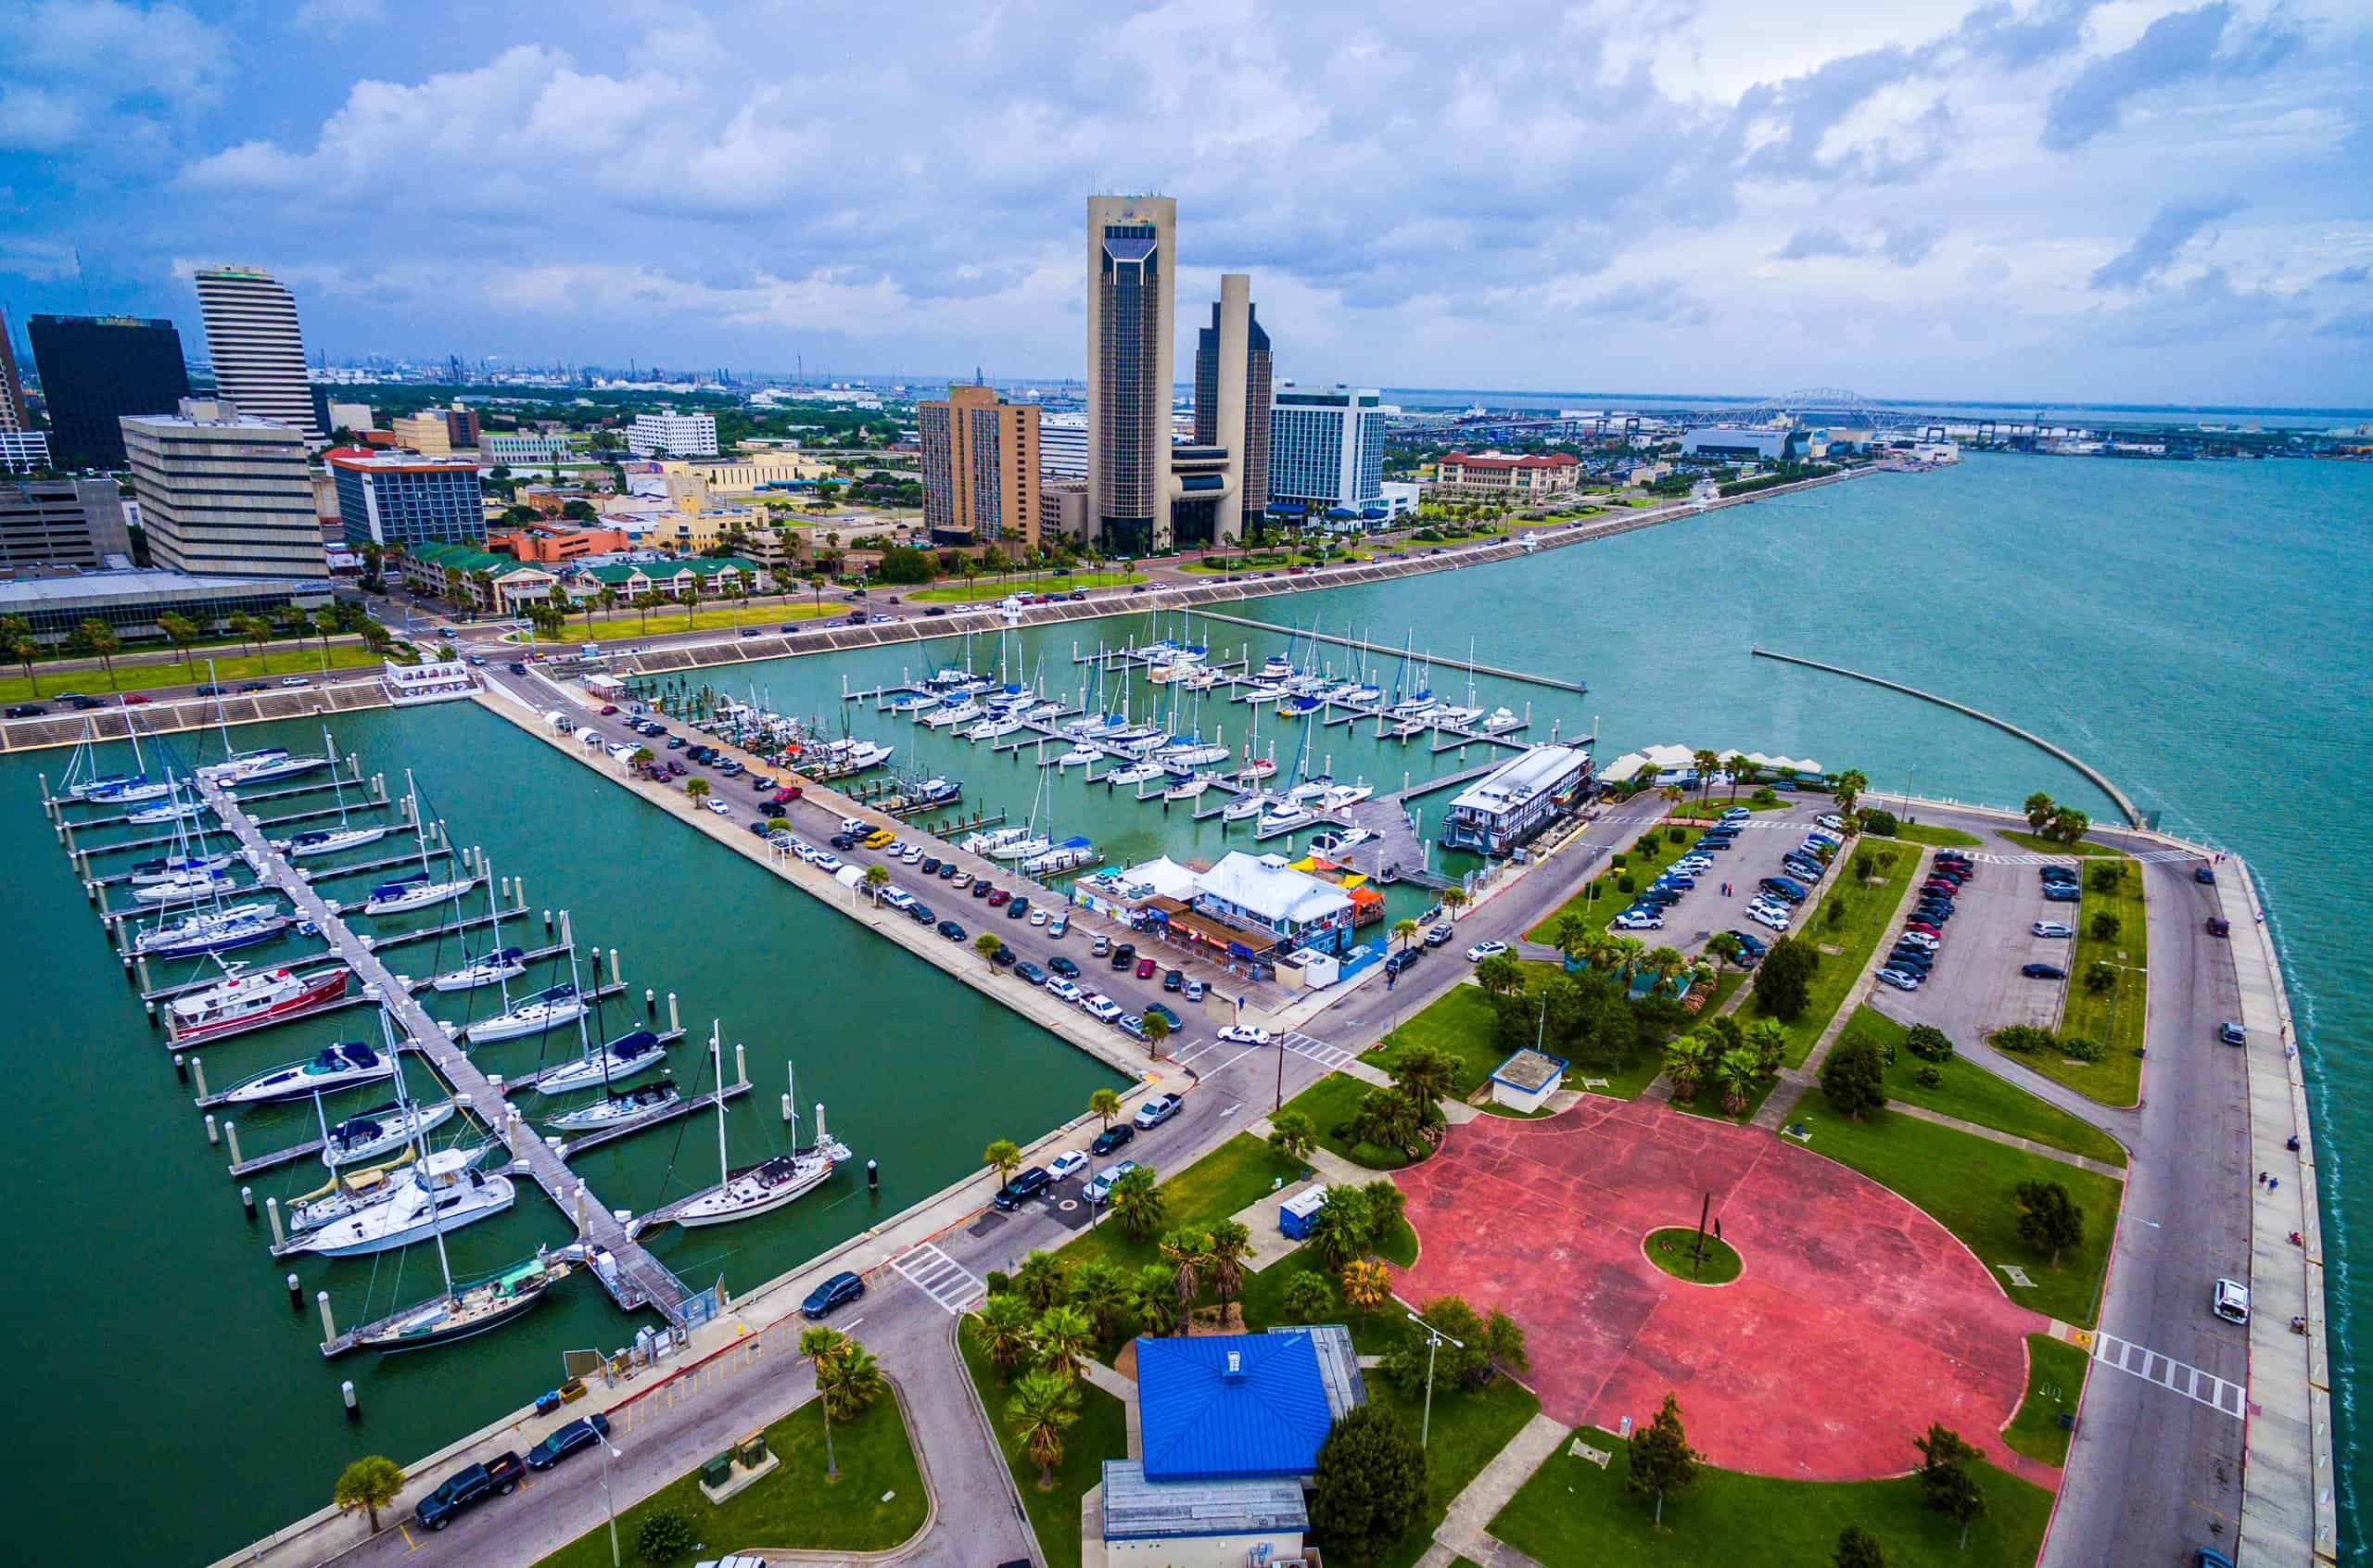
- Avg. annual temperature: 73 F
- Avg. rainy days per year: 76 days for an avg of 31.7 inches annually
- Avg. days of over 90F per year: 114 days
- Avg. days below freezing per year: 6 days
- Avg. sunny or partly cloudy days per year: 223 days
45. Wilmington, North Carolina (78.0/100)
- Avg. annual temperature: 64.4 F
- Avg. rainy days per year: 119 days for an avg of 60.2 inches annually
- Avg. days of over 90F per year: 46 days
- Avg. days below freezing per year: 40 days
- Avg. sunny or partly cloudy days per year: 215 days
44. Phoenix, Arizona (78.2/100)

- Avg. annual temperature: 75.6 F
- Avg. rainy days per year: 35 days for an avg of 7.2 inches annually
- Avg. days of over 90F per year: 170 days
- Avg. days below freezing per year: 8 days
- Avg. sunny or partly cloudy days per year: 295 days
43. San Angelo, Texas (78.3/100)
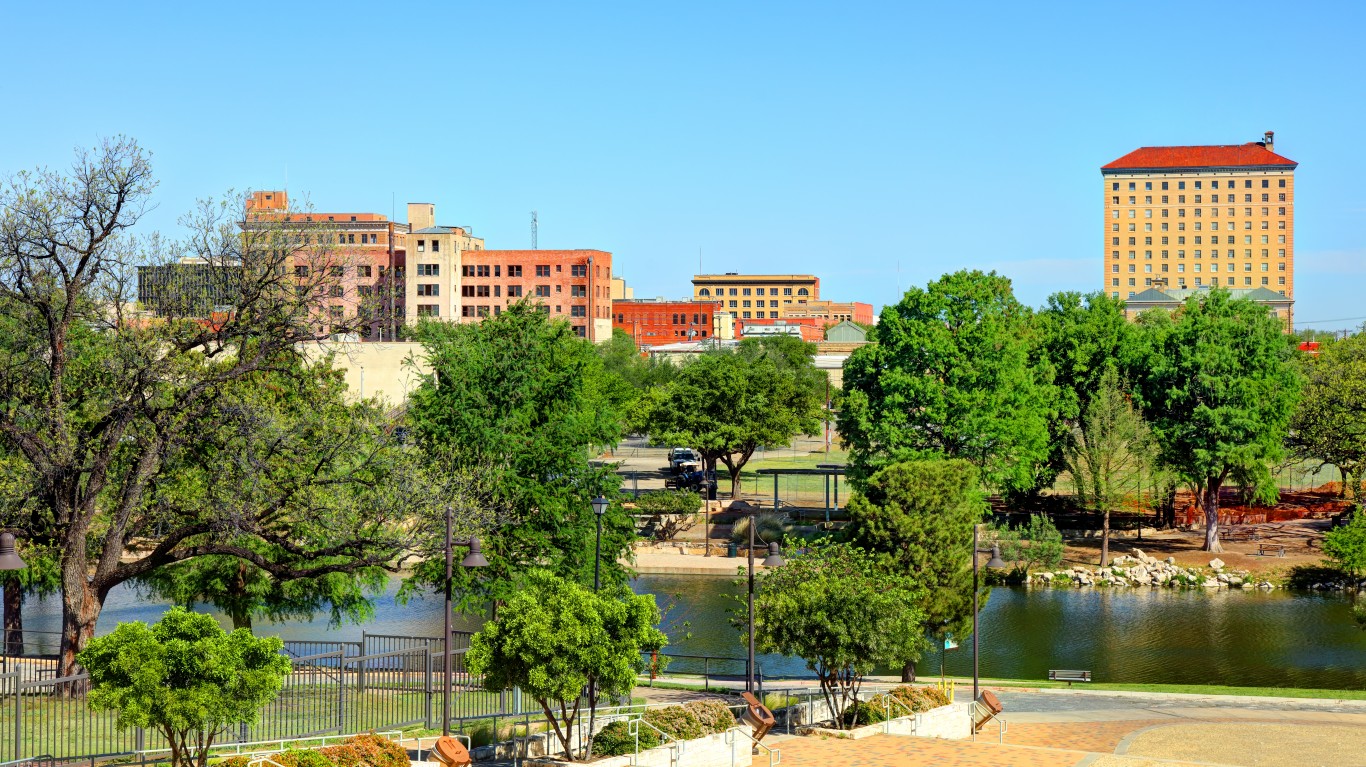
- Avg. annual temperature: 66.7 F
- Avg. rainy days per year: 58 days for an avg of 20.9 inches annually
- Avg. days of over 90F per year: 115 days
- Avg. days below freezing per year: 50 days
- Avg. sunny or partly cloudy days per year: 251 days
42. Abilene, Texas (78.3/100)
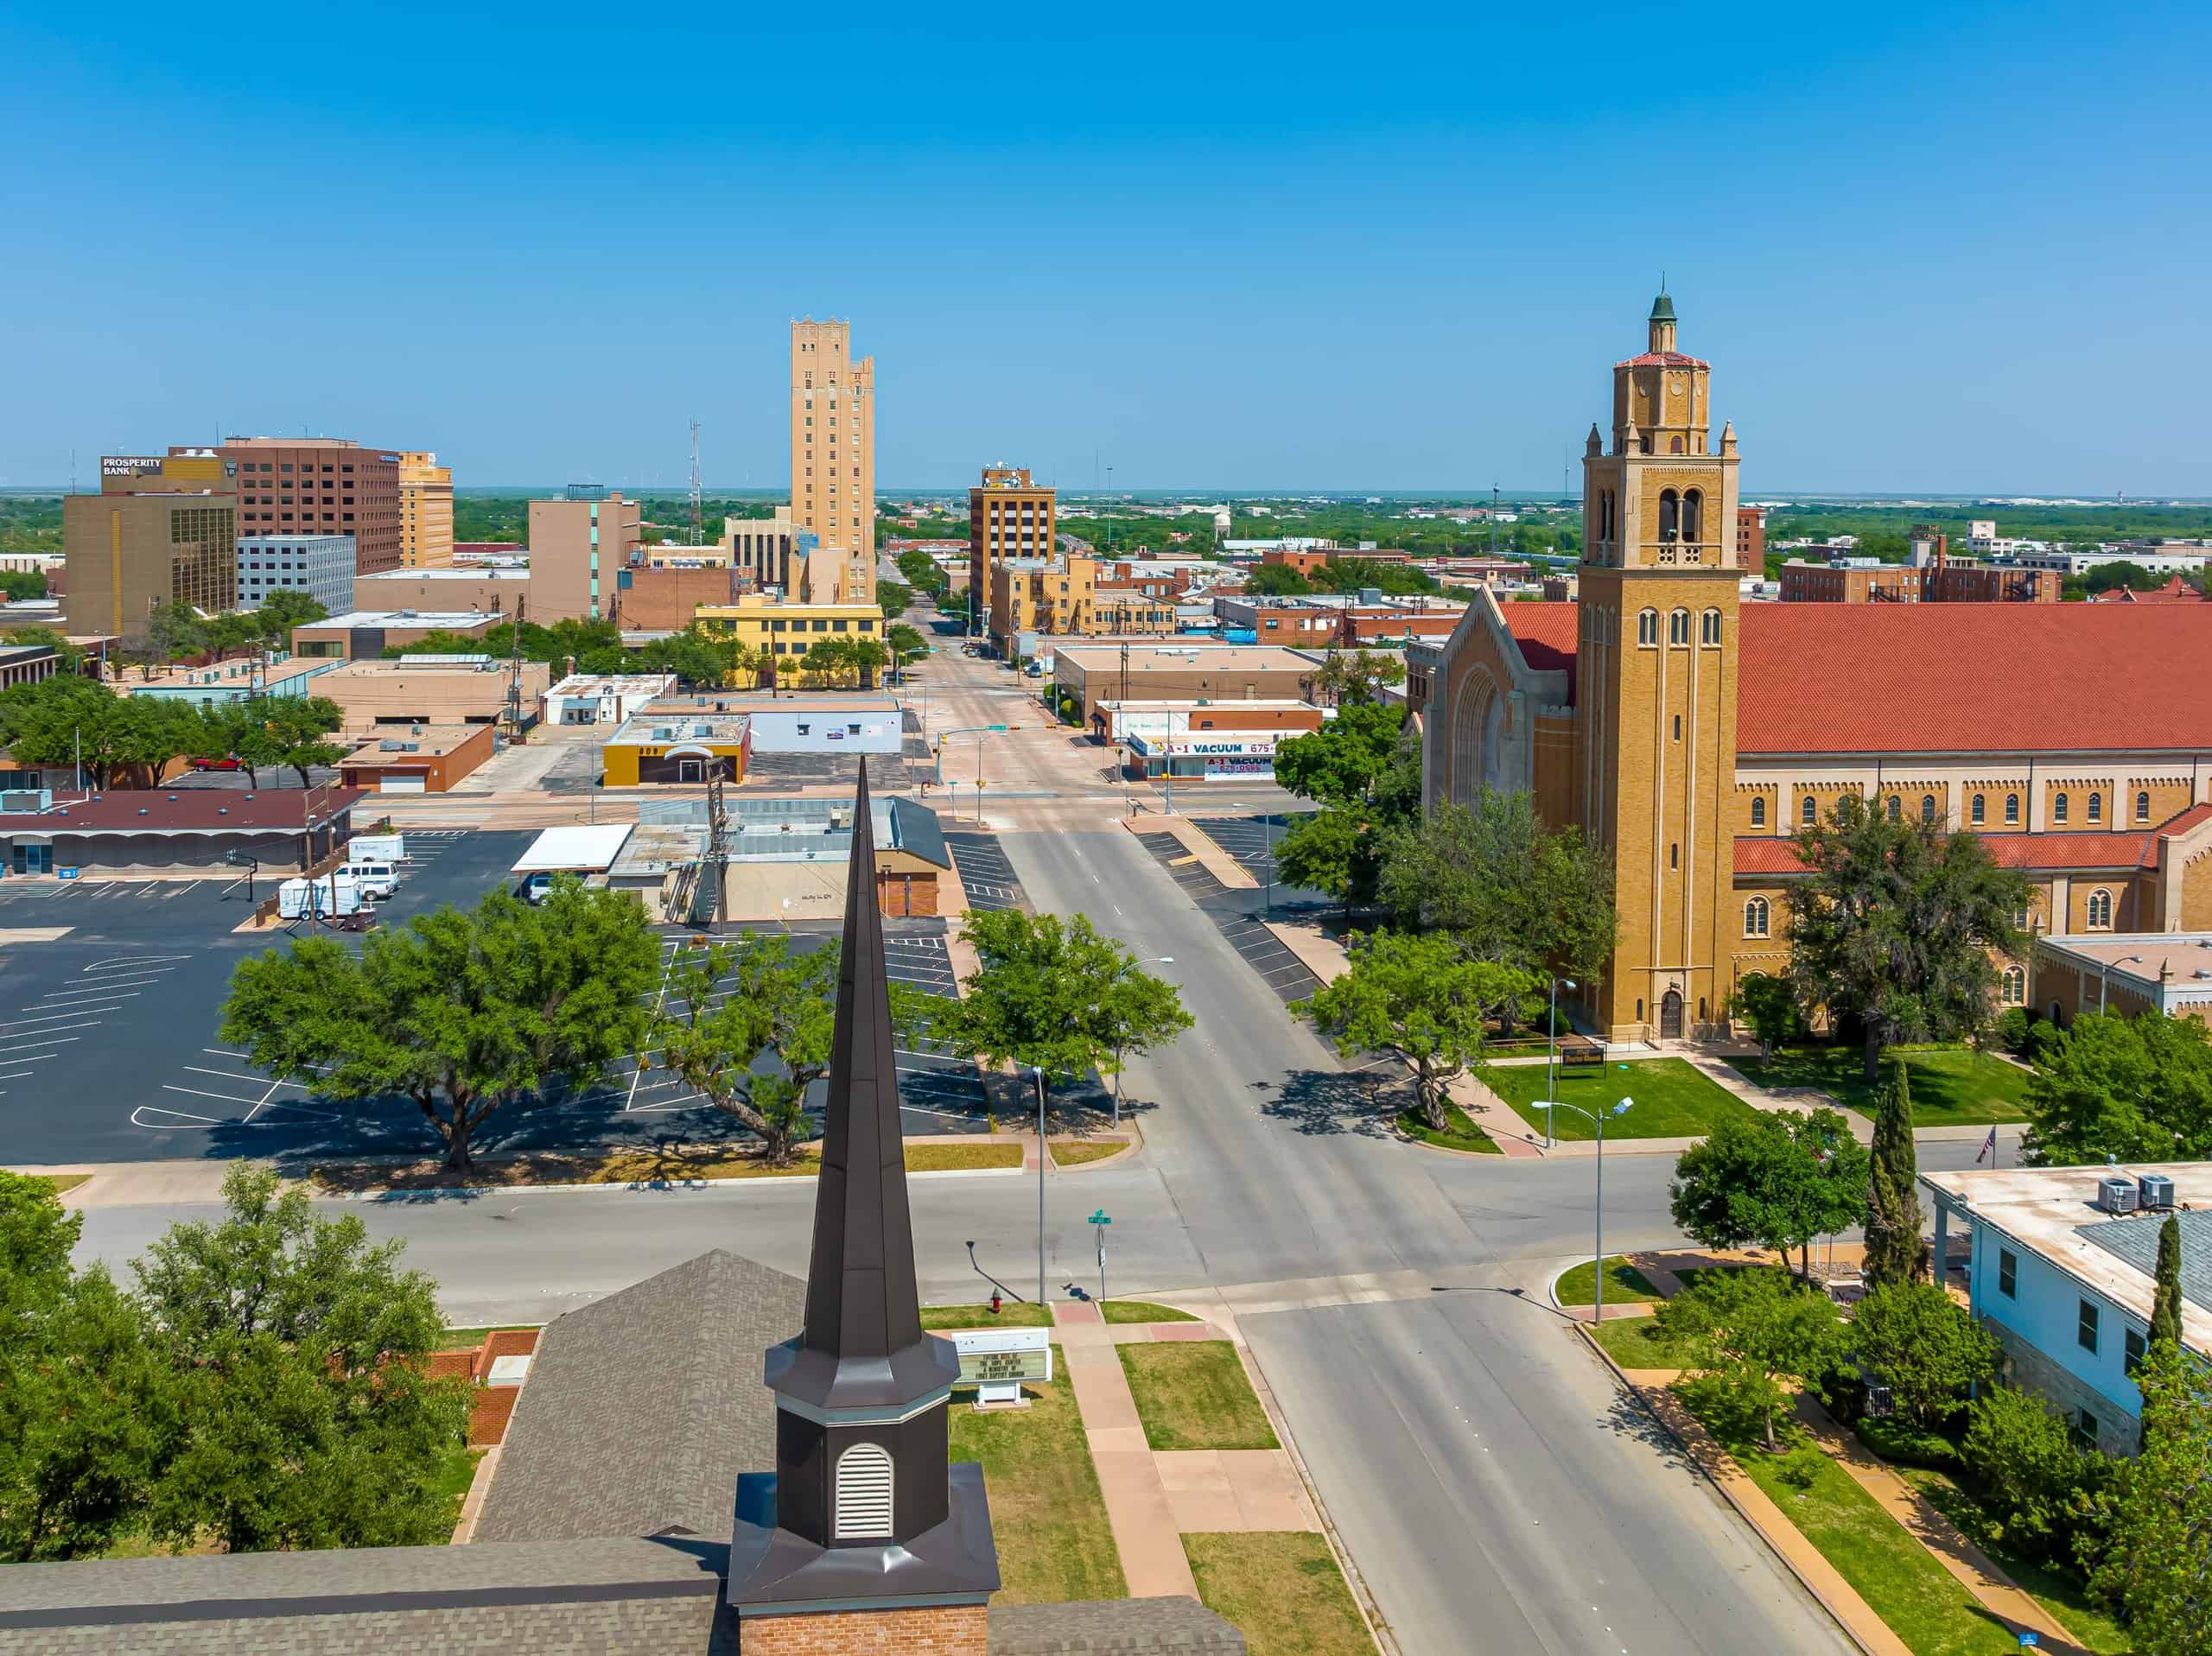
- Avg. annual temperature: 65.9 F
- Avg. rainy days per year: 66 days for an avg of 25.2 inches annually
- Avg. days of over 90F per year: 103 days
- Avg. days below freezing per year: 50 days
- Avg. sunny or partly cloudy days per year: 244 days
41. Tallahassee, Florida (78.4/100)
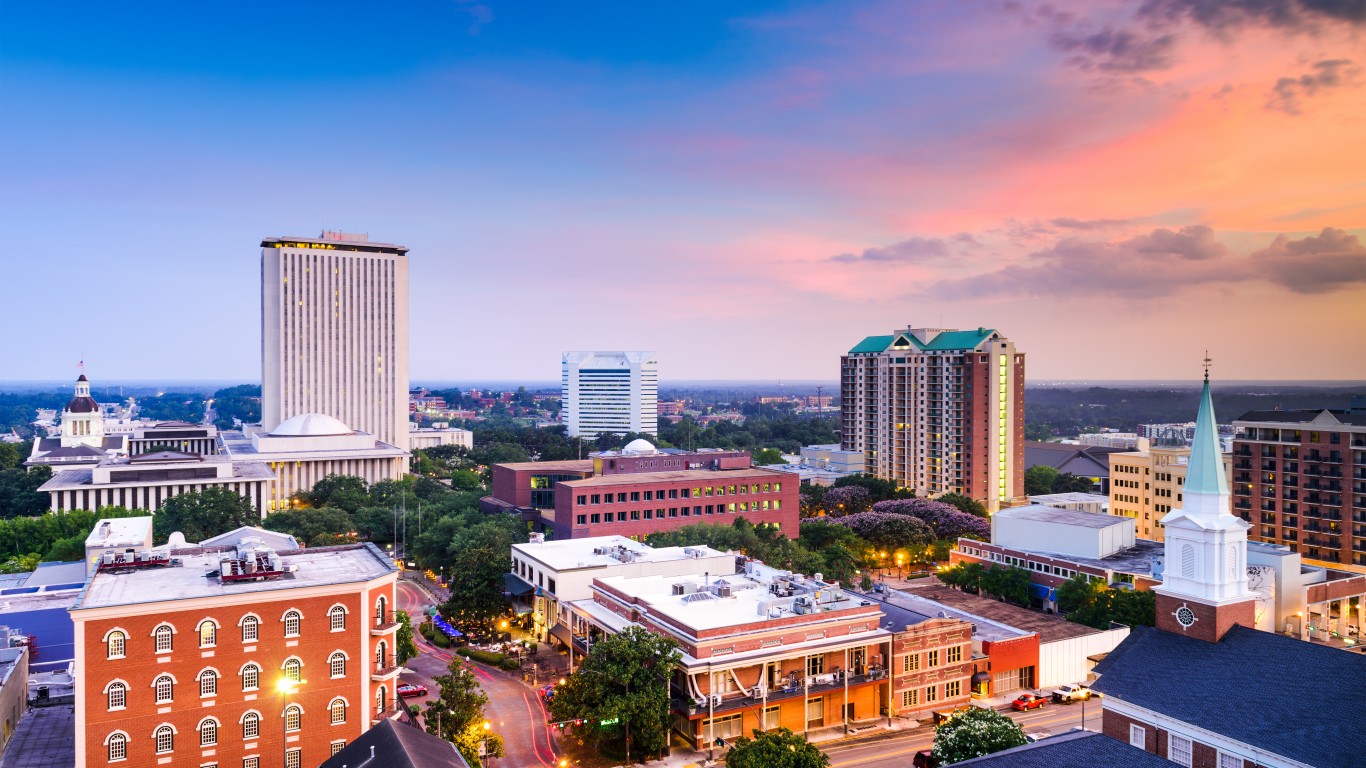
- Avg. annual temperature: 68.5 F
- Avg. rainy days per year: 115 days for an avg of 58.8 inches annually
- Avg. days of over 90F per year: 92 days
- Avg. days below freezing per year: 28 days
- Avg. sunny or partly cloudy days per year: 231 days
40. West Palm beach, Florida (78.4/100)
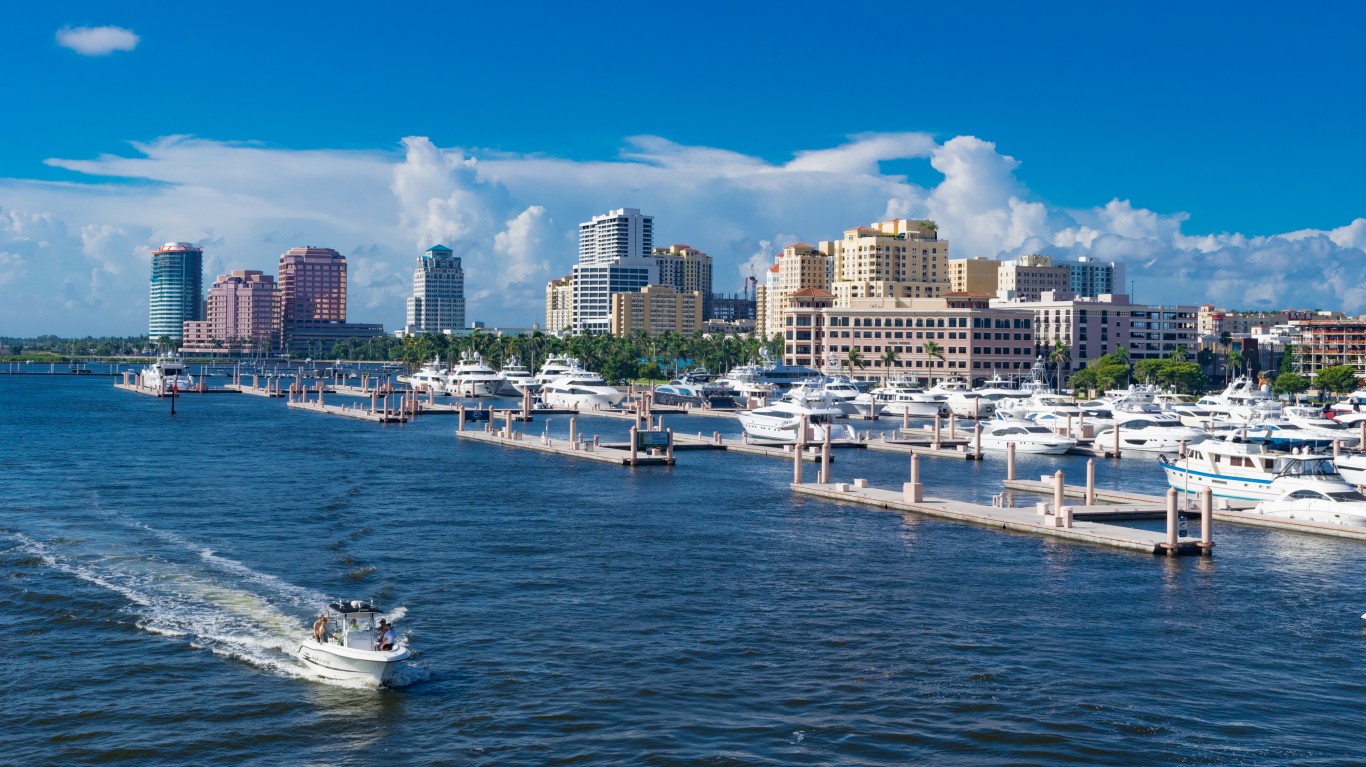
- Avg. annual temperature: 75.8 F
- Avg. rainy days per year: 134 days for an avg of 61.8 inches annually
- Avg. days of over 90F per year: 76 days
- Avg. days below freezing per year: 0 days
- Avg. sunny or partly cloudy days per year: 234 days
39. Pensacola, Florida (78.4/100)
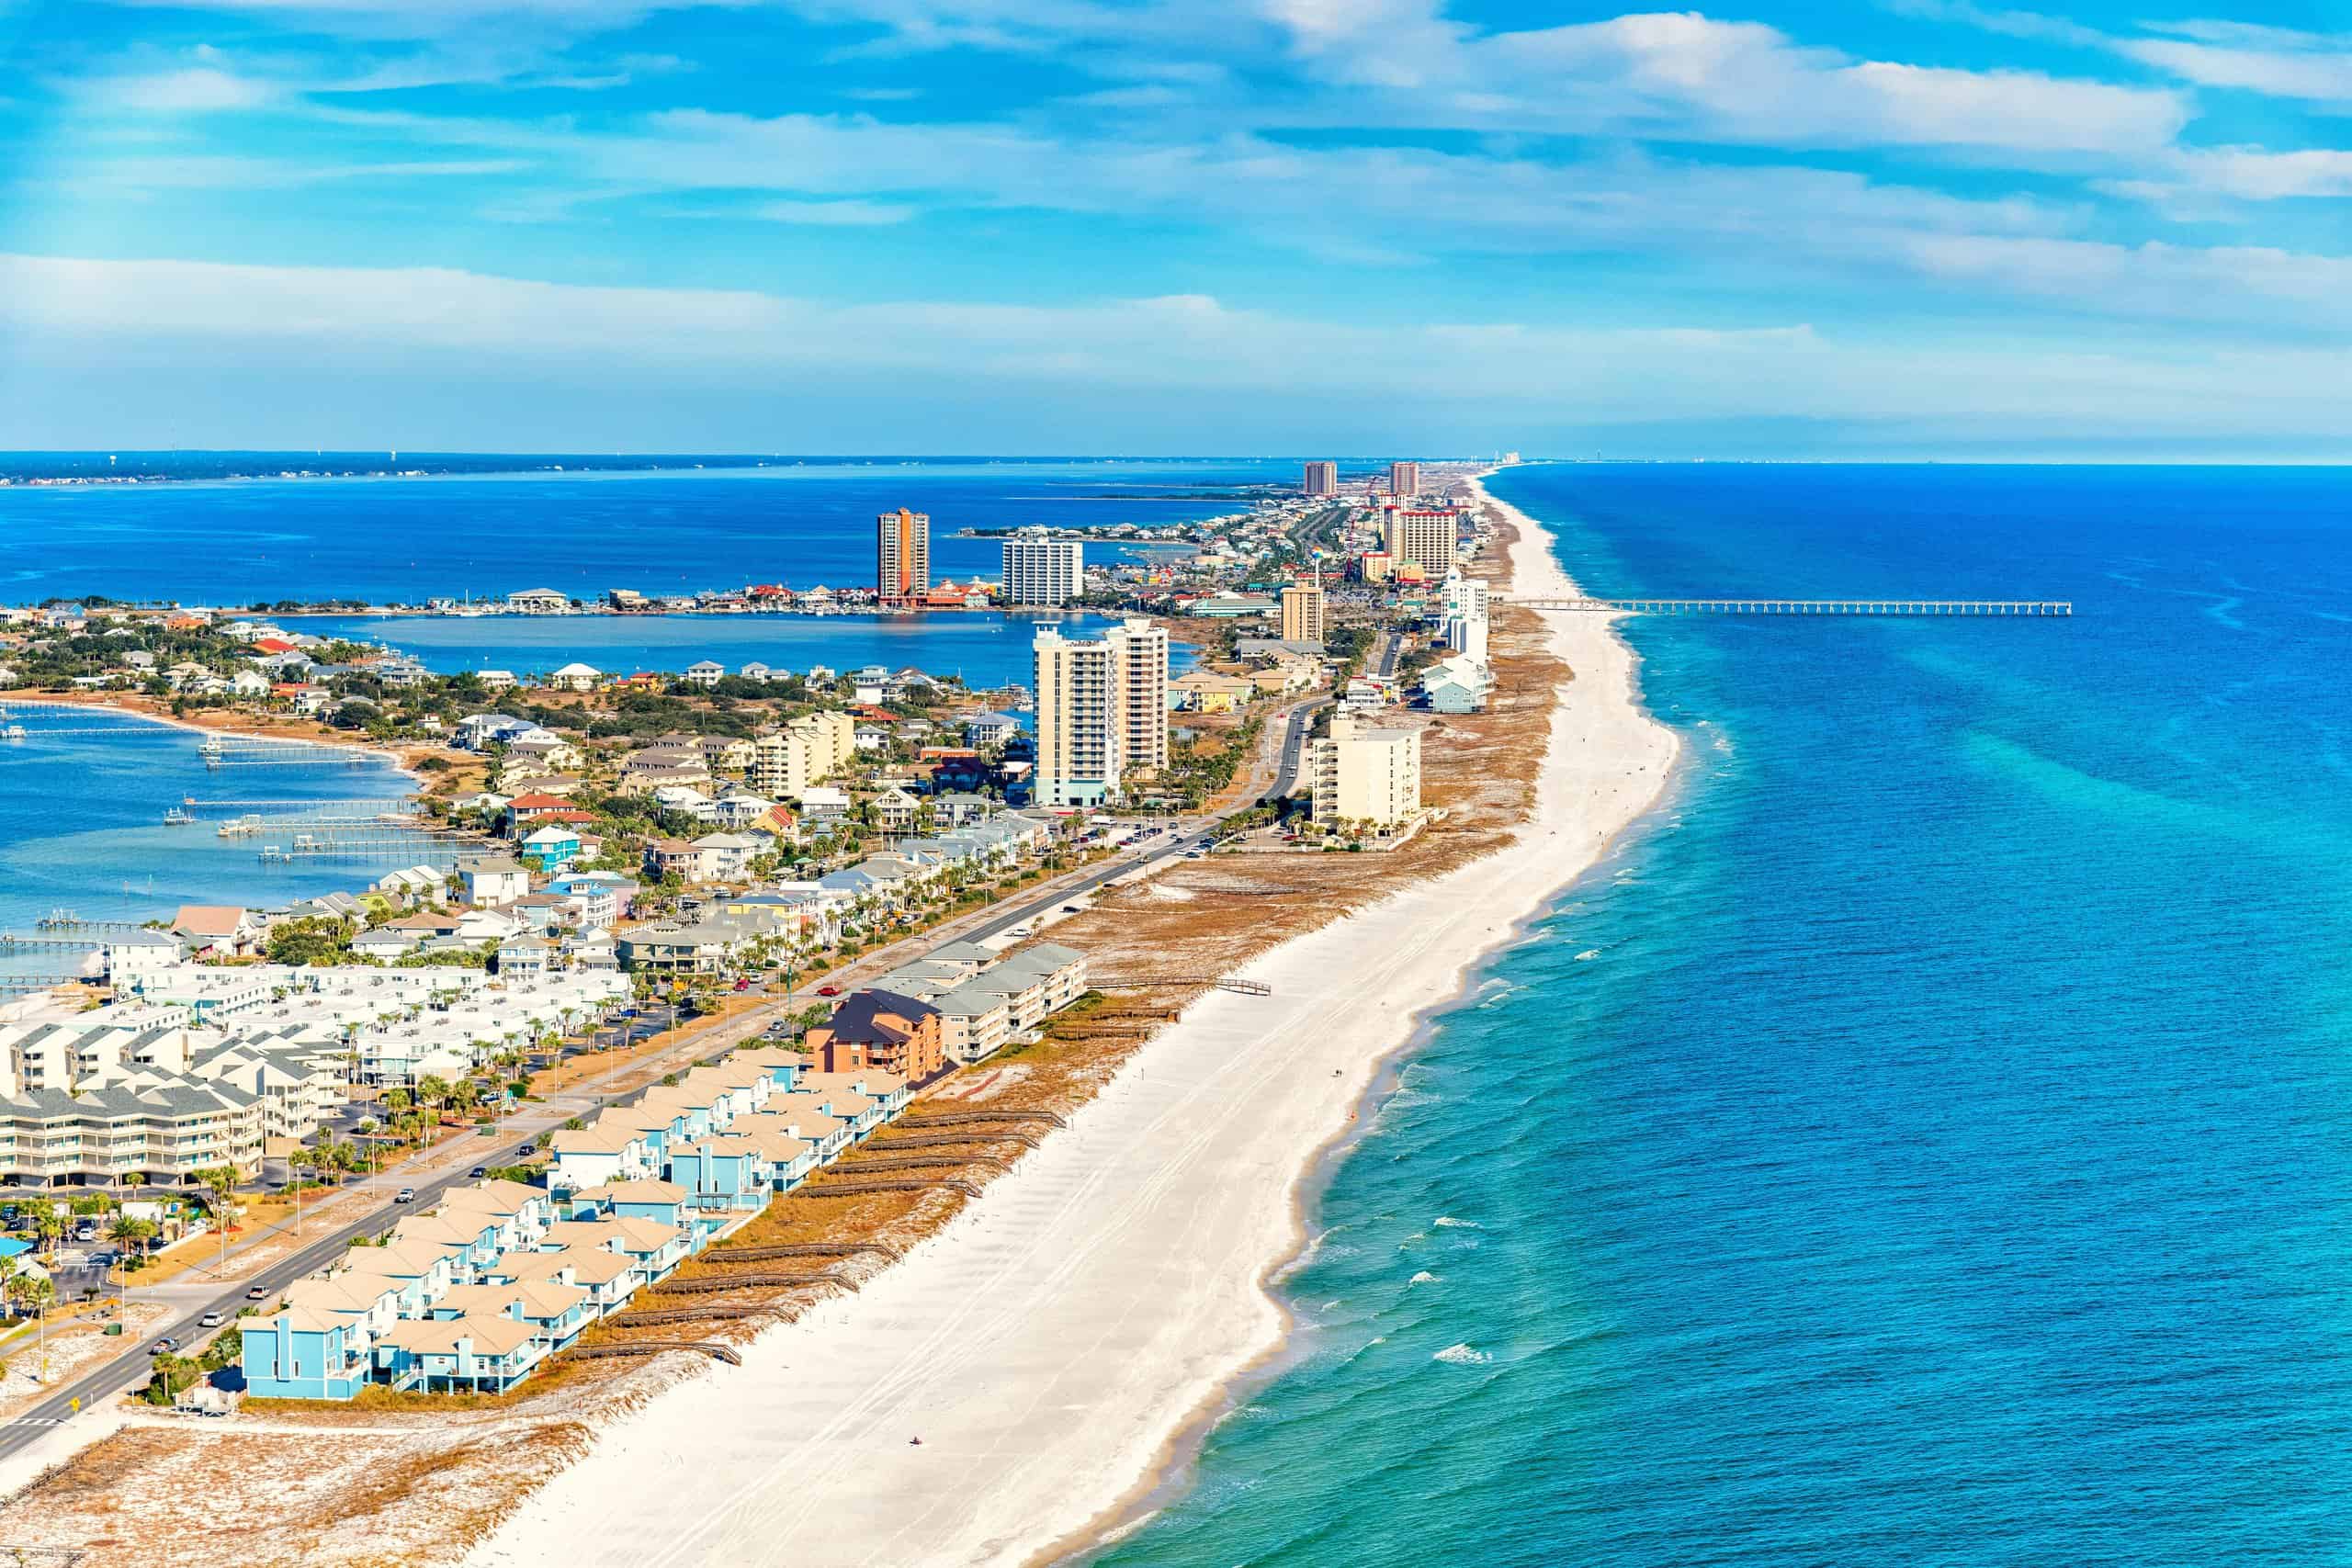
- Avg. annual temperature: 69.4 F
- Avg. rainy days per year: 113 days for an avg of 68.3 inches annually
- Avg. days of over 90F per year: 64 days
- Avg. days below freezing per year: 13 days
- Avg. sunny or partly cloudy days per year: 228 days
38. Macon, Georgia (78.4/100)

- Avg. annual temperature: 65.4 F
- Avg. rainy days per year: 109 days for an avg of 46.9 inches annually
- Avg. days of over 90F per year: 86 days
- Avg. days below freezing per year: 42 days
- Avg. sunny or partly cloudy days per year: 218 days
37. Las Vegas, Nevada (78.5/100)

- Avg. annual temperature: 70.1 F
- Avg. rainy days per year: 26 days for an avg of 4.2 inches annually
- Avg. days of over 90F per year: 136 days
- Avg. days below freezing per year: 25 days
- Avg. sunny or partly cloudy days per year: 292 days
36. Raleigh, North Carolina (78.6/100)
- Avg. annual temperature: 61.2 F
- Avg. rainy days per year: 114 days for an avg of 46.1 inches annually
- Avg. days of over 90F per year: 45 days
- Avg. days below freezing per year: 71 days
- Avg. sunny or partly cloudy days per year: 216 days
35. Cape Hatteras, North Carolina (78.6/100)
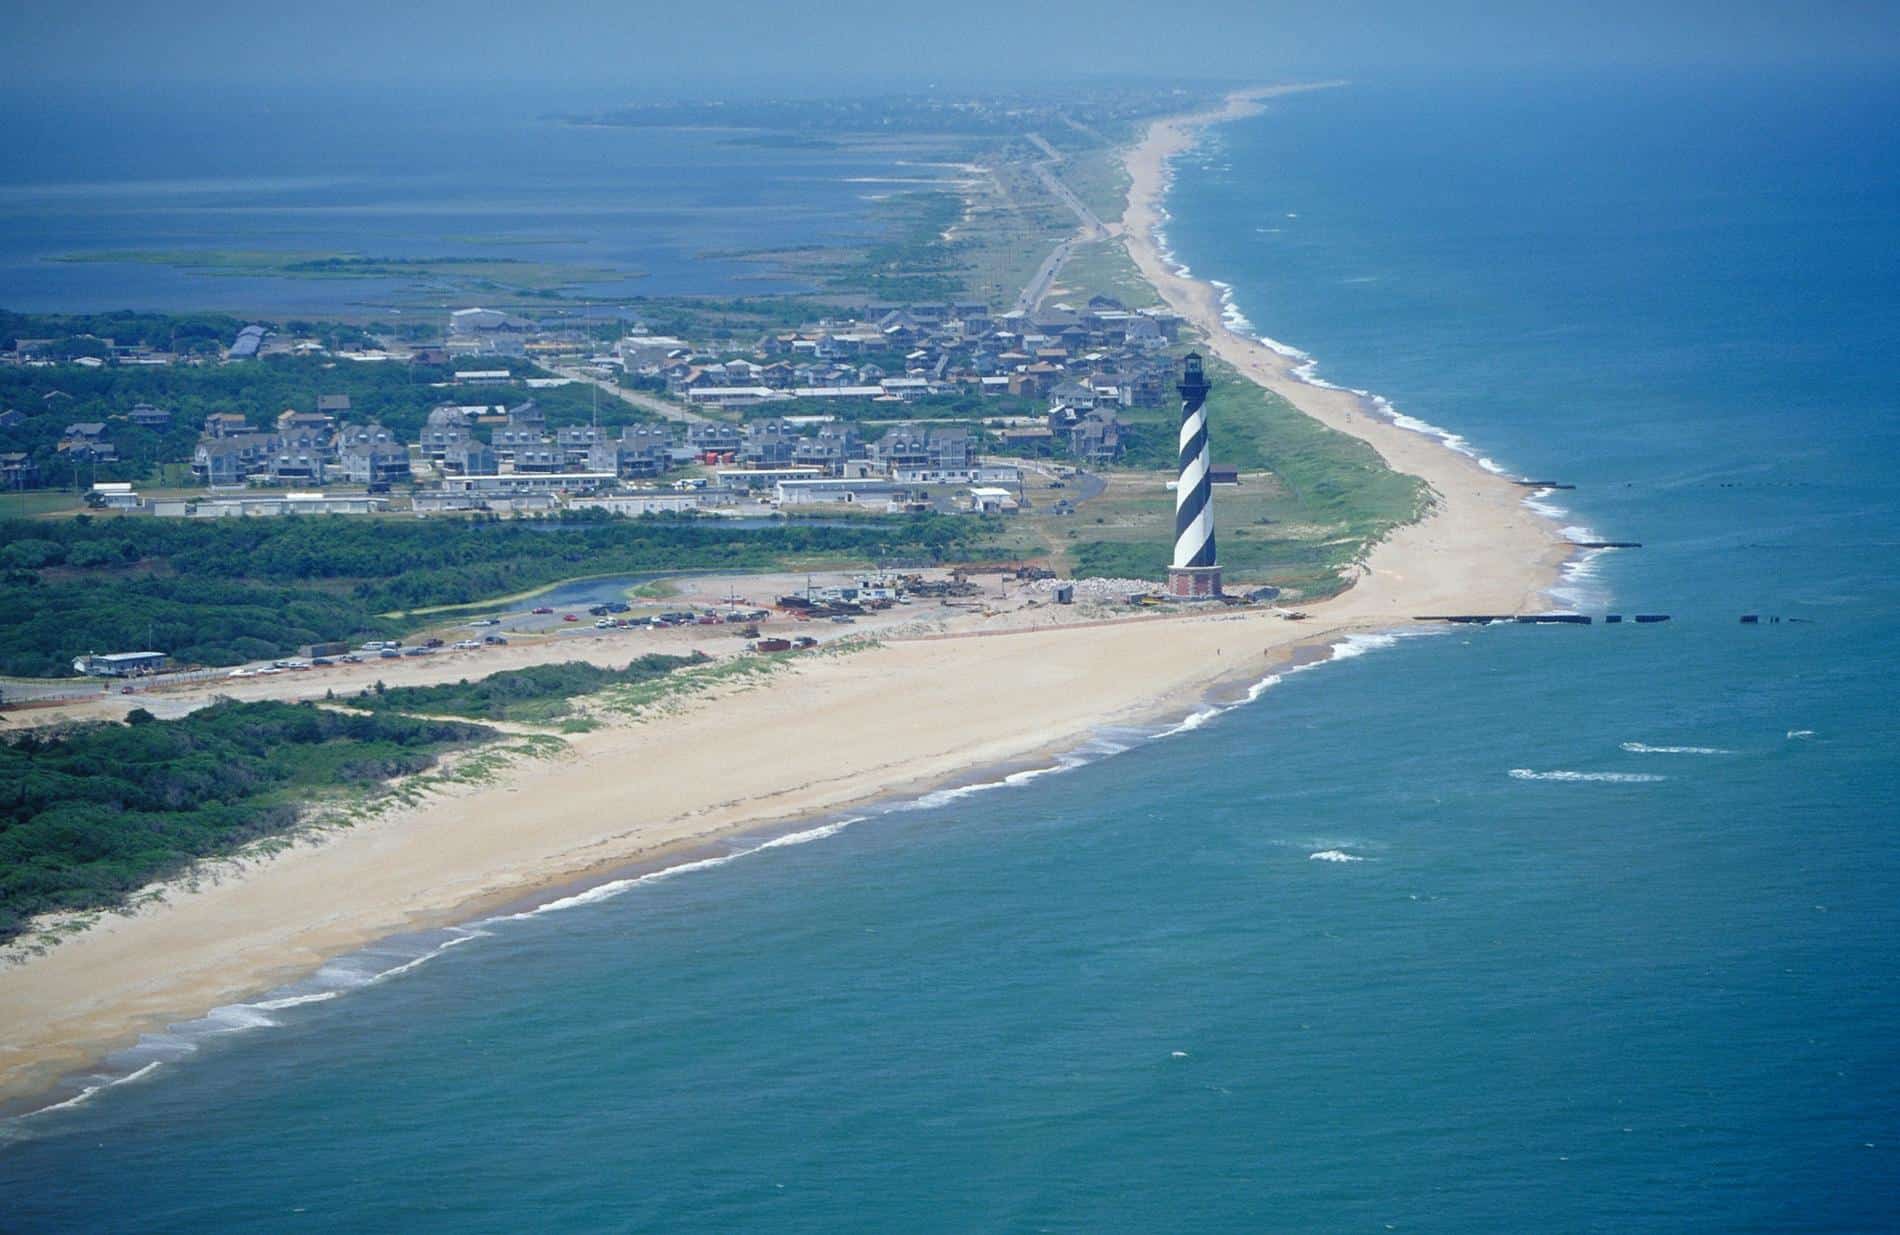
- Avg. annual temperature: 64.8 F
- Avg. rainy days per year: 123 days for an avg of 61.2 inches annually
- Avg. days of over 90F per year: 6 days
- Avg. days below freezing per year: 24 days
- Avg. sunny or partly cloudy days per year: 209 days
34. San Antonio, Texas (78.7/100)

- Avg. annual temperature: 69.6 F
- Avg. rainy days per year: 81 days for an avg of 32.4 inches annually
- Avg. days of over 90F per year: 117 days
- Avg. days below freezing per year: 19 days
- Avg. sunny or partly cloudy days per year: 224 days
33. Athens, Georgia (78.8/100)

- Avg. annual temperature: 63 F
- Avg. rainy days per year: 112 days for an avg of 49.0 inches annually
- Avg. days of over 90F per year: 56 days
- Avg. days below freezing per year: 50 days
- Avg. sunny or partly cloudy days per year: 218 days
32. Greenville-spartanburg, South Carolina (78.8/100)
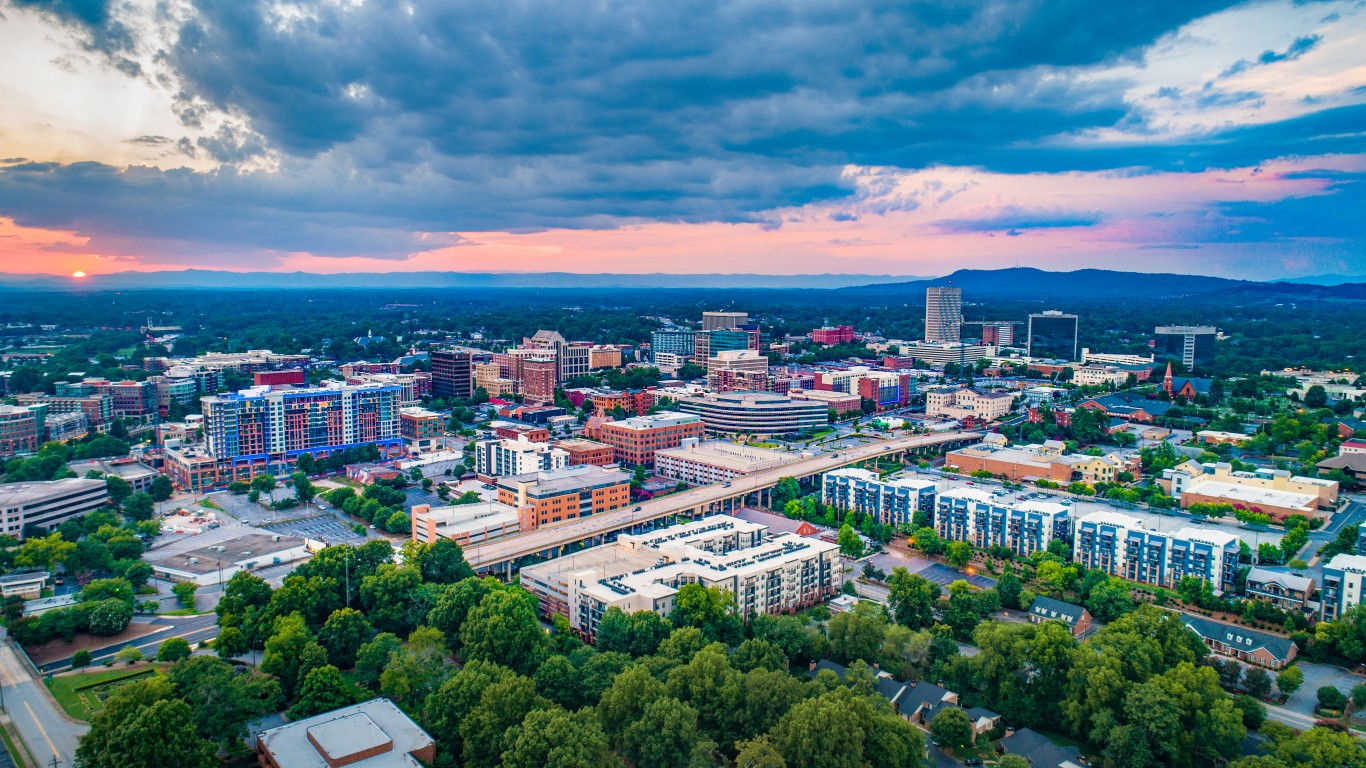
- Avg. annual temperature: 61.3 F
- Avg. rainy days per year: 117 days for an avg of 49.7 inches annually
- Avg. days of over 90F per year: 42 days
- Avg. days below freezing per year: 60 days
- Avg. sunny or partly cloudy days per year: 220 days
31. Miami, Florida (78.8/100)
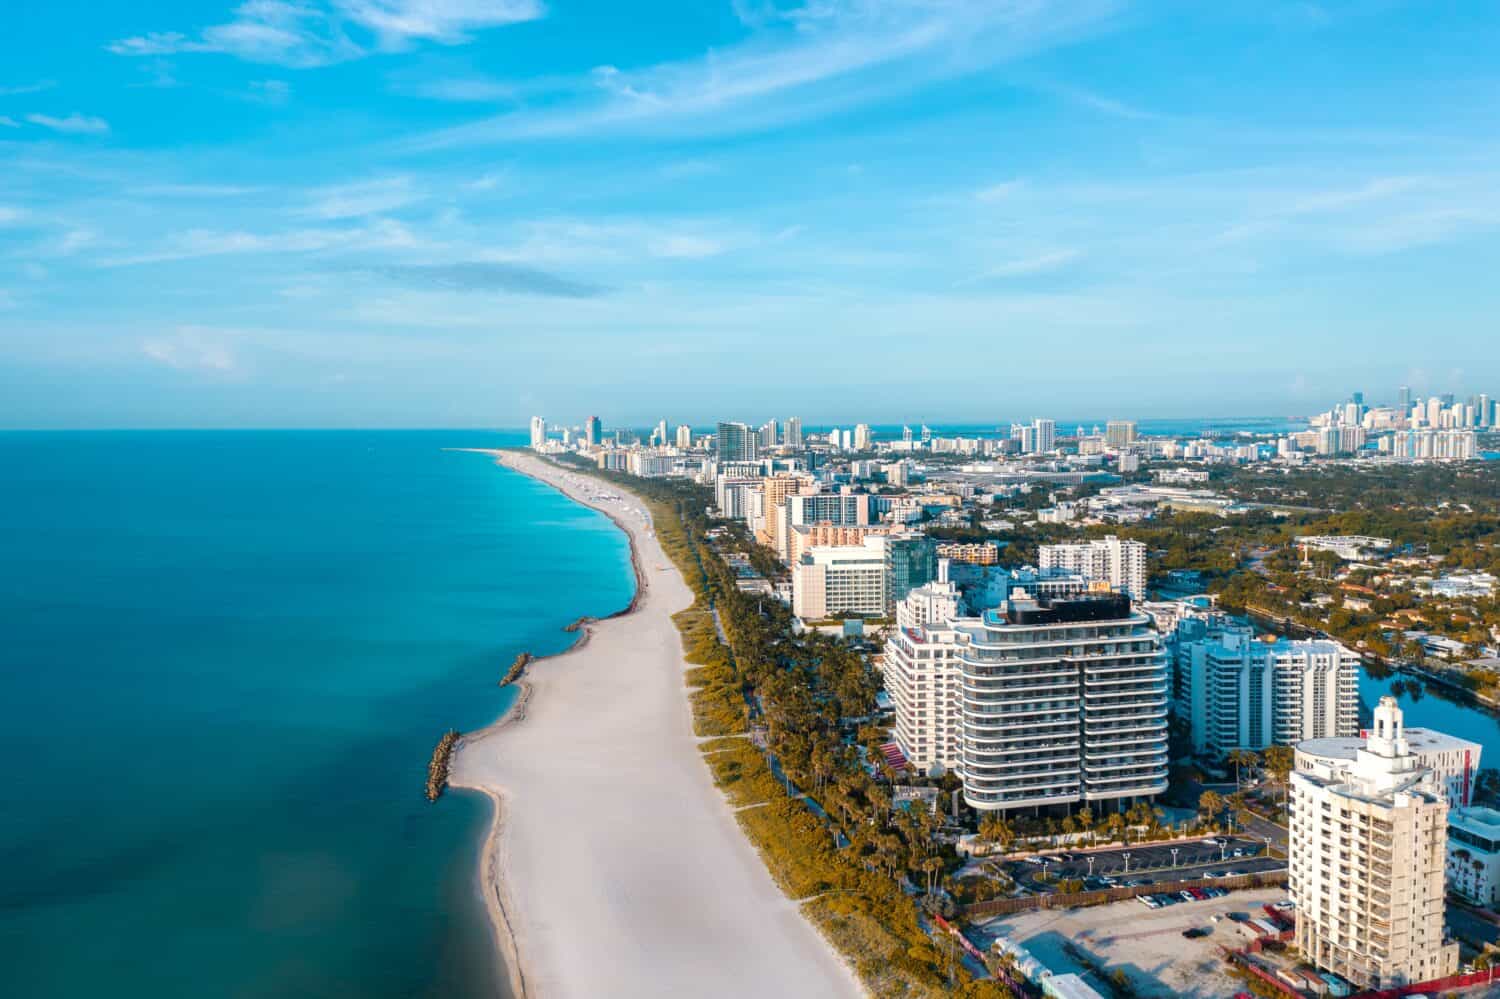
- Avg. annual temperature: 77.5 F
- Avg. rainy days per year: 135 days for an avg of 67.4 inches annually
- Avg. days of over 90F per year: 72 days
- Avg. days below freezing per year: 0 days
- Avg. sunny or partly cloudy days per year: 250 days
30. Columbia, South Carolina (78.9/100)

- Avg. annual temperature: 64.3 F
- Avg. rainy days per year: 109 days for an avg of 45.2 inches annually
- Avg. days of over 90F per year: 79 days
- Avg. days below freezing per year: 53 days
- Avg. sunny or partly cloudy days per year: 218 days
29. El Paso, Texas (79.0/100)

- Avg. annual temperature: 66.2 F
- Avg. rainy days per year: 48 days for an avg of 8.8 inches annually
- Avg. days of over 90F per year: 109 days
- Avg. days below freezing per year: 53 days
- Avg. sunny or partly cloudy days per year: 293 days
28. Augusta, Georgia (79.0/100)

- Avg. annual temperature: 65.4 F
- Avg. rainy days per year: 108 days for an avg of 44.1 inches annually
- Avg. days of over 90F per year: 80 days
- Avg. days below freezing per year: 51 days
- Avg. sunny or partly cloudy days per year: 218 days
27. Columbus, Georgia (79.2/100)

- Avg. annual temperature: 66.6 F
- Avg. rainy days per year: 109 days for an avg of 48.8 inches annually
- Avg. days of over 90F per year: 78 days
- Avg. days below freezing per year: 37 days
- Avg. sunny or partly cloudy days per year: 214 days
26. Atlanta, Georgia (79.2/100)

- Avg. annual temperature: 63.6 F
- Avg. rainy days per year: 115 days for an avg of 50.4 inches annually
- Avg. days of over 90F per year: 44 days
- Avg. days below freezing per year: 42 days
- Avg. sunny or partly cloudy days per year: 216 days
25. Jacksonville, Florida (79.2/100)

- Avg. annual temperature: 69.3 F
- Avg. rainy days per year: 115 days for an avg of 53.4 inches annually
- Avg. days of over 90F per year: 82 days
- Avg. days below freezing per year: 15 days
- Avg. sunny or partly cloudy days per year: 221 days
24. Charlotte, North Carolina (79.2/100)

- Avg. annual temperature: 61.4 F
- Avg. rainy days per year: 112 days for an avg of 43.6 inches annually
- Avg. days of over 90F per year: 47 days
- Avg. days below freezing per year: 62 days
- Avg. sunny or partly cloudy days per year: 213 days
23. Midland-Odessa, Texas (79.2/100)
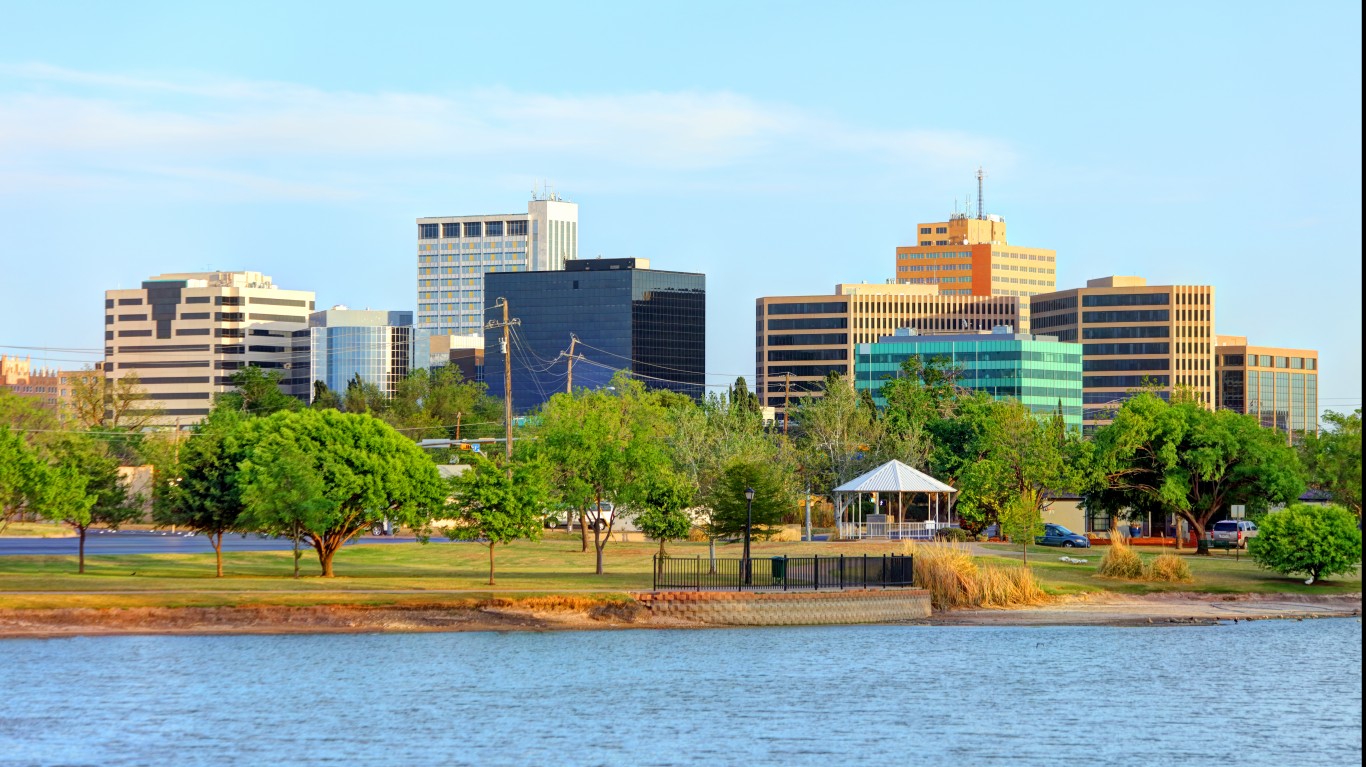
- Avg. annual temperature: 65.8 F
- Avg. rainy days per year: 50 days for an avg of 13.5 inches annually
- Avg. days of over 90F per year: 107 days
- Avg. days below freezing per year: 61 days
- Avg. sunny or partly cloudy days per year: 261 days
22. Dallas, Texas (79.7/100)

- Avg. annual temperature: 68 F
- Avg. rainy days per year: 79 days for an avg of 38.3 inches annually
- Avg. days of over 90F per year: 104 days
- Avg. days below freezing per year: 30 days
- Avg. sunny or partly cloudy days per year: 232 days
21. Orlando, Florida (79.7/100)

- Avg. annual temperature: 73 F
- Avg. rainy days per year: 117 days for an avg of 51.5 inches annually
- Avg. days of over 90F per year: 101 days
- Avg. days below freezing per year: 2 days
- Avg. sunny or partly cloudy days per year: 235 days
20. Austin, Texas (79.8/100)

- Avg. annual temperature: 70 F
- Avg. rainy days per year: 84 days for an avg of 36.3 inches annually
- Avg. days of over 90F per year: 116 days
- Avg. days below freezing per year: 17 days
- Avg. sunny or partly cloudy days per year: 229 days
19. San Francisco, California (79.9/100)

- Avg. annual temperature: 57.7 F
- Avg. rainy days per year: 67 days for an avg of 22.9 inches annually
- Avg. days of over 90F per year: 2 days
- Avg. days below freezing per year: 0 days
- Avg. sunny or partly cloudy days per year: 260 days
18. Fort Myers, Florida (80.5/100)
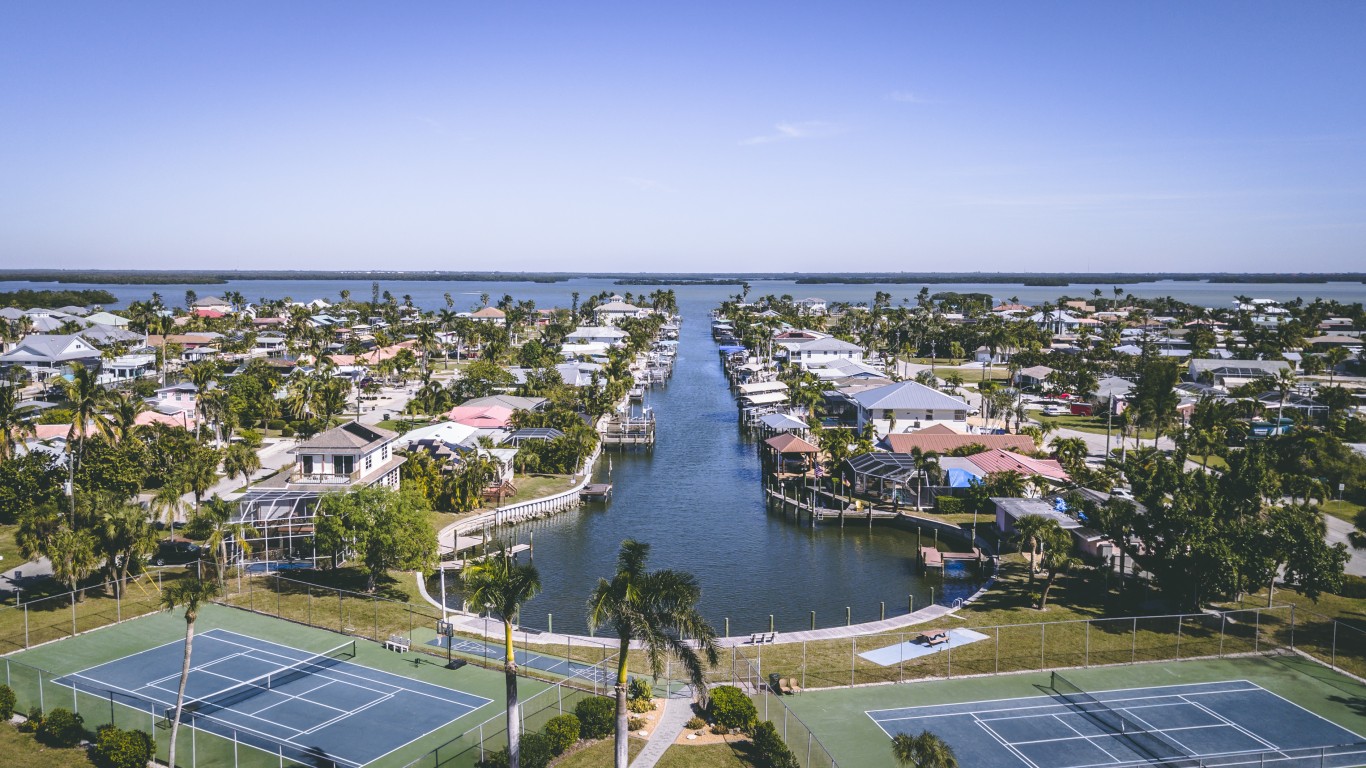
- Avg. annual temperature: 75.4 F
- Avg. rainy days per year: 113 days for an avg of 57.4 inches annually
- Avg. days of over 90F per year: 102 days
- Avg. days below freezing per year: 0 days
- Avg. sunny or partly cloudy days per year: 266 days
17. Lihue, Hawaii (80.6/100)

- Avg. annual temperature: 76.3 F
- Avg. rainy days per year: 197 days for an avg of 36.2 inches annually
- Avg. days of over 90F per year: 0 days
- Avg. days below freezing per year: 0 days
- Avg. sunny or partly cloudy days per year: 240 days
16. Savannah, Georgia (80.9/100)

- Avg. annual temperature: 67.5 F
- Avg. rainy days per year: N/A days for an avg of 48.1 inches annually
- Avg. days of over 90F per year: 73 days
- Avg. days below freezing per year: 26 days
- Avg. sunny or partly cloudy days per year: 213 days
15. Tampa, Florida (81.1/100)
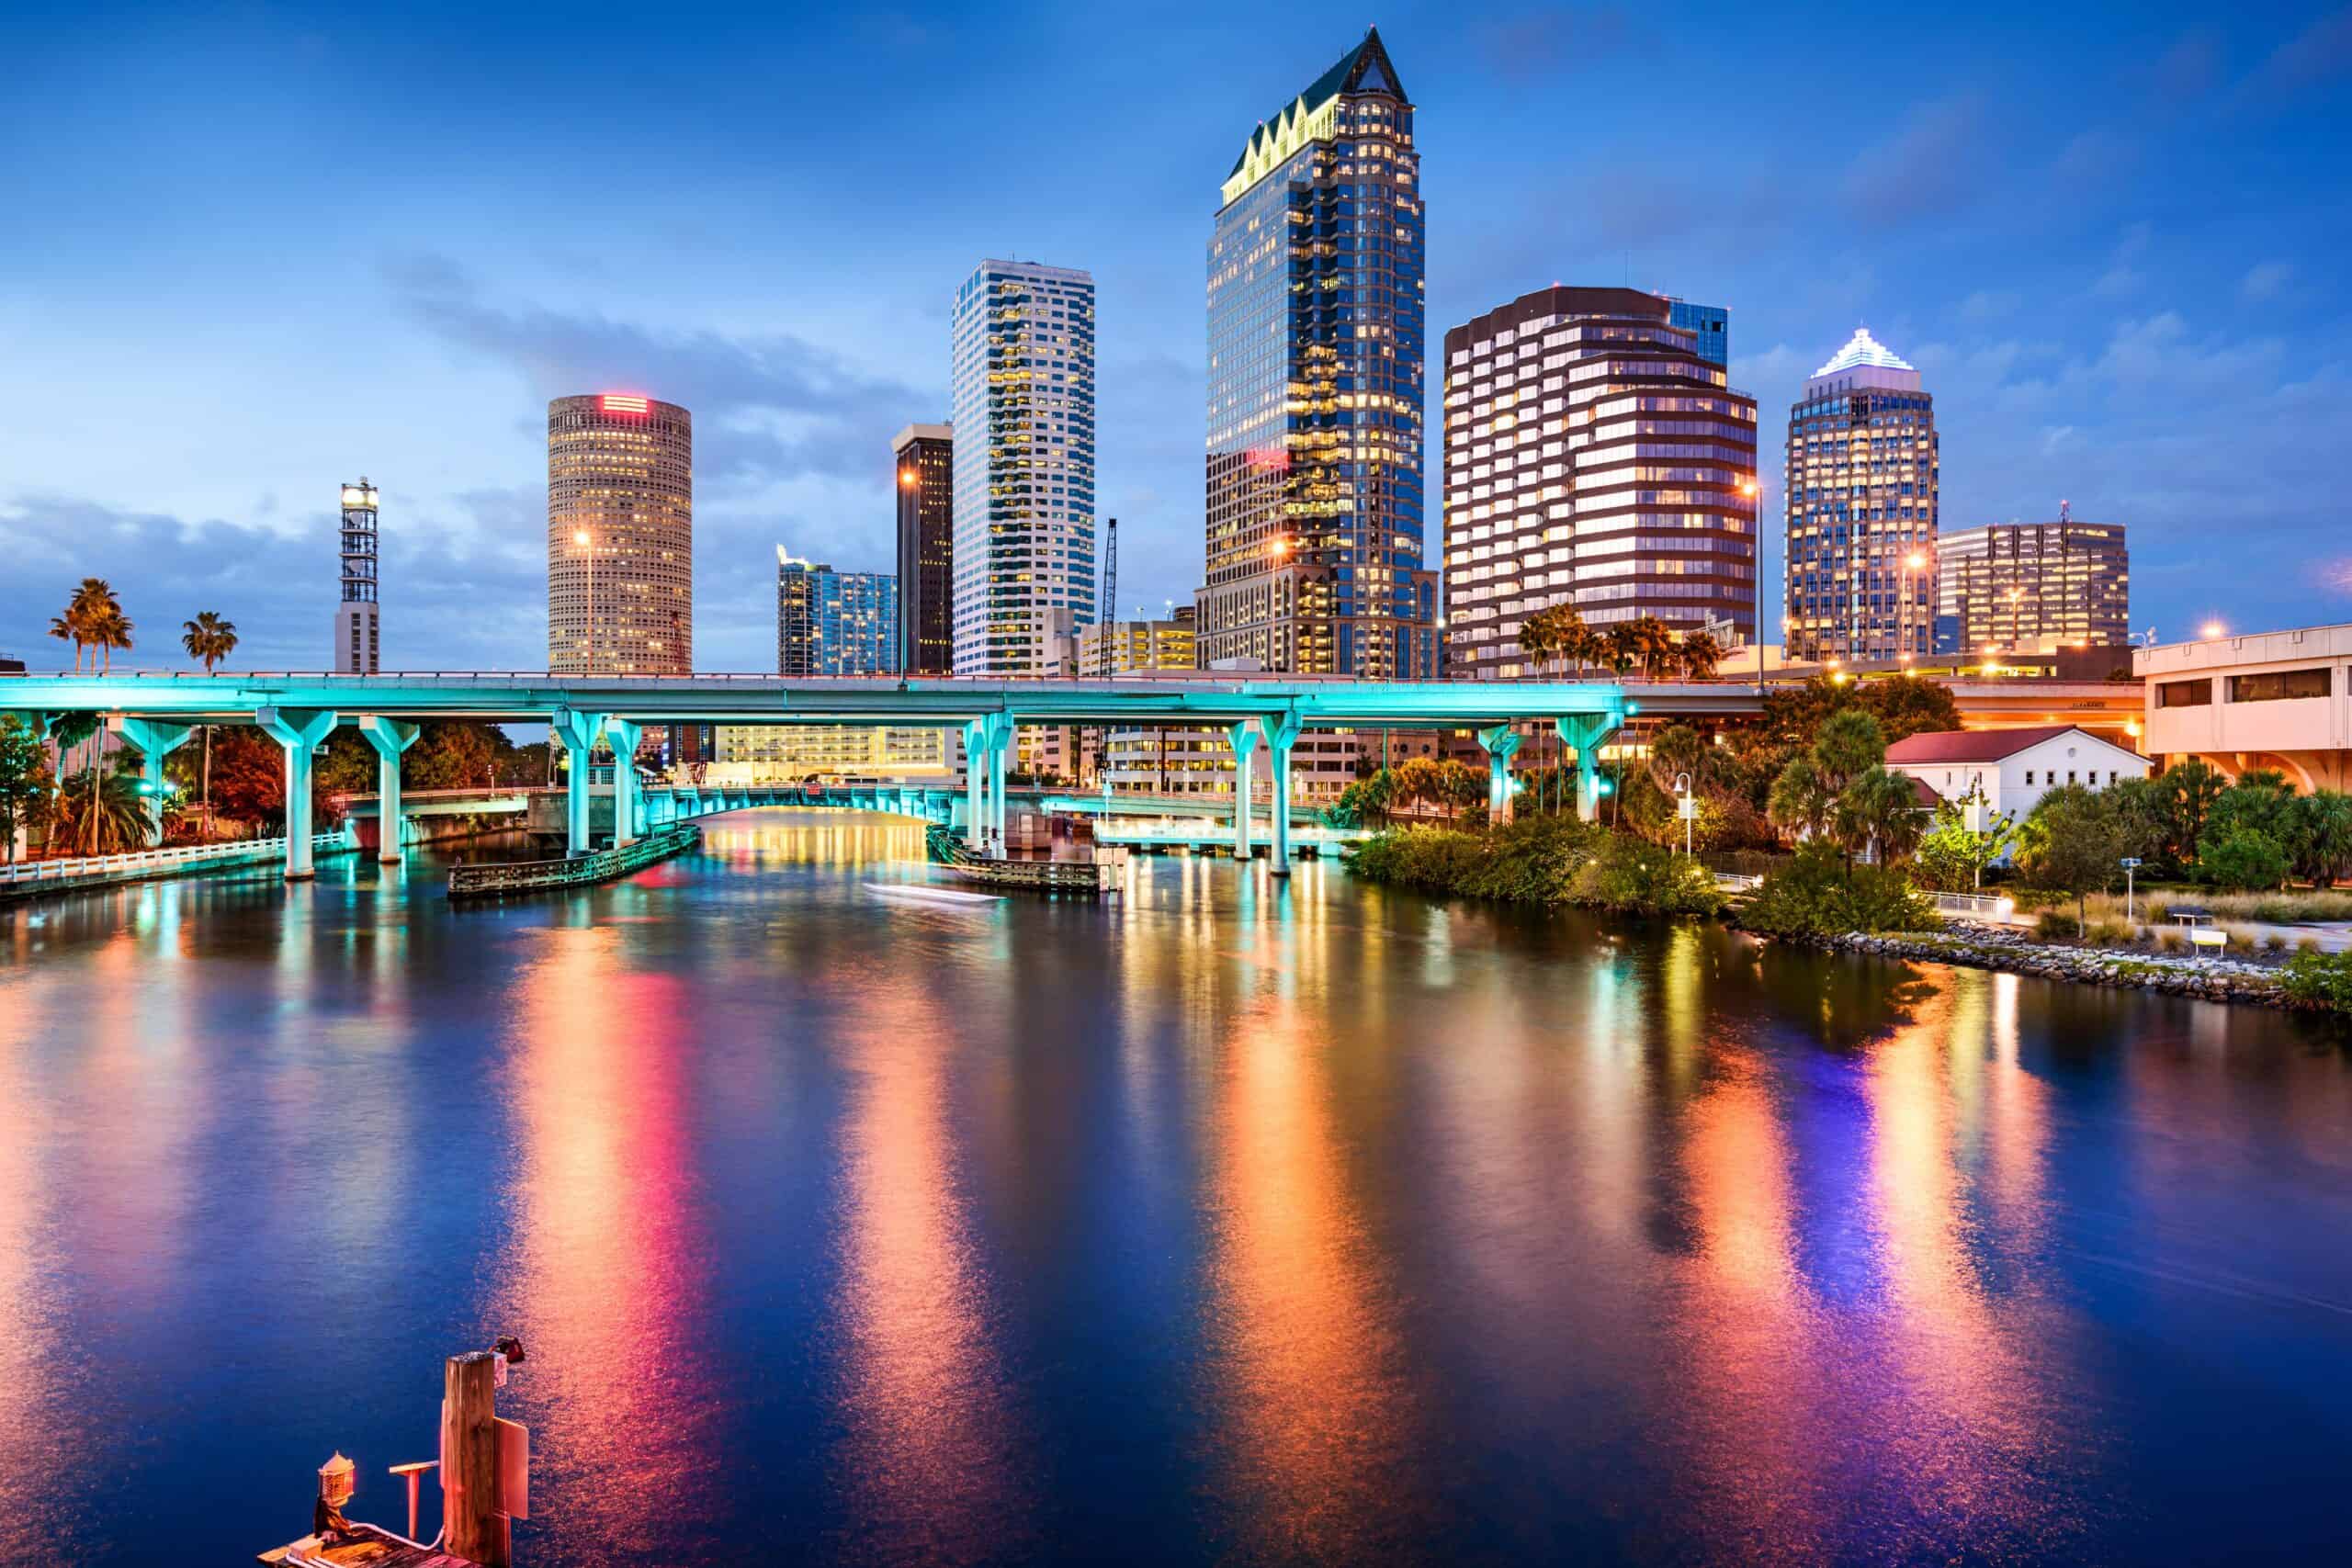
- Avg. annual temperature: 74.5 F
- Avg. rainy days per year: 107 days for an avg of 49.5 inches annually
- Avg. days of over 90F per year: 89 days
- Avg. days below freezing per year: 2 days
- Avg. sunny or partly cloudy days per year: 244 days
14. Stockton, California (81.1/100)
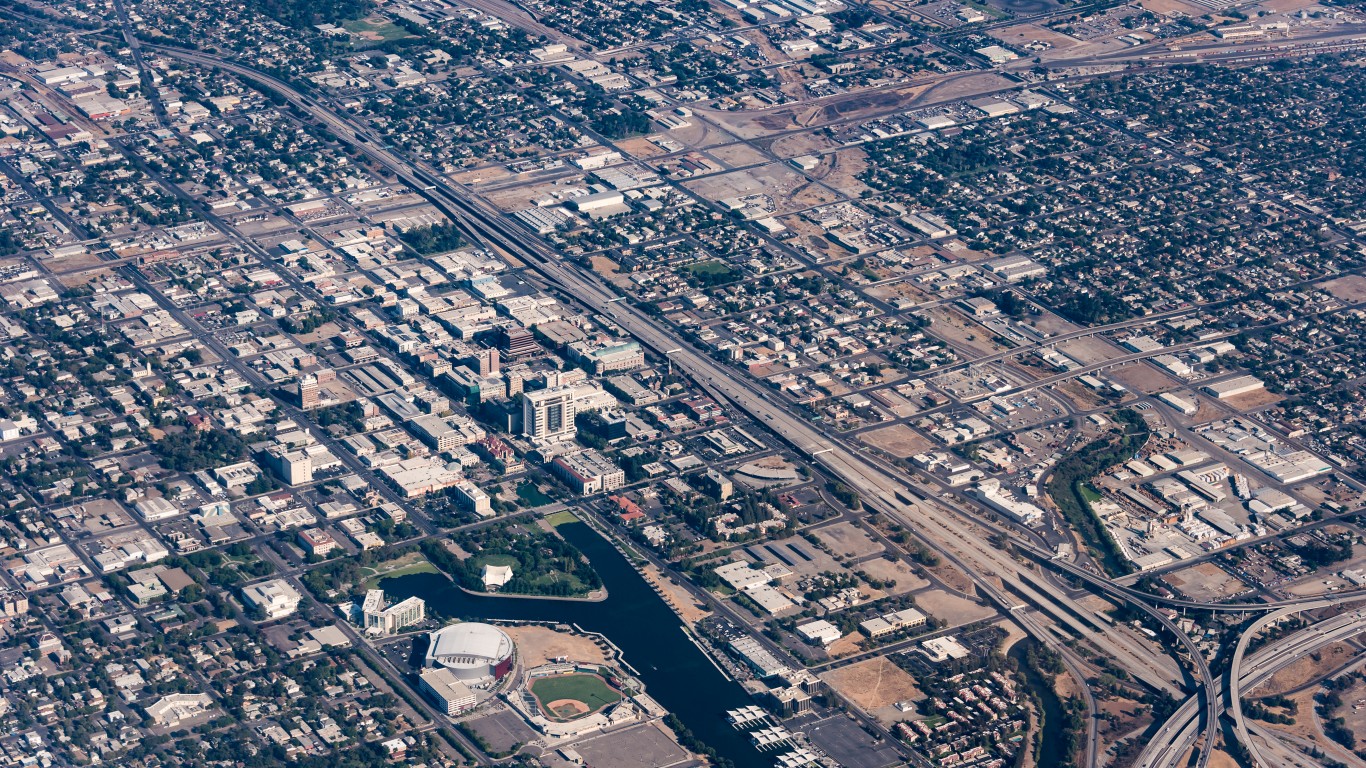
- Avg. annual temperature: 63 F
- Avg. rainy days per year: 54 days for an avg of 13.5 inches annually
- Avg. days of over 90F per year: 84 days
- Avg. days below freezing per year: 22 days
- Avg. sunny or partly cloudy days per year: 261 days
13. Daytona Beach, Florida (81.2/100)
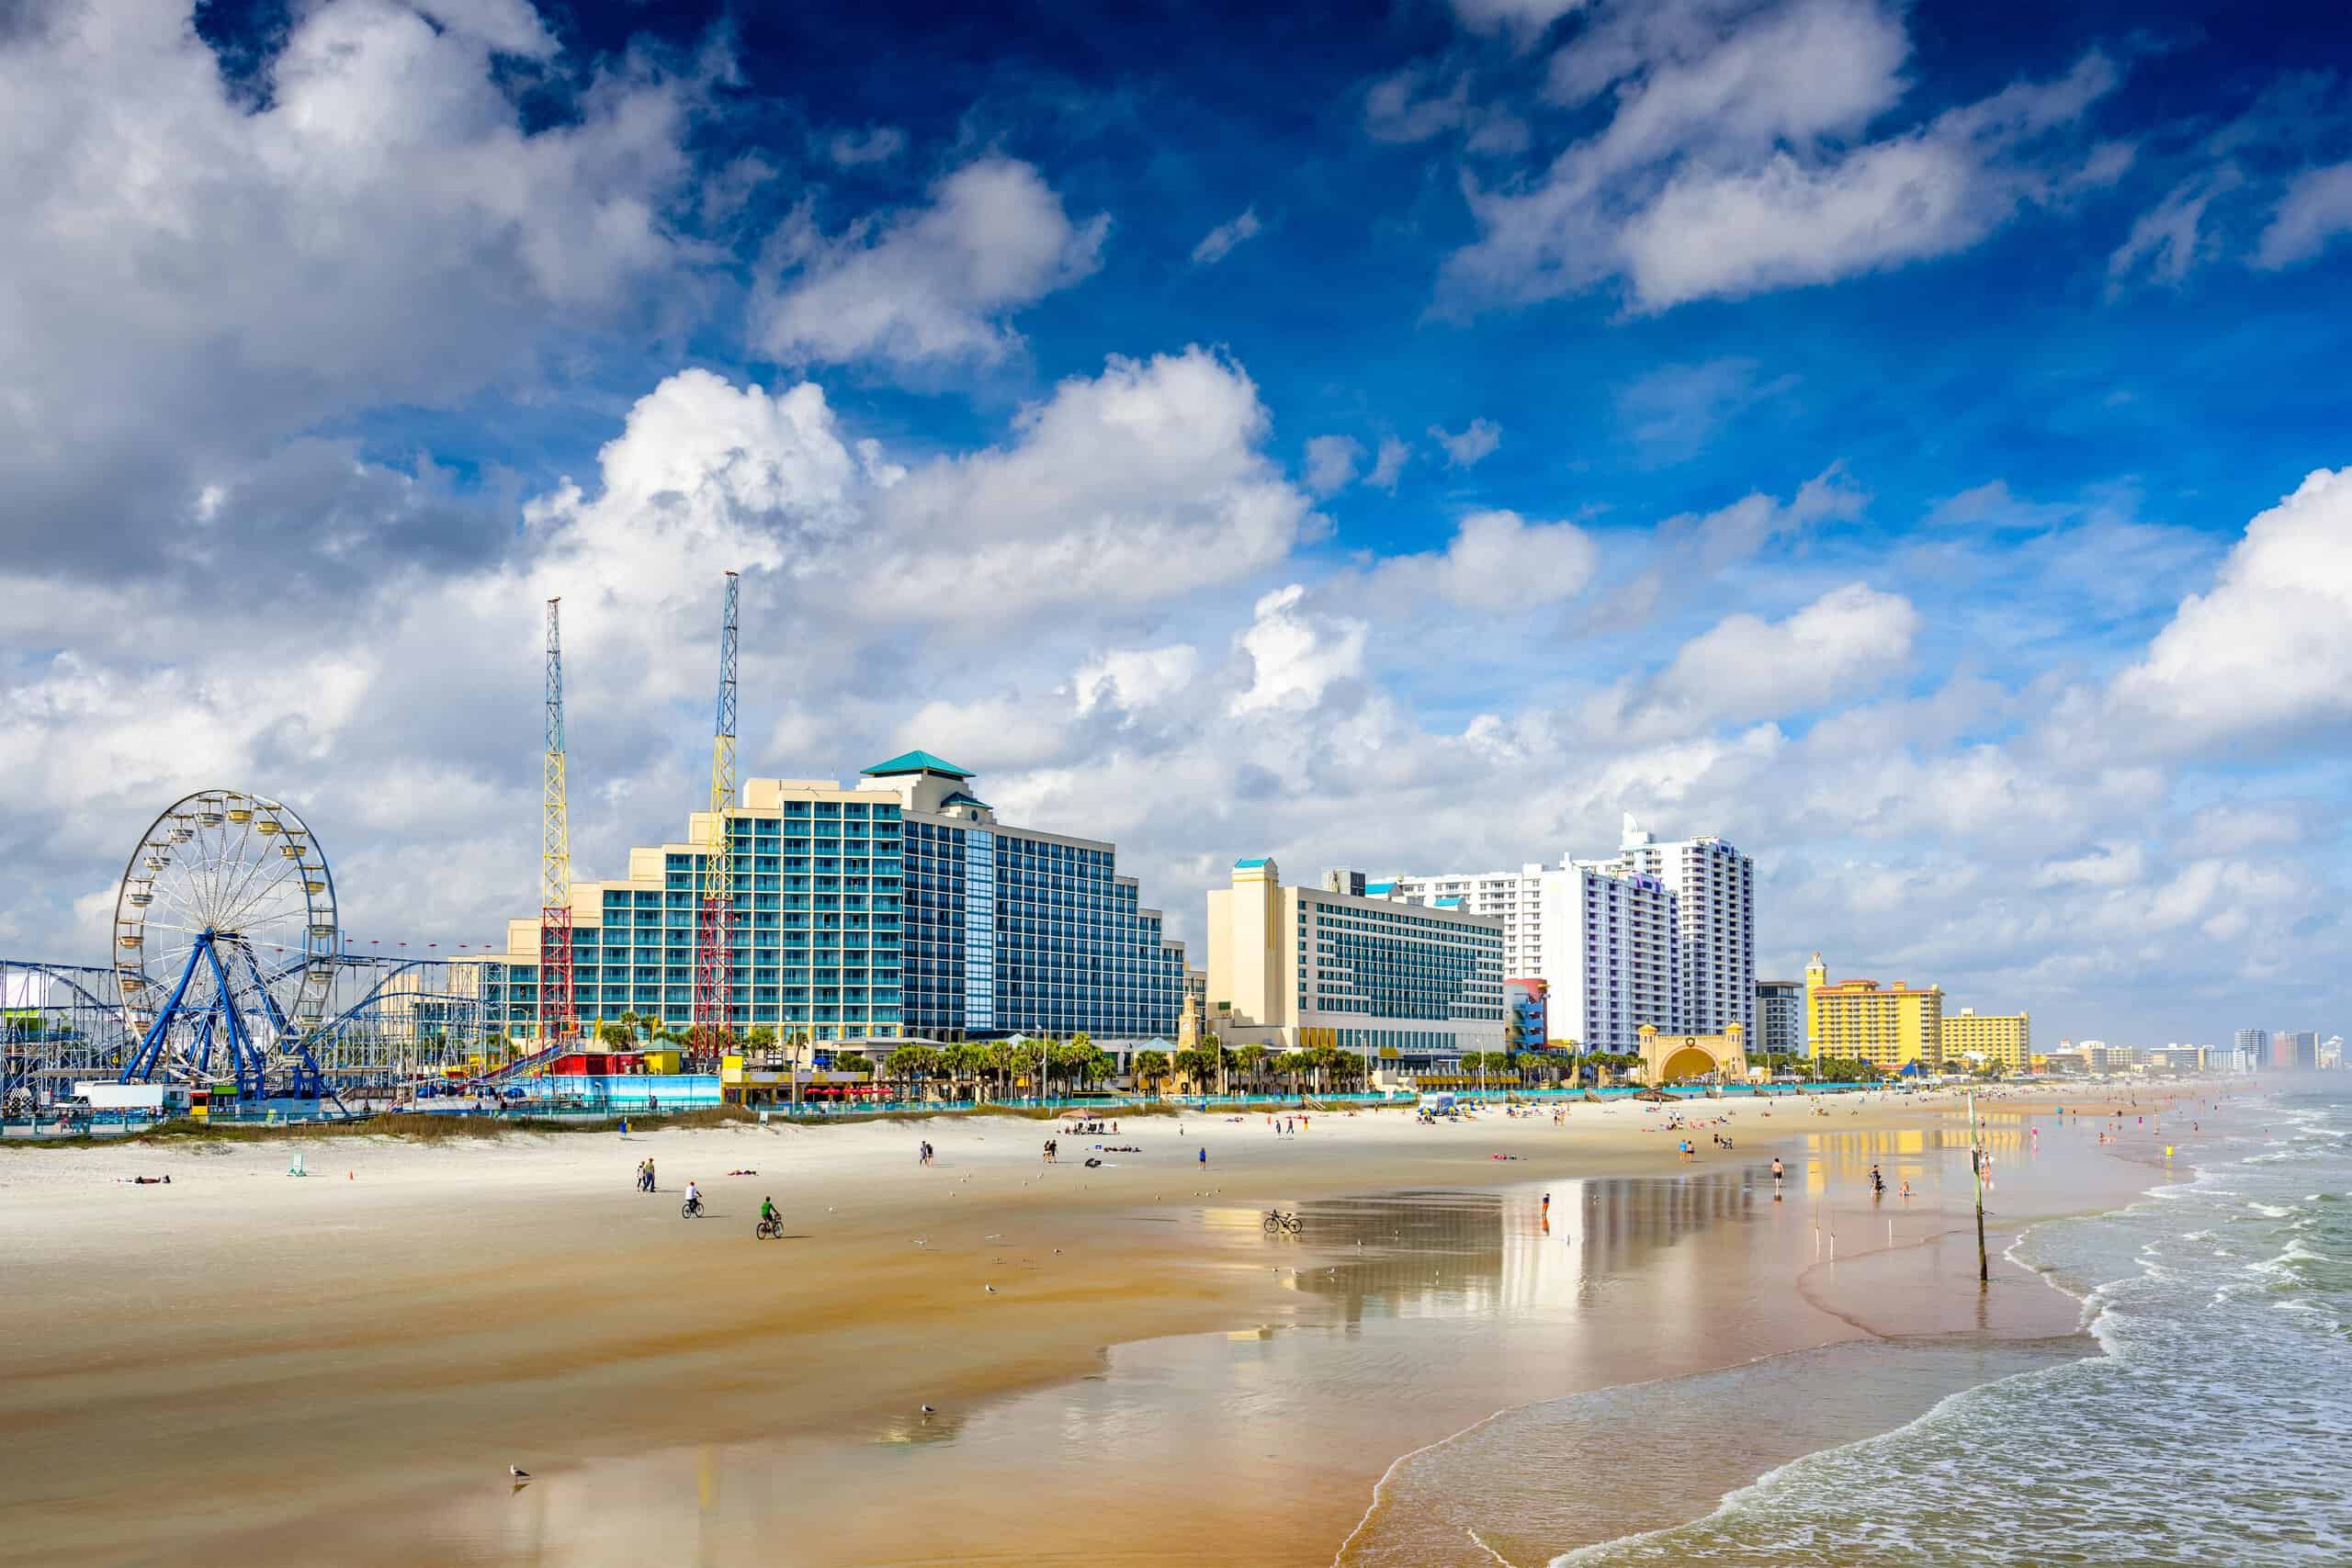
- Avg. annual temperature: 71.5 F
- Avg. rainy days per year: 116 days for an avg of 51.3 inches annually
- Avg. days of over 90F per year: 60 days
- Avg. days below freezing per year: 5 days
- Avg. sunny or partly cloudy days per year: 229 days
12. Redding, California (81.3/100)

- Avg. annual temperature: 63.4 F
- Avg. rainy days per year: 79 days for an avg of 33.5 inches annually
- Avg. days of over 90F per year: 106 days
- Avg. days below freezing per year: 29 days
- Avg. sunny or partly cloudy days per year: 249 days
11. Key West, Florida (81.7/100)

- Avg. annual temperature: 78.9 F
- Avg. rainy days per year: 107 days for an avg of 40.4 inches annually
- Avg. days of over 90F per year: 50 days
- Avg. days below freezing per year: 0 days
- Avg. sunny or partly cloudy days per year: 258 days
10. Bakersfield, California (82.5/100)

- Avg. annual temperature: 66.2 F
- Avg. rainy days per year: 37 days for an avg of 6.4 inches annually
- Avg. days of over 90F per year: 110 days
- Avg. days below freezing per year: 12 days
- Avg. sunny or partly cloudy days per year: 272 days
9. Sacramento, California (82.6/100)

- Avg. annual temperature: 61.8 F
- Avg. rainy days per year: 57 days for an avg of 18.1 inches annually
- Avg. days of over 90F per year: 75 days
- Avg. days below freezing per year: 17 days
- Avg. sunny or partly cloudy days per year: 265 days
8. Santa Maria, California (82.7/100)
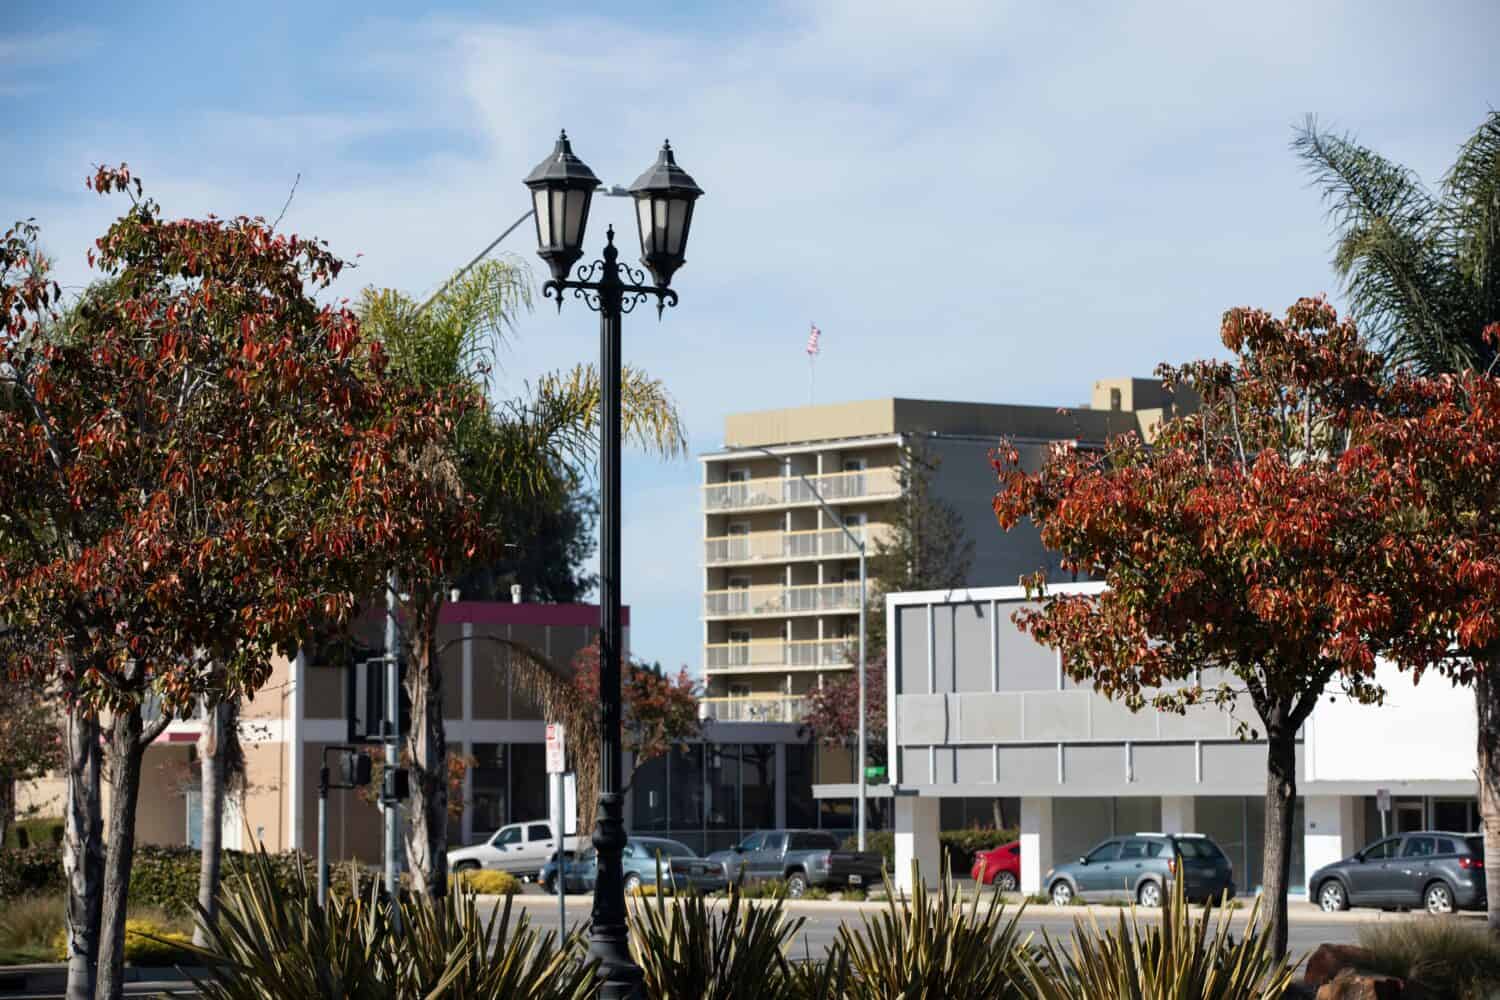
- Avg. annual temperature: 58.6 F
- Avg. rainy days per year: 46 days for an avg of 13.3 inches annually
- Avg. days of over 90F per year: 5 days
- Avg. days below freezing per year: 15 days
- Avg. sunny or partly cloudy days per year: 285 days
7. Fresno, California (82.7/100)
- Avg. annual temperature: 65 F
- Avg. rainy days per year: 45 days for an avg of 11.0 inches annually
- Avg. days of over 90F per year: 109 days
- Avg. days below freezing per year: 18 days
- Avg. sunny or partly cloudy days per year: 267 days
6. Kahului, Hawaii (83.0/100)
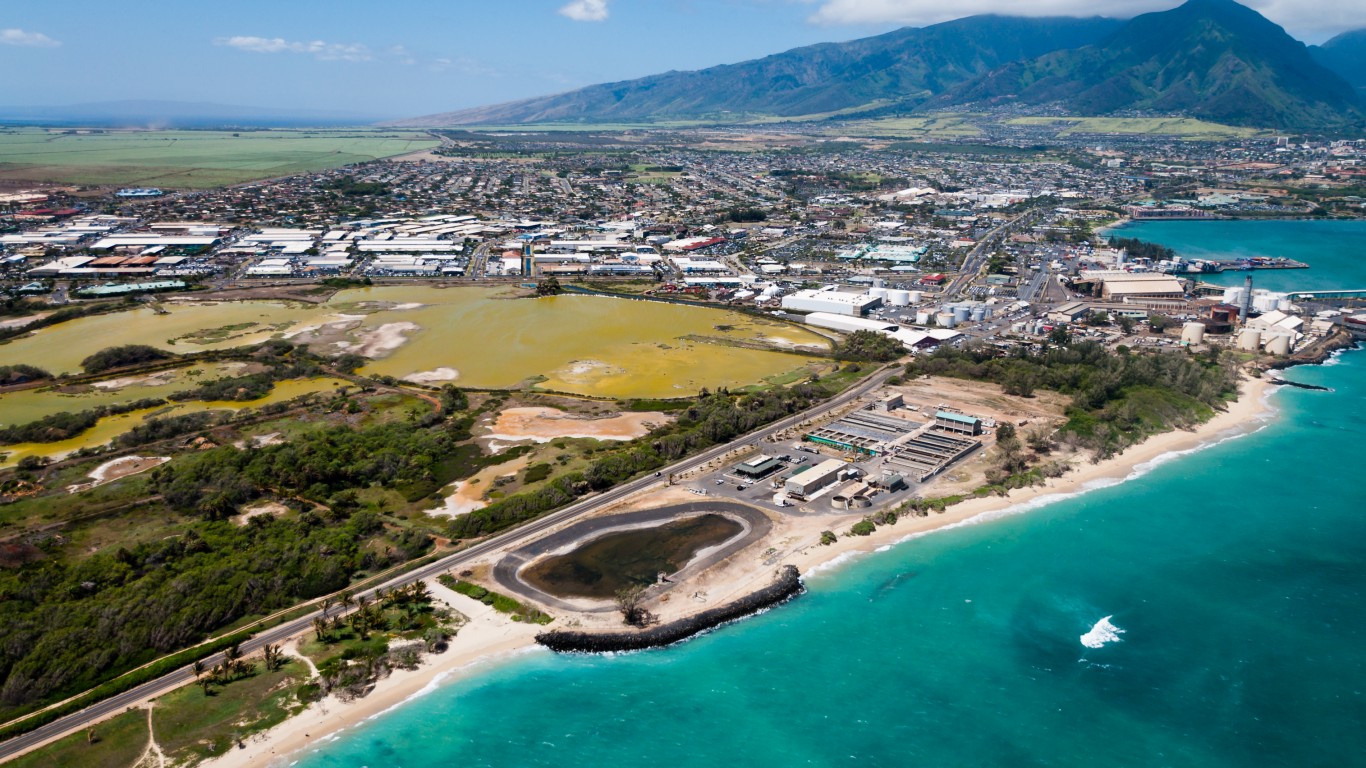
- Avg. annual temperature: 77.1 F
- Avg. rainy days per year: 88 days for an avg of 16.2 inches annually
- Avg. days of over 90F per year: 29 days
- Avg. days below freezing per year: 0 days
- Avg. sunny or partly cloudy days per year: 275 days
5. Honolulu, Hawaii (84.6/100)

- Avg. annual temperature: 78 F
- Avg. rainy days per year: 92 days for an avg of 16.4 inches annually
- Avg. days of over 90F per year: 25 days
- Avg. days below freezing per year: 0 days
- Avg. sunny or partly cloudy days per year: 271 days
4. Charleston, South Carolina (85.5/100)
- Avg. annual temperature: 67.2 F
- Avg. rainy days per year: 107 days for an avg of 44.3 inches annually
- Avg. days of over 90F per year: 30 days
- Avg. days below freezing per year: 10 days
- Avg. sunny or partly cloudy days per year: 210 days
3. San Diego, California (85.8/100)

- Avg. annual temperature: 64.7 F
- Avg. rainy days per year: 41 days for an avg of 9.8 inches annually
- Avg. days of over 90F per year: 3 days
- Avg. days below freezing per year: 0 days
- Avg. sunny or partly cloudy days per year: 263 days
2. Los Angeles, California (87.2/100)

- Avg. annual temperature: 65.8 F
- Avg. rainy days per year: N/A days for an avg of 14.3 inches annually
- Avg. days of over 90F per year: 21 days
- Avg. days below freezing per year: 0 days
- Avg. sunny or partly cloudy days per year: 262 days
1. Long Beach, California (87.3/100)

- Avg. annual temperature: 64.9 F
- Avg. rainy days per year: 34 days for an avg of 12.0 inches annually
- Avg. days of over 90F per year: 22 days
- Avg. days below freezing per year: 0 days
- Avg. sunny or partly cloudy days per year: 278 days
It’s Your Money, Your Future—Own It (sponsor)
Retirement can be daunting, but it doesn’t need to be.
Imagine having an expert in your corner to help you with your financial goals. Someone to help you determine if you’re ahead, behind, or right on track. With SmartAsset, that’s not just a dream—it’s reality. This free tool connects you with pre-screened financial advisors who work in your best interests. It’s quick, it’s easy, so take the leap today and start planning smarter!
Don’t waste another minute; get started right here and help your retirement dreams become a retirement reality.
Thank you for reading! Have some feedback for us?
Contact the 24/7 Wall St. editorial team.
