The early July heat wave that has gripped the West has spread throughout the nation. Sure, it’s summer, and it’s hot in summer, but the intensity, duration, and geographic spread of the heat wave has smashed some all-time records. Records have been set in California, Nevada and Oregon, according to the Weather Channel.
In Las Vegas, the temperature in the city’s airport was 120 degrees Fahrenheit on July 7, 3 degrees above the all-time record for Sin City of 117 degrees, set in 1942 and tied in 2005, 2013, 2017 and 2021. Moreover, temperatures have reached highs of at least 115 degrees for a six day record.
In Texas, tens of millions of people were under a heat advisory on Thursday even as 1.3 million people in the state ramined without power. As a result, Houston opened more than 100 cooling centers as temperatures reached 105F, and hospitals in the area were filling up as they cannot be discharge patients to homes without electricity.
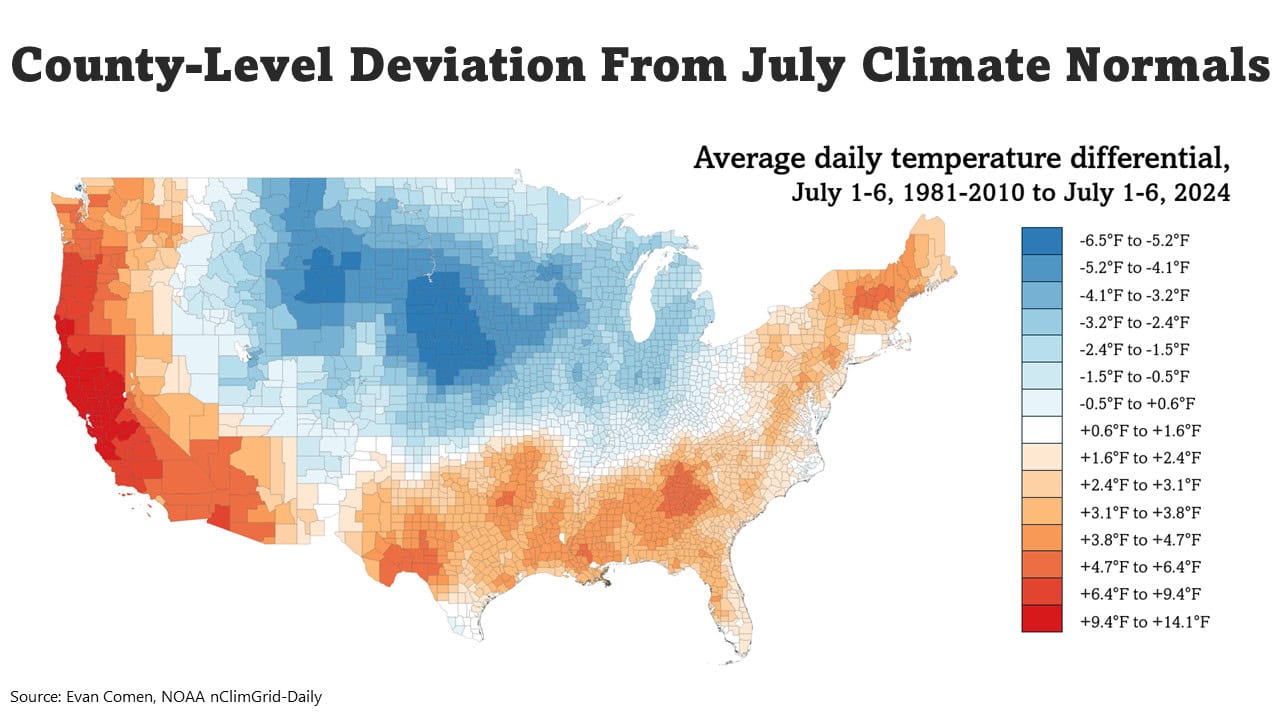
To determine the cities experiencing the worst heat waves right now, 24/7 Wall St. reviewed county-level data on daily average temperature from the NOAA’s nClimGrid-Daily program. County seats were ranked based on the raw differential in average daily temperature from the period July 1-6, 1981-2010 to July-16, 2024. Only county seats with at least 10,000 residents were considered. Data on population is from the U.S. Census Bureau’s 2022 American Community Survey.
It is important to emphasize that our list only considers the deviation from normal temperatures — how much hotter current temperatures are compared to historic normals (rather than how high the temperatures are). Also, the list only considers the week of 1-6 July, and some records have been broken since.
So, for example, in Houston, which is not on the list, average temperatures during that week reached 86.4F, but that was “only” 3.4 degrees above the normal of 83.0F. Meanwhile, in the cities on the list, the deviation in temperatures from the normals begins at 7.2 degrees and goes up from there, but that doesn’t mean temperatures are necessarily high.
The list starts with McMinnville, Oregon (Yamhill County) where the difference was 7.2 degrees in the first week of July and ends with Santa Rosa, California (Sonoma County) where the differential was nearly double at 14.1 degrees. But while in Houston average normal July temperatures are well over 80F, in McMinnville, the normal for that week is a cool 62.7F, and in Santa Rosa the normal is only a slightly warmer 66F — so it is really about the deviation from the normal. (Also see, The US Cities With the Absolute Best Weather, According to Data.)
Of the 50 cities on the list, 10 are in Oregon and 40 in California. Most of the Oregon cities have quite cool temperatures in the July week in question, the coolest being Tillamook, with a normal temperature of 58.2F. While temperatures in the city reached only 66F during the first week of July 2024, they were nearly 8 degrees warmer than usual. The city on the list that had the highest temperature the past week is Yuba City, California, where temperatures reached an average of 88.5F compared to a normal of 78.1F, or 10.4 degrees hotter.
Why this matters

50. McMinnville, OR (Yamhill County)

- Avg. temperature, July 1-6, 2024: 69.9°F (+7.2°F hotter than normal)
- Avg. temperature, July 1-6, 1981-2010: 62.7°F
- Total population: 34,432
49. Albany, OR (Linn County)

- Avg. temperature, July 1-6, 2024: 68.2°F (+7.3°F hotter than normal)
- Avg. temperature, July 1-6, 1981-2010: 60.9°F
- Total population: 56,348
48. Bakersfield, CA (Kern County)

- Avg. temperature, July 1-6, 2024: 86.5°F (+7.4°F hotter than normal)
- Avg. temperature, July 1-6, 1981-2010: 79.2°F
- Total population: 404,321
47. Corvallis, OR (Benton County)

- Avg. temperature, July 1-6, 2024: 70.8°F (+7.6°F hotter than normal)
- Avg. temperature, July 1-6, 1981-2010: 63.3°F
- Total population: 60,050
46. Dallas, OR (Polk County)
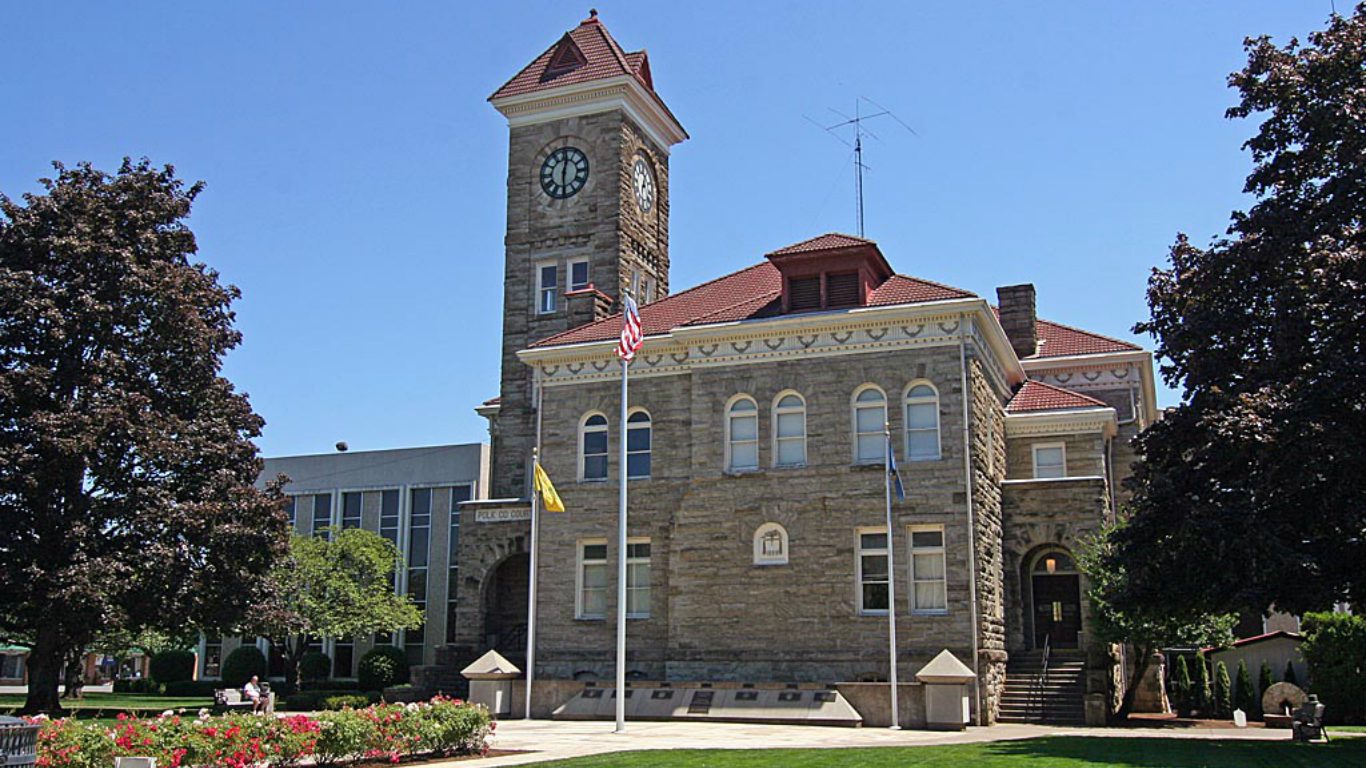
- Avg. temperature, July 1-6, 2024: 70.1°F (+7.6°F hotter than normal)
- Avg. temperature, July 1-6, 1981-2010: 62.6°F
- Total population: 16,945
45. Newport, OR (Lincoln County)

- Avg. temperature, July 1-6, 2024: 67.1°F (+7.6°F hotter than normal)
- Avg. temperature, July 1-6, 1981-2010: 59.5°F
- Total population: 10,319
44. Eugene, OR (Lane County)

- Avg. temperature, July 1-6, 2024: 68.9°F (+7.8°F hotter than normal)
- Avg. temperature, July 1-6, 1981-2010: 61.1°F
- Total population: 176,755
43. Susanville, CA (Lassen County)

- Avg. temperature, July 1-6, 2024: 72.0°F (+7.8°F hotter than normal)
- Avg. temperature, July 1-6, 1981-2010: 64.2°F
- Total population: 15,737
42. Tillamook, OR (Tillamook County)

- Avg. temperature, July 1-6, 2024: 66.0°F (+7.9°F hotter than normal)
- Avg. temperature, July 1-6, 1981-2010: 58.2°F
- Total population: 5,215
41. Hanford, CA (Kings County)

- Avg. temperature, July 1-6, 2024: 88.0°F (+8.1°F hotter than normal)
- Avg. temperature, July 1-6, 1981-2010: 79.9°F
- Total population: 57,920
40. Medford, OR (Jackson County)

- Avg. temperature, July 1-6, 2024: 72.6°F (+8.1°F hotter than normal)
- Avg. temperature, July 1-6, 1981-2010: 64.4°F
- Total population: 85,539
39. Ventura, CA (Ventura County)
 by Ken Lund")
- Avg. temperature, July 1-6, 2024: 77.1°F (+8.2°F hotter than normal)
- Avg. temperature, July 1-6, 1981-2010: 68.9°F
- Total population: 110,358
38. Roseburg, OR (Douglas County)

- Avg. temperature, July 1-6, 2024: 70.9°F (+8.4°F hotter than normal)
- Avg. temperature, July 1-6, 1981-2010: 62.6°F
- Total population: 23,657
37. San Luis Obispo, CA (San Luis Obispo County)

- Avg. temperature, July 1-6, 2024: 79.5°F (+8.6°F hotter than normal)
- Avg. temperature, July 1-6, 1981-2010: 71.0°F
- Total population: 47,529
36. Visalia, CA (Tulare County)

- Avg. temperature, July 1-6, 2024: 79.9°F (+8.7°F hotter than normal)
- Avg. temperature, July 1-6, 1981-2010: 71.2°F
- Total population: 141,466
35. Fresno, CA (Fresno County)

- Avg. temperature, July 1-6, 2024: 80.8°F (+9.0°F hotter than normal)
- Avg. temperature, July 1-6, 1981-2010: 71.7°F
- Total population: 541,528
34. Yreka, CA (Siskiyou County)

- Avg. temperature, July 1-6, 2024: 73.1°F (+9.1°F hotter than normal)
- Avg. temperature, July 1-6, 1981-2010: 64.0°F
- Total population: 7,833
33. San Francisco, CA (San Francisco County)

- Avg. temperature, July 1-6, 2024: 71.4°F (+9.4°F hotter than normal)
- Avg. temperature, July 1-6, 1981-2010: 62.0°F
- Total population: 851,036
32. Placerville, CA (El Dorado County)

- Avg. temperature, July 1-6, 2024: 78.7°F (+9.6°F hotter than normal)
- Avg. temperature, July 1-6, 1981-2010: 69.1°F
- Total population: 10,744
31. Madera, CA (Madera County)

- Avg. temperature, July 1-6, 2024: 81.9°F (+9.6°F hotter than normal)
- Avg. temperature, July 1-6, 1981-2010: 72.3°F
- Total population: 66,784
30. Merced, CA (Merced County)

- Avg. temperature, July 1-6, 2024: 87.1°F (+10.0°F hotter than normal)
- Avg. temperature, July 1-6, 1981-2010: 77.1°F
- Total population: 87,686
29. Auburn, CA (Placer County)

- Avg. temperature, July 1-6, 2024: 78.9°F (+10.0°F hotter than normal)
- Avg. temperature, July 1-6, 1981-2010: 68.8°F
- Total population: 13,773
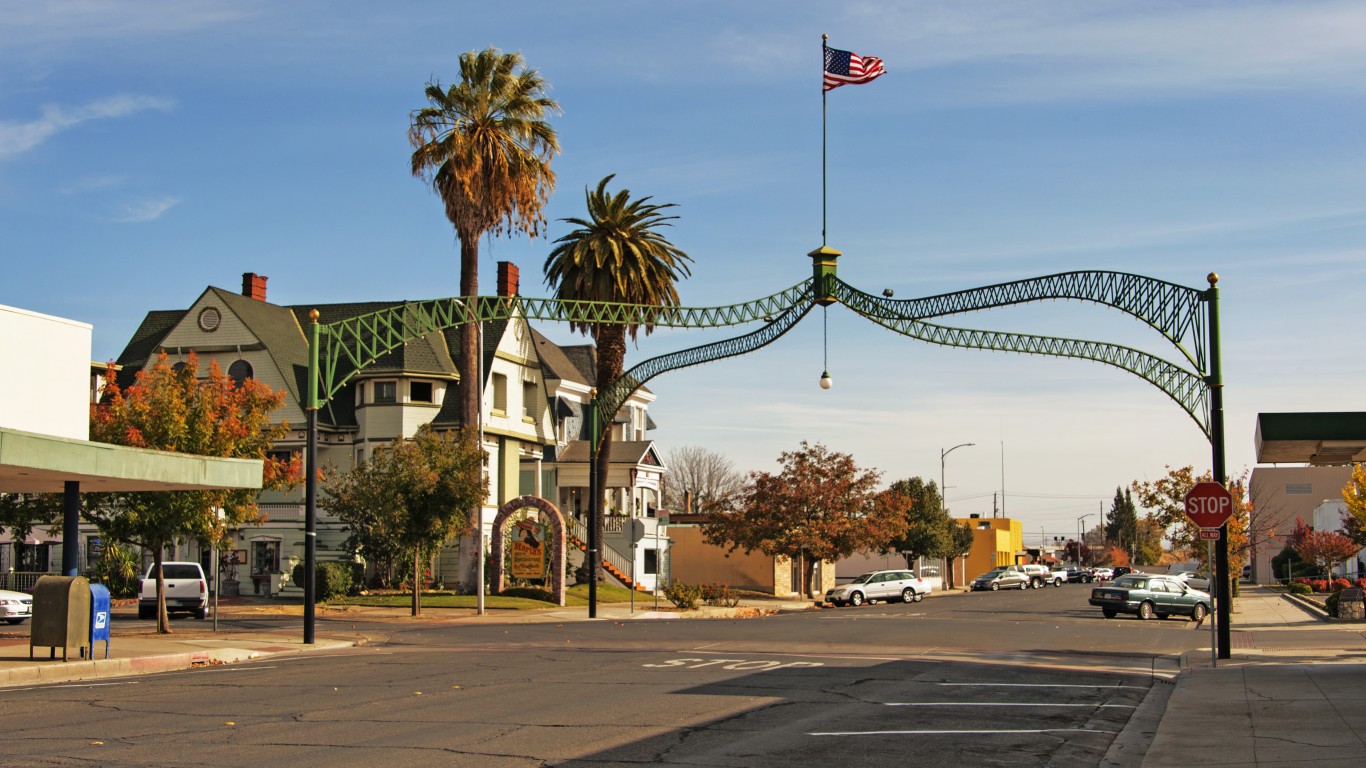
28. Yuba City, CA (Sutter County)

- Avg. temperature, July 1-6, 2024: 88.5°F (+10.4°F hotter than normal)
- Avg. temperature, July 1-6, 1981-2010: 78.1°F
- Total population: 69,535
27. Redding, CA (Shasta County)

- Avg. temperature, July 1-6, 2024: 81.9°F (+10.6°F hotter than normal)
- Avg. temperature, July 1-6, 1981-2010: 71.3°F
- Total population: 93,327
26. Santa Cruz, CA (Santa Cruz County)

- Avg. temperature, July 1-6, 2024: 74.8°F (+10.6°F hotter than normal)
- Avg. temperature, July 1-6, 1981-2010: 64.2°F
- Total population: 61,367
25. Grants Pass, OR (Josephine County)

- Avg. temperature, July 1-6, 2024: 74.3°F (+10.6°F hotter than normal)
- Avg. temperature, July 1-6, 1981-2010: 63.6°F
- Total population: 39,131
24. Marysville, CA (Yuba County)
- Avg. temperature, July 1-6, 2024: 87.0°F (+10.8°F hotter than normal)
- Avg. temperature, July 1-6, 1981-2010: 76.1°F
- Total population: 12,681
23. Jackson, CA (Amador County)

- Avg. temperature, July 1-6, 2024: 83.7°F (+10.8°F hotter than normal)
- Avg. temperature, July 1-6, 1981-2010: 72.8°F
- Total population: 5,004
22. Redwood City, CA (San Mateo County)

- Avg. temperature, July 1-6, 2024: 73.9°F (+10.9°F hotter than normal)
- Avg. temperature, July 1-6, 1981-2010: 63.0°F
- Total population: 83,077
21. Red Bluff, CA (Tehama County)

- Avg. temperature, July 1-6, 2024: 85.7°F (+10.9°F hotter than normal)
- Avg. temperature, July 1-6, 1981-2010: 74.8°F
- Total population: 14,576
20. Colusa, CA (Colusa County)

- Avg. temperature, July 1-6, 2024: 87.7°F (+10.9°F hotter than normal)
- Avg. temperature, July 1-6, 1981-2010: 76.8°F
- Total population: 6,380
19. Oakland, CA (Alameda County)

- Avg. temperature, July 1-6, 2024: 80.8°F (+11.0°F hotter than normal)
- Avg. temperature, July 1-6, 1981-2010: 69.8°F
- Total population: 437,825
18. Woodland, CA (Yolo County)

- Avg. temperature, July 1-6, 2024: 87.5°F (+11.1°F hotter than normal)
- Avg. temperature, July 1-6, 1981-2010: 76.5°F
- Total population: 61,227
17. Modesto, CA (Stanislaus County)

- Avg. temperature, July 1-6, 2024: 87.1°F (+11.1°F hotter than normal)
- Avg. temperature, July 1-6, 1981-2010: 76.0°F
- Total population: 218,308
16. Salinas, CA (Monterey County)
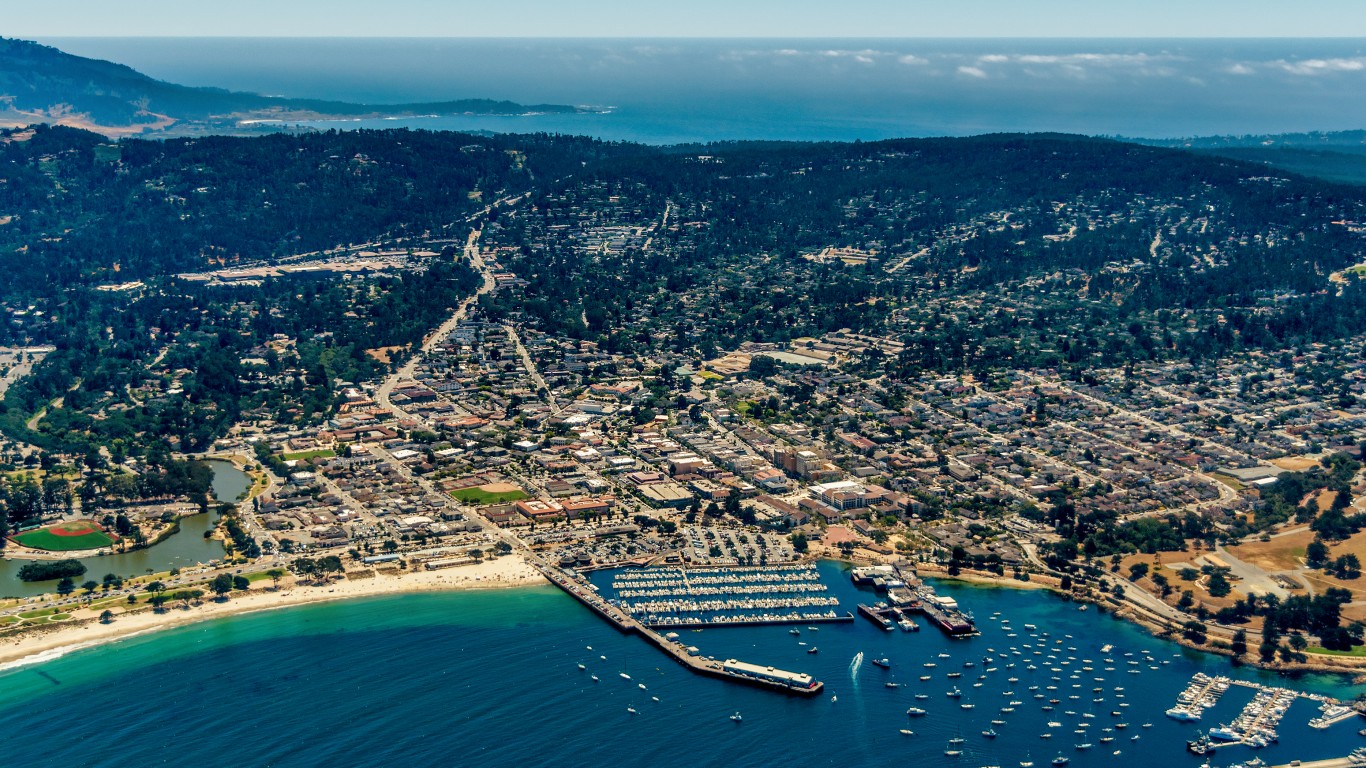
- Avg. temperature, July 1-6, 2024: 80.0°F (+11.1°F hotter than normal)
- Avg. temperature, July 1-6, 1981-2010: 68.9°F
- Total population: 162,783
15. Willows, CA (Glenn County)
- Avg. temperature, July 1-6, 2024: 87.1°F (+11.3°F hotter than normal)
- Avg. temperature, July 1-6, 1981-2010: 75.8°F
- Total population: 6,201
14. Crescent City, CA (Del Norte County)

- Avg. temperature, July 1-6, 2024: 74.4°F (+11.4°F hotter than normal)
- Avg. temperature, July 1-6, 1981-2010: 63.0°F
- Total population: 6,379
13. Hollister, CA (San Benito County)

- Avg. temperature, July 1-6, 2024: 83.7°F (+11.5°F hotter than normal)
- Avg. temperature, July 1-6, 1981-2010: 72.3°F
- Total population: 42,093
12. Eureka, CA (Humboldt County)
")
- Avg. temperature, July 1-6, 2024: 75.8°F (+11.5°F hotter than normal)
- Avg. temperature, July 1-6, 1981-2010: 64.3°F
- Total population: 26,519
11. Stockton, CA (San Joaquin County)

- Avg. temperature, July 1-6, 2024: 87.3°F (+11.6°F hotter than normal)
- Avg. temperature, July 1-6, 1981-2010: 75.7°F
- Total population: 320,030
10. Oroville, CA (Butte County)

- Avg. temperature, July 1-6, 2024: 86.9°F (+11.7°F hotter than normal)
- Avg. temperature, July 1-6, 1981-2010: 75.3°F
- Total population: 20,283
9. Fairfield, CA (Solano County)

- Avg. temperature, July 1-6, 2024: 85.0°F (+11.7°F hotter than normal)
- Avg. temperature, July 1-6, 1981-2010: 73.2°F
- Total population: 119,420
8. Sacramento, CA (Sacramento County)

- Avg. temperature, July 1-6, 2024: 87.7°F (+11.7°F hotter than normal)
- Avg. temperature, July 1-6, 1981-2010: 76.0°F
- Total population: 523,600
7. San Jose, CA (Santa Clara County)

- Avg. temperature, July 1-6, 2024: 81.5°F (+11.9°F hotter than normal)
- Avg. temperature, July 1-6, 1981-2010: 69.5°F
- Total population: 1,001,176
6. Martinez, CA (Contra Costa County)

- Avg. temperature, July 1-6, 2024: 83.6°F (+12.3°F hotter than normal)
- Avg. temperature, July 1-6, 1981-2010: 71.4°F
- Total population: 37,093
5. Ukiah, CA (Mendocino County)

- Avg. temperature, July 1-6, 2024: 78.9°F (+12.4°F hotter than normal)
- Avg. temperature, July 1-6, 1981-2010: 66.5°F
- Total population: 16,496
4. Lakeport, CA (Lake County)

- Avg. temperature, July 1-6, 2024: 84.2°F (+12.5°F hotter than normal)
- Avg. temperature, July 1-6, 1981-2010: 71.8°F
- Total population: 5,014
3. San Rafael, CA (Marin County)

- Avg. temperature, July 1-6, 2024: 74.6°F (+13.0°F hotter than normal)
- Avg. temperature, July 1-6, 1981-2010: 61.6°F
- Total population: 60,891
2. Napa, CA (Napa County)

- Avg. temperature, July 1-6, 2024: 85.4°F (+13.4°F hotter than normal)
- Avg. temperature, July 1-6, 1981-2010: 72.0°F
- Total population: 79,233
1. Santa Rosa, CA (Sonoma County)

- Avg. temperature, July 1-6, 2024: 80.0°F (+14.1°F hotter than normal)
- Avg. temperature, July 1-6, 1981-2010: 66.0°F
- Total population: 178,221
The Average American Has No Idea How Much Money You Can Make Today (Sponsor)
The last few years made people forget how much banks and CD’s can pay. Meanwhile, interest rates have spiked and many can afford to pay you much more, but most are keeping yields low and hoping you won’t notice.
But there is good news. To win qualified customers, some accounts are paying almost 10x the national average! That’s an incredible way to keep your money safe and earn more at the same time. Our top pick for high yield savings accounts includes other benefits as well. You can earn up to 3.80% with a Checking & Savings Account today Sign up and get up to $300 with direct deposit. No account fees. FDIC Insured.
Click here to see how much more you could be earning on your savings today. It takes just a few minutes to open an account to make your money work for you.
Our top pick for high yield savings accounts includes other benefits as well. You can earn up to 4.00% with a Checking & Savings Account from Sofi. Sign up and get up to $300 with direct deposit. No account fees. FDIC Insured.
Thank you for reading! Have some feedback for us?
Contact the 24/7 Wall St. editorial team.

Our expert who first called NVIDIA in 2009 is predicting 2025 will see a historic AI breakthrough.
You can follow him investing $500,000 of his own money on our top AI stocks for free.