While new car prices rose 1.4% to an average of $31,995 in March, Honda Motor Co. Ltd. (NYSE: HMC) was able to raise its, while Nissan had to cut its sharply. Though the auto industry continues to rebound from recent sales lows set in 2009, the recovery is uneven from manufacturer to manufacturer.
Kelley Blue Book (KBB), which released the information, describes the price as the average transaction price, including the value of incentives.
Honda increased new car prices by 4.3% from March 2013 to $28,454. The Honda data was based on sales of the flagship brand as well as luxury brand Acura. Oddly, Honda’s sales fell 7% in February to 100,405. Honda may be trading volume for better prices.
Nissan’s prices fell the most among major car manufacturers that sell cars in the United States. They dropped 3.1% to $27,697. Nissan, combined with its luxury brands, is near the bottom of the industry in terms of average transaction price.
The industry’s leader is General Motors Co. (NYSE: GM) at $35,006. Its average price increased 1.8% from March 2013. Its brands include Buick, Cadillac, Chevrolet and GMC.
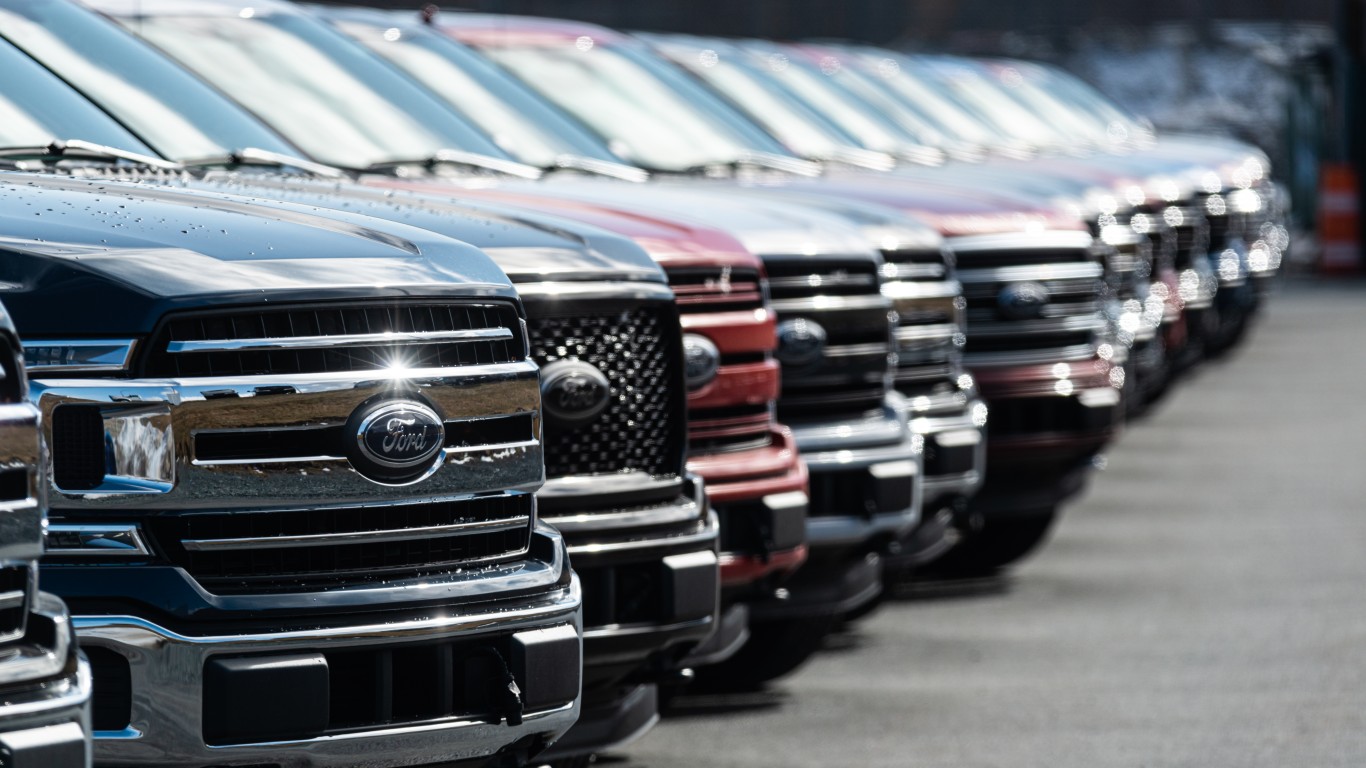
The second largest car company in the United States, based on sales, is Ford Motor Co. (NYSE: F), which was able to raise prices by about the same amount as GM — 1.7% to $34,372. Its sales include the flagship brands plus those of deeply troubled Lincoln.
The smallest of the Big Three, Chrysler Group, increased prices an average of 3.1% to $32,018. Aside from its flagship, Chrysler’s brands include Jeep, Dodge, Fiat and RAM.
Overall, KBB describes industry prices as solid. Its researchers commented:
We are seeing continued year-over-year gains in average transaction prices. The increase in prices have been enough to offset rising incentive spend and consumers have consistently shown they are willing to spend top dollar for the best models available, so the first focus for manufacturers should remain on building solid products.
The trends do not keep the industry’s leaders from anxiety about the tepid economy, a trend of younger Americans to shy away from car ownership, and the fact that many of the older cars on America’s roads have been replaced by new ones already.
| Manufacturer | March2014 Transaction Price (Avg.) | February2014 Transaction Price (Avg.) | March 2013 Transaction Price (Avg.) | Percent Change February 2014 to March2014 | Percent Change March 2013 to March 2014 |
| American Honda (Acura, Honda) | $28,454 | $28,364 | $27,278 | 0.3% | 4.3% |
| Chrysler Group (Chrysler, Dodge, Fiat, Jeep, RAM) | $32,018 | $31,953 | $31,063 | 0.2% | 3.1% |
| Ford Motor Company (Ford, Lincoln) | $34,372 | $34,436 | $33,808 | -0.2% | 1.7% |
| General Motors (Buick, Cadillac, Chevrolet, GMC) | $35,006 | $35,357 | $34,389 | -1.0% | 1.8% |
| Hyundai-Kia | $24,310 | $24,394 | $23,776 | -0.3% | 2.2% |
| Nissan North America (Nissan, Infiniti) | $27,697 | $27,876 | $28,577 | -0.6% | -3.1% |
| Toyota Motor Company (Lexus, Scion, Toyota) | $30,882 | $30,903 | $30,199 | -0.1% | 2.3% |
| Volkswagen Group (Audi, Volkswagen) | $34,467 | $34,028 | $33,605 | 1.3% | 2.6% |
| Industry | $31,995 | $32,180 | $31,545 | -0.6% | 1.4% |
100 Million Americans Are Missing This Crucial Retirement Tool
The thought of burdening your family with a financial disaster is most Americans’ nightmare. However, recent studies show that over 100 million Americans still don’t have proper life insurance in the event they pass away.
Life insurance can bring peace of mind – ensuring your loved ones are safeguarded against unforeseen expenses and debts. With premiums often lower than expected and a variety of plans tailored to different life stages and health conditions, securing a policy is more accessible than ever.
A quick, no-obligation quote can provide valuable insight into what’s available and what might best suit your family’s needs. Life insurance is a simple step you can take today to help secure peace of mind for your loved ones tomorrow.
Click here to learn how to get a quote in just a few minutes.
Thank you for reading! Have some feedback for us?
Contact the 24/7 Wall St. editorial team.


