Analysts have a consensus price target objective of close to $195.00 and traders and investors alike should know that the earnings figure is lower due to the $5 billion repayment to Berkshire Hathaway Inc. (NYSE: BRK-A) for its investment in late 2008. Warren Buffett still has warrants with a strike price of $115.00, so he can still make plenty on his deal there. Goldman Sachs already outlined how this payback would generate a $2.80 per share charge for this past quarter’s results and that is why the figures are so low.
One more consideration as we have seen elsewhere is a comparison of price to book value. Goldman ended 2010 with a book value of $128.72 (up about 10% from a year earlier and up 1% sequentially) and listed its tangible book value at $118.63 (up about 9% from a year earlier and up about 2% sequentially).
What makes Goldman Sachs different from the other “bank holding companies” is that it effectively has no credit metrics that have to be tallied. It has also been trying to limit its proprietary trading operations because of public perception that the market was rigged. Now we have to watch brokerage and trading income, asset management income, and investment banking.
Options are now one month out before expiration, so these figures may be inflated a bit. Options traders appear to be braced for a move of up to $3.00 to $3.50 in either direction.
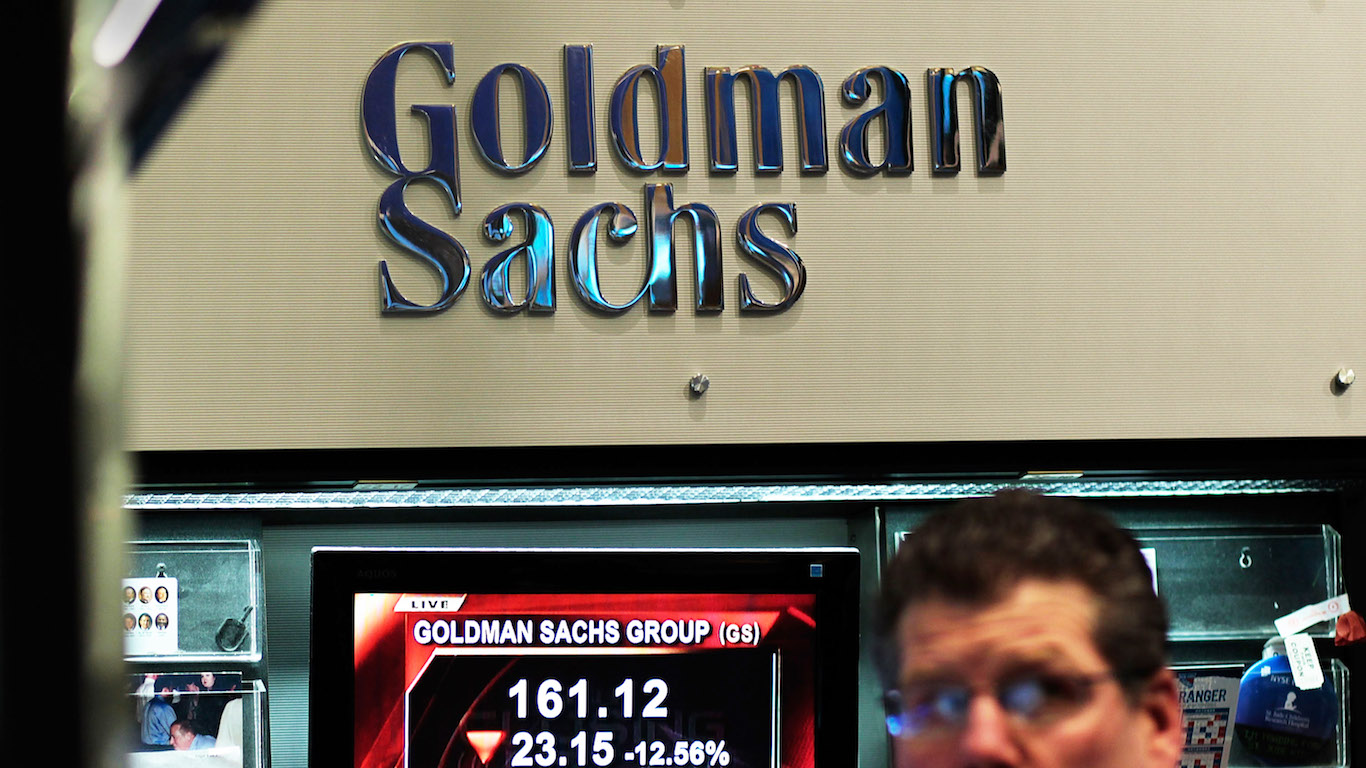
The chart is showing concern (see below from StockCharts.com), although it may also just be at an extreme reading now. The good news is that we are back at support levels seen around mid-March. The shares broke under the 200-day moving average just last week and that 200-day moving average is currently up at $157.23; and its 50-day moving average is all the way up at $161.31.
JON C. OGG