
The average age of a light vehicle (passenger cars and vans, SUV/crossovers, pickup and other light trucks) has risen from 9.3 years in 2009 to 10.5 years in 2017 according to the latest data from the U.S. Federal Highway Administration (FHWA) National Household Travel Survey. No surprise, perhaps, is the finding that Americans with low household incomes drive older vehicles.
Households with less than $25,000 in income now keep their vehicles an average of 13 years, up from 11.9 years in 2009. Households with more than $100,000 in income keep their vehicles an average of 8.9 years, up from 7.3 years in 2009. The average age of vehicles has risen more among high-income households than the rise in age of vehicles in low-income households.
Is that good news or bad news for the auto industry? After all, if Americans are not buying new cars, the industry will suffer.
But it hasn’t happened yet. In each of the last three years, new car sales have come in right around 17 million or more per year although sales dipped by about 300,000 year over year between 2016 and 2017 to about 17.2 million. This year is on track to see sales drop below 17 million and perhaps as low as 16.5 million.
[nativounit]
According to the FHWA report, this was the makeup of the U.S. auto fleet by age of vehicle, total in the age group, and percentage of all vehicles.
- 0 to 2 years old: 28.75 million, 13% of total
- 3 to 5 years old: 41.39 million, 18.7% of total
- 6 to 9 years old: 42.71 million, 19.4% of total
- 10 to 14 years old: 55.04 million, 25% of total
- 15 to 19 years old: 31.6 million, 14.2% of total
- 20 or more years old: 21.43million, 19.7% of total
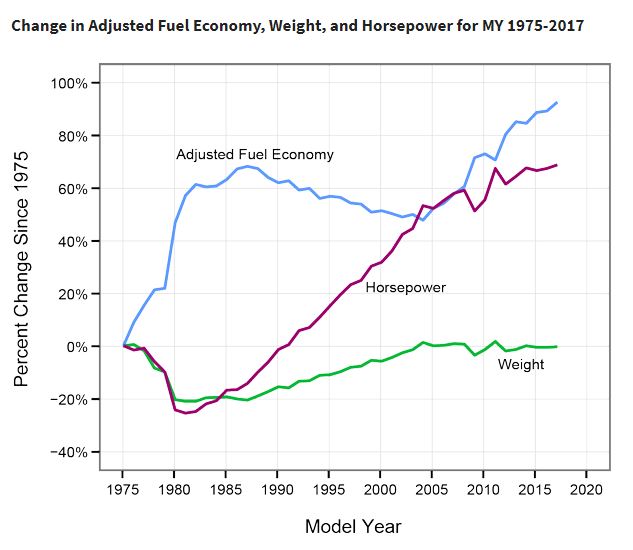
Even though the U.S. fleet is getting older, fuel economy continues to increase thanks to new technologies adopted in recent years for all light vehicles. Compared to model year 1975 vehicles, adjusted fuel economy for model year 2017 vehicles has improved by more than 90%. This chart from the EPA’s latest report on emissions and fuel-economy trends highlights the pace of fuel-economy growth.
National Household Travel Survey data is available at the agency’s website.
[wallst_email_signup]