Every automaker sells two things: vehicles and dreams. Customers looking for an inexpensive car want to be dazzled in the same way that buyers of luxury cars do. In real life, the differences between the two may be obvious, but automakers’ websites can blur the distinctions, at least until a shopper sees the price sticker.
In addition to putting a carmaker’s best foot forward, websites can present a lot of information about a vehicle through photos and videos. A well-thought-out navigation scheme that allows customers easily to find what they’re looking for and speedy website performance are other features that can start a customer’s experience with a brand off on the right foot.
Consumer product research firm J.D. Power has just released its 2019 rankings of auto manufacturers’ websites. The firm ranks the sites in two general categories: luxury and mass-market. On a 1,000-point scale, the average website score in the luxury vehicle segment was 830. In the mass-market segment, the average score was 823.
J.D. Power fielded the study in October and November of last year and received responses from more than 13,500 new-vehicle shoppers who said they will be in the market for a new vehicle within the next 24 months. Shoppers were asked to rank automakers’ websites on four criteria: information/content; appearance; navigation; and speed.
[nativounit]
While the results themselves were interesting, we thought that looking at how the same brands fared in J.D. Power’s 2018 Initial Quality Study published last June would highlight the impact of websites on the vehicles consumers chose to buy. The initial quality study looked at 32 brands and the highest possible score was 10.
Here then are the top five luxury brand websites along with the brand’s initial quality rating.
| Car | Website rank/score: (out of 1,000) | Initial quality rank/score: (out of 10) |
|---|---|---|
| Land Rover | 1/857 | 32/5 |
| Audi | 2/844 | 25/7 |
| Infiniti | 3/839 | 19/8 |
| BMW | 4/837 | 4/9 |
| Cadillac | 5/837 | 5/9 |
Do the top three websites wield more influence than the vehicles’ actual quality? Land Rover sales were down 14.4% in Europe last year but up 23.3% in the United States, although sales volume was higher in Europe: 126,472 units to 92,143 in the United States. While it’s not possible to be certain, it seems reasonable that Land Rover’s website is more than a match for its last-place quality ranking, at least in the United States.
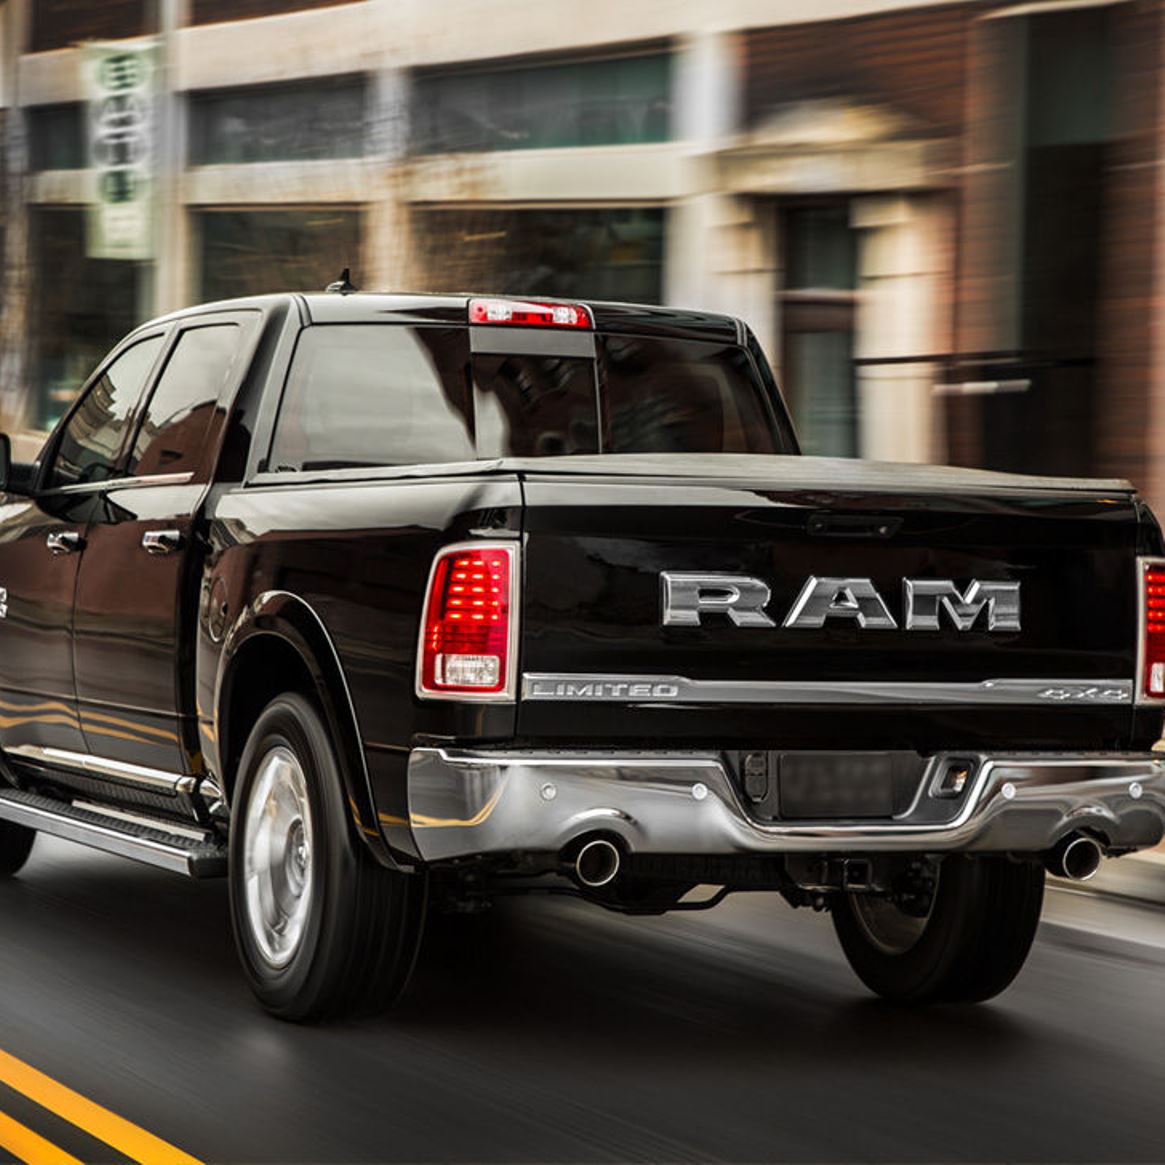
In the mass-market segment, here are top five-rated manufacturers’ websites, along with initial quality scores for the brands.
| Car | Website rank/score: (out of 1,000) | Initial quality rank/score: (out of 10) |
|---|---|---|
| Ram | 1/842 | 13/9 |
| Ford | 2/836 | 8/9 |
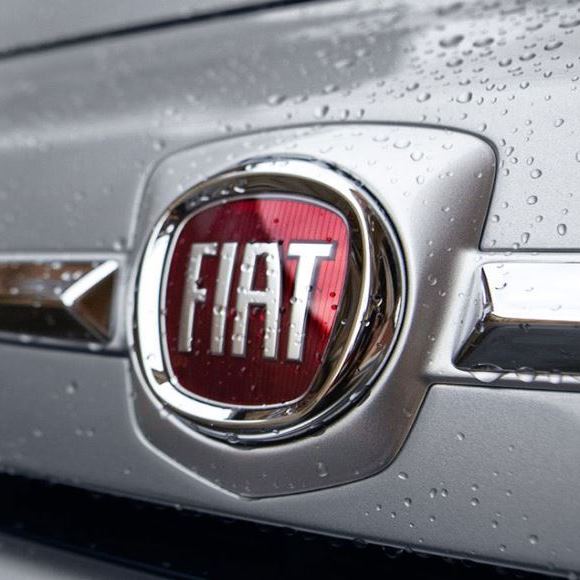
| Fiat | 3/835 | 7/9 |
| Jeep | 4/835 | 21/8 |
| Kia | 5/827 | 2/10 |
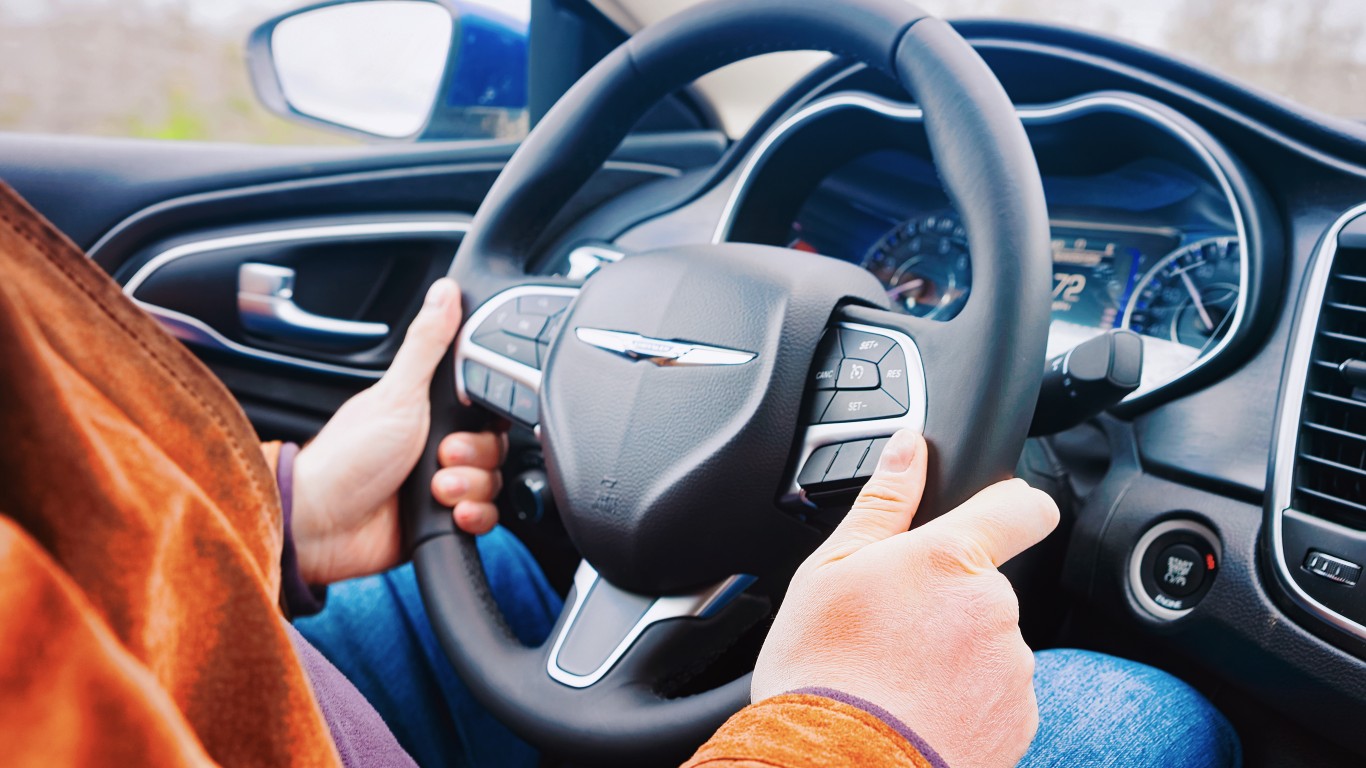
Interestingly, three of the top five brand websites are pushing vehicles from one maker: Fiat Chrysler. Ram’s top ranking in websites is matched by a quality score in the middle third of the pack. Jeep’s website is ranked fourth but the vehicle’s quality rating falls in the bottom third. It’s probably not accidental that Jeep sales are booming, up 17% year over year in 2018 U.S. sales and up 37% in European sales, or that U.S. Ram sales were up 7% last year.
[recirclink id=522052]
[wallst_email_signup]