Chartists do not make so much noise about the news nor about the reasons why. Fundamental investors need catalysts, and those catalysts in the market right now are numerous — even if they are still developing. These could be many things, from Russia and Ukraine, Iraq, the possibility that interest rates will not rise or not rise very much, the European Central Bank’s quantitative easing, another round of quantitative easing from Japan, endless money printing around the globe, India reversing its policies, and on and on.
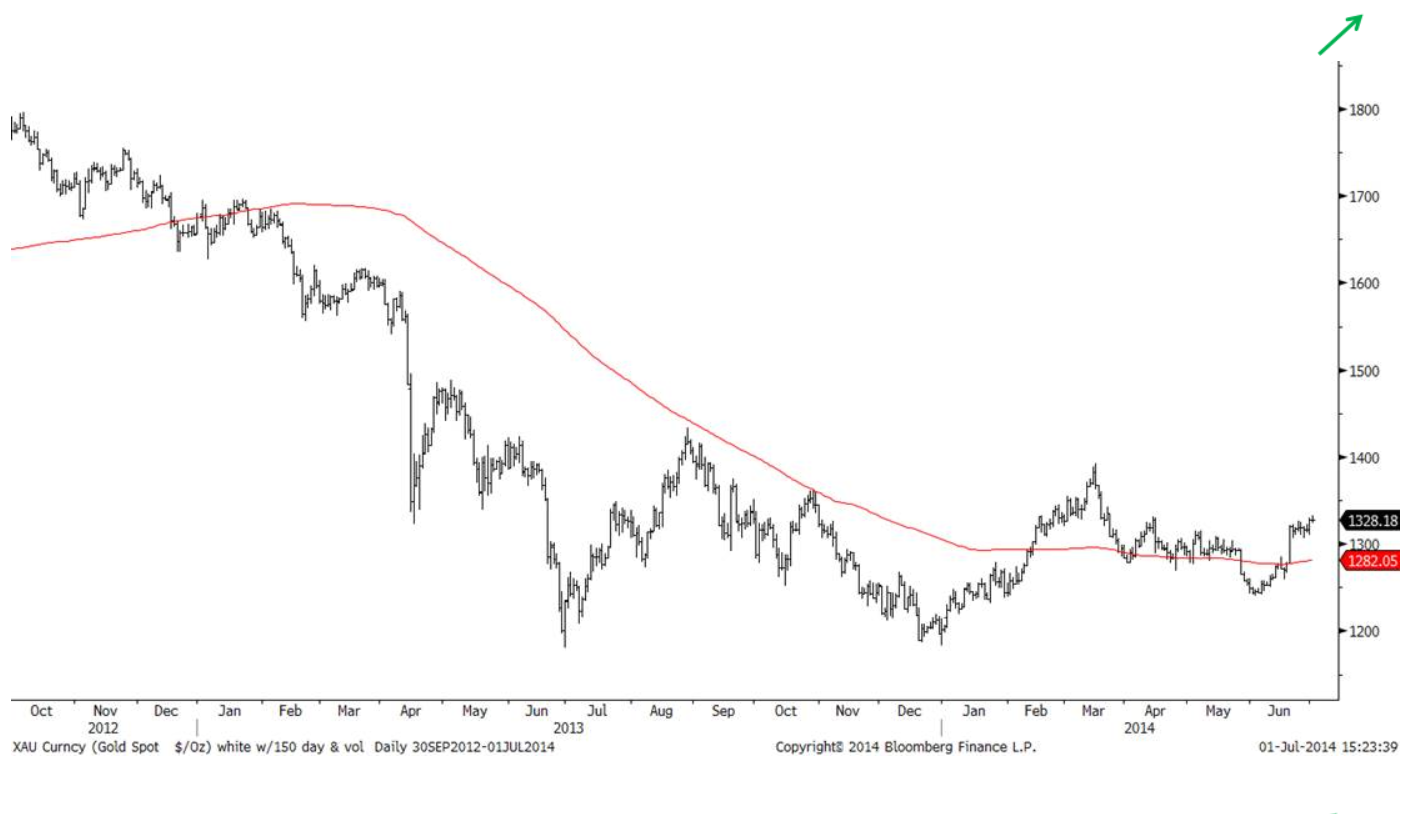
24/7 Wall St. wanted to get some outside and independent feedback from technicians and analysts who have no dogs in the gold fight, so to speak. Sterne Agee’s technical analyst is Carter Worth. This week he issued a report showing that the gold trend is going higher. Again, pure technicians maintain that the charts are telling what the fundamentals and money flows are driving.
Worth’s reading of the charts signals that gold is in a “Bearish-to-Bullish” reversal and is now a good place to be on the long side. Amazingly, his thesis also points toward lower long-term Treasury yields. He sent us an excerpt from his report calling gold a buy and said it is judged to be in the throes of a well-defined “Bearish-to-Bullish” reversal with the prospective completion of the bottoming-out process implying a move to somewhere around the $1.500 per ounce level. Worth even noted that a “Head and Shoulders” bottoming pattern is what’s at play here.
Worth said in this week’s report:
Gold Bullion and gold mining stocks are disparaged, ridiculed and passed over. And that is exactly what makes them so interesting on the long side, by our work. The patterns themselves are quite well developed. … Quietly, deliberately, without much fanfare, the metal and the miners have been bottoming out for since last June.
Gold was trading around the $1,327 per ounce mark on Wednesday morning, up about $2 so far, and we cannot help but to point out that $1,330 to $1,331 has been a period of resistance this week. Would $1,500 gold translate to a return of $25 silver? Perhaps, but we remind readers again that these metals markets may follow direction leads but they do not always perform step-by-step with each other.
ALSO READ: Why Coeur Could Double
We also included a chart sent from Sterne Agee for the gold bugs and gold haters to chew over. (Click on chart to enlarge.)