Gold is back above its key 200-day moving average. This is a chart development that just came to fruition on Thursday and Friday. So, is this a breakout, or is it a fake out?
The gold miners had been trading in 2013 as though gold was not just going toward $1,200 per ounce. In many cases, you would have assumed that the miserable gold performance was taking gold down to less than $1,000. Gold miners and producers cut their dividends and had to take unilateral accounting charges against the book value of all those gold reserves. Falling from close to $1,900 to $1,200 will just cause that.
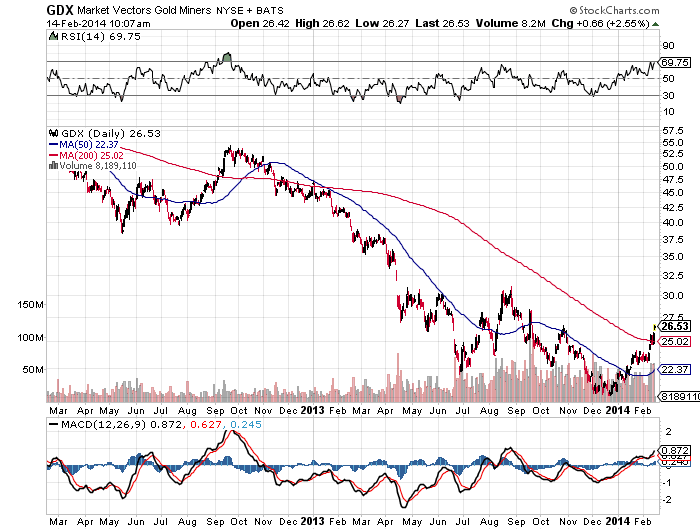
A review from Friday and from the weekend showed that the gold miner exchange traded fund called the Market Vectors Gold Miners ETF (NYSEMKT: GDX) was breaking out above the 200-day moving average. This was actually before the “real gold” broke above its 200-day moving average.
We checked this on multiple systems and have shown the charts, but we are keeping this one simple. The GDX gold chart on Yahoo! Finance shows that the mining ETF started making its chart break earlier last week. The big gold ETF, the SPDR Gold Shares Trust (NYSEMKT: GLD), just made its first breakout above its 200-day moving average on Friday.
What makes these chart breakouts different than the last time we saw a breakout attempt on the 200-day moving averages is that the price levels are vastly different. Gold was closer to $1,600, versus about $1,325 today. The GDX ETF was at almost $50 and ran to $55, but the ETF is closer to $26 this time around.
Even in the key gold trust, the SPDR Gold Shares (NYSEMKT: GLD) was trading above $160 the last time it challenged the 200-day moving average. It is taking place around $127 this time around.
We have always said this: Chart readers are an interesting lot. Pure technicians claim not to never really care about the news. The charts tell them whether they should buy or sell, supposedly factoring in all known market information at any given time. Our warning is that charts, just like fundamentals, come with no guarantees. When they do not work out, there are many excuses as to why it was the wrong read.
The fundamentals may be coinciding with the chart this time. First off, it looks like the strong base is around $1,200 in gold. Gold may be back as a risk-on trade. Then it could be a hedge as well — is there too much emerging market currency risk out there? Is India really going to be back as a gold buyer with lower purchasing and taxing restrictions? Is the unfolding of Bitcoin proving that gold is a better hedge than a fake (virtual) currency?
The answer to any of the points above is likely yes, at least in part, on all of these. Still, pure technicians do not care. They just read charts. The markets will know very soon whether this is the start of the first gold chart breakout or just another fake out.