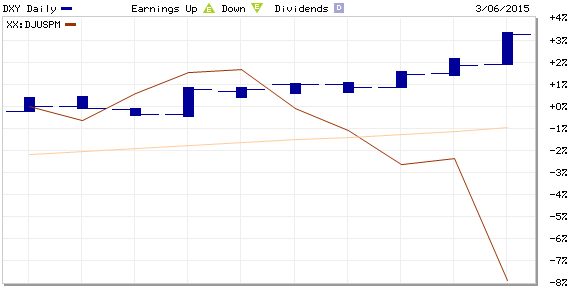
The strong dollar got even stronger on Friday, following the employment situation report indicating that the unemployment rate has fallen to 5.5% and that nonfarm payrolls added 295,000 jobs in February. Inflation fears are on hold, jewelry buying is soft and gold — especially the gold miners — continues to struggle.
We noted in our previous report on gold that total demand in 2014 fell 64.3 metric tons (tonnes) year-over-year in 2014, mainly as a result of outflows from exchange traded products, which saw demand fall from 880.0 tonnes to 159.1 tonnes. Demand for gold from ETFs and ETNs may pick up somewhat this year, but the demand is unlikely to rise back to 2013 demand levels.
ALSO READ: Why Merrill Lynch Threw In the Towel on Aluminum
Of the gold miners we looked at last month, Barrick Gold Corp. (NYSE: ABX) sported a potential upside on the stock of 4.6%. Based on Thursday’s closing price of $12.19 and a consensus price target of $13.60, the potential gain has blossomed to around 11.6%. Of course the share price has dropped nearly 5% in the past couple of weeks, with most of the decline coming this week as the dollar strengthened. The stock dropped about 5.6% on Friday to trade at $11.51, in a 52-week range of $10.04 to $21.10.
Goldcorp Inc. (NYSE: GG) shares closed at $20.69 and the consensus price target on the stock is $26.02, for an implied upside of nearly 26%, slightly higher than the implied gain of 23% last time we looked. Goldcorp’s shares are down 3% in the past two weeks and, like Barrick, all the loss has occurred this week. On the day, Goldcorp’s shares were down about 7.4% at $19.17 in a 52-week range of $17.01 to $29.95
Newmont Mining Co. (NYSE: NEM) is the only one of the miners we are looking at here to see its share price improve over the past two weeks. The stock closed at $25.30 Thursday, up nearly 3.5% in the period. At the current price target of $25.66, the implied upside is about 1.4%, but that is largely due to an increase in the price target from $23.79 two weeks ago. Shares traded down 6.3% on Friday morning, at $23.74 in a 52-week range of $17.60 to $27.40.
Randgold Resources Ltd. (NASDAQ: GOLD) has seen its share price fall about 4.4% in the past two weeks to close at $73.52 on Thursday. The potential upside at that price and a consensus price target of $93.37 is about 27%. The stock was down another 5.9% Friday to trade around $69.20 in a 52-week range of $58.00 to $89.89.