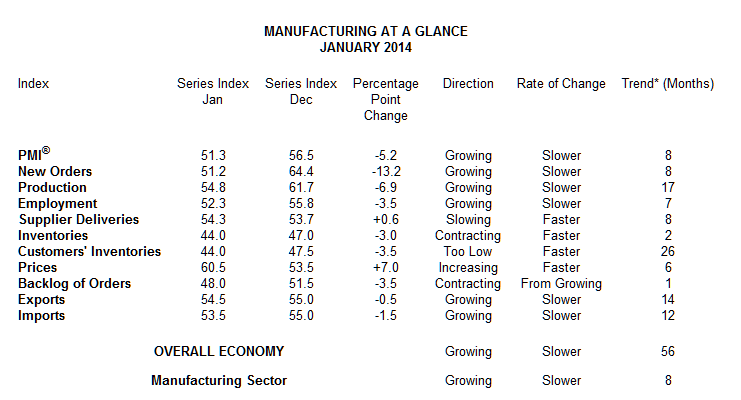
Monday’s message from the ISM is that economic activity in the manufacturing sector still managed to expand for the eighth consecutive month. This now marks overall economic growth for the 56 consecutive months. That being said, this was far worse than expected, and it is down from 56.5% in December.
The New Orders Index fell a sharp 13.2 points to 51.2%, while the Production Index fell 6.9 points to 54.8%. Inventories of raw materials decreased by three percentage points to 44%, its lowest reading since December 2012.
What stands out is that the ISM said a number of comments from the panel cited adverse weather conditions as a factor negatively affecting their businesses in January. Other comments reflected optimism and increasing volumes in the early stages of 2014.
Of the 18 manufacturing industries, only these 11 of them reported growth in January:
- Plastics & Rubber Products
- Primary Metals
- Textile Mills
- Wood Products
- Printing & Related Support Activities
- Fabricated Metal Products
- Electrical Equipment, Appliances & Components
- Transportation Equipment
- Machinery
- Furniture & Related Products
- Food, Beverage & Tobacco Products
These seven industries reporting contraction in January:
- Nonmetallic Mineral Products
- Petroleum & Coal Products
- Apparel, Leather & Allied Products
- Miscellaneous Manufacturing
- Chemical Products
- Paper Products
- Computer & Electronic Products
We have also provided the ISM’s table to show the trends and the formal number of each. As a reminder, a figure above 50 signals growth and one of less than 50 signals contraction.