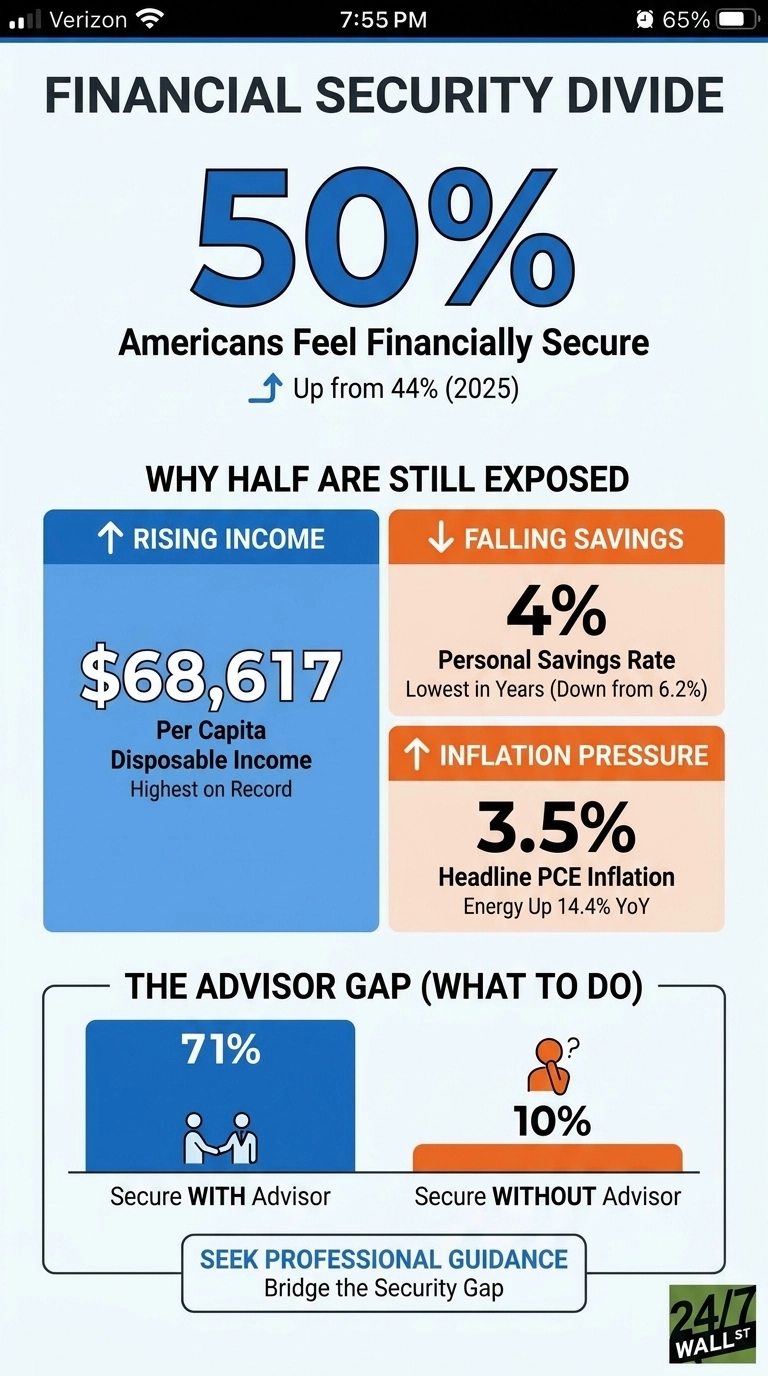
The share of Americans who describe themselves as financially secure climbed from 44% to 50% in a single year, according to the Northwestern Mutual 2026 Planning & Progress Study. That is a meaningful shift after a stretch of post-pandemic anxiety, and it is the kind of headline that suggests household balance sheets are finally healing. The underlying data tells a more complicated story. Half the country still describes itself as exposed, and the conditions surrounding the survey help explain why the other half has not yet joined the recovery.
By several measures, the typical American household is in a stronger position than it was a year ago. Wages have continued to grow in nominal terms, unemployment has held in a range economists generally consider healthy, and disposable income has risen. On paper, more cash is flowing through the average household than at almost any prior point in the survey’s history.
Why the Other Half Still Feels Exposed
The savings buffer that usually accompanies an income recovery has not formed, and that absence is doing real damage. The personal savings rate has fallen steadily over the past two years even as disposable income has climbed, which means the additional earnings are being absorbed by higher costs rather than building any meaningful cushion. Households taking home more while keeping less of it are structurally more exposed to price shocks, not less, and the current inflation environment has delivered those shocks consistently.
That backdrop shows up clearly in how Americans describe their own situation. Inflation ranks as the single biggest barrier to financial security, cited by more than four in ten Americans and running well ahead of savings shortfalls, healthcare costs, and personal debt, each of which trails by a significant margin.
Even as fewer respondents reported higher grocery prices than the prior year, inflation expectations rose, with a majority of Americans now expecting prices to continue climbing through 2026. Consumer sentiment has followed that pessimism lower, entering territory typically associated with recessionary psychology, despite a labor market that remains relatively stable.
Even as fewer respondents reported elevated grocery inflation in 2026 (79% versus 84% a year earlier), inflation expectations rose from 51% to 56%. Consumer sentiment registered 53.3 in March, well below the neutral 80 threshold and consistent with that anxiety.
Debt and Speculation Fill the Gap
Where savings have thinned, credit has filled in. Among Americans carrying personal debt, the average balance is $21,700, excluding mortgages, and nearly two-thirds say they are prioritizing debt repayment over saving. More than a third plan to use buy-now-pay-later financing for large purchases this year, and nearly a quarter are using it for daily essentials. The Federal Reserve has eased rates from recent highs, but credit card borrowing costs remain elevated relative to what most households can realistically set aside to offset them.
The same pressure shows up at the other end of the risk spectrum. Roughly four in ten Americans are invested in or considering high-risk speculative assets, and nearly three-quarters of that group say they feel financially behind and believe speculation offers a faster path to their goals than traditional saving would. Among Gen Z, that figure reaches eight in ten. The pattern reflects a population responding to real financial pressure with tools that carry the highest possible downside at exactly the moment when a mistake would be hardest to recover from.
The Advisor Divide
The survey’s sharpest split runs along access to professional guidance. Among Americans who work with a financial advisor, fully 71% describe themselves as financially secure, compared with just 10% of those who do not. That gap dwarfs the six-point year-over-year improvement in the headline figure and suggests the population that moved from exposed to secure is heavily concentrated among households already inside the advisory system.
What the Data Says About 2026
The improvement in self-reported financial security is real and consistent with rising wages and steady employment. The half that remains exposed is equally consistent with a savings rate near multi-year lows, inflation running well above what most households planned for, and a growing reliance on credit and speculative assets to bridge the gap. Closing that remaining gap depends on whether savings behavior stabilizes, inflation pressures ease back toward more manageable levels, and debt balances stop expanding faster than the wages being used to service them. The recovery has reached half the country. The other half is waiting on a different set of numbers to move.