It is easy to overlook a 2.9% drop in gross domestic product in the first quarter when the official unemployment rate is now nearing 6% again. After all, the financial media tells you over and over that things are better. It is not as if they are lying — things truly are better. The question is simply by how much things are better.
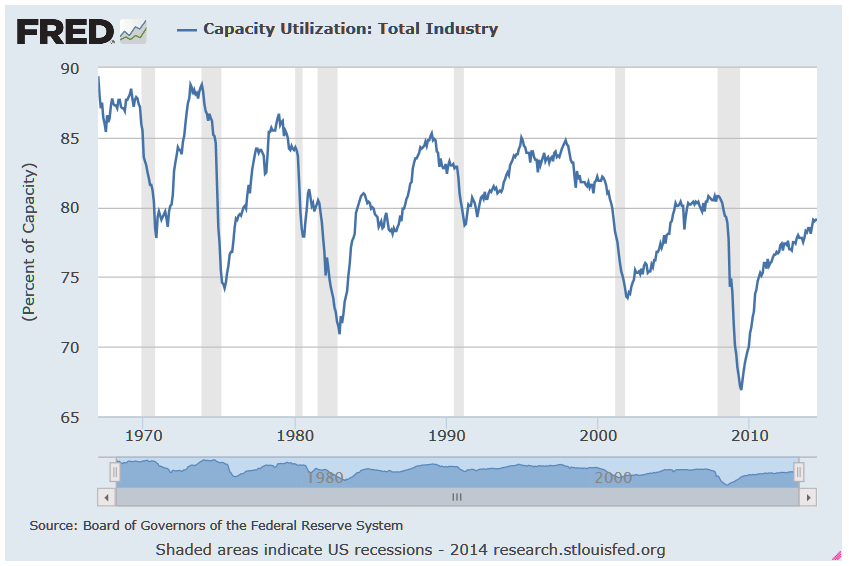
This past Wednesday we got to see the Federal Reserve’s report for June on industrial production and capacity utilization. It turns out that production was muted, but the overall capacity utilization remains defiantly under that key 80% barometer — at 79.1%.
The markets keep rising, and the economy keeps looking better as a whole. But it is just shocking that the capacity used remains so low. It only signals even further that the United States is not really on its way back to being a manufacturing powerhouse.
From 2005 through the start of 2008, that capacity utilization rate had gotten back above 80%. Industrial production, or output, was reported with a soft 0.2% gain in June, and May’s number was revised down to a gain of 0.5% from a preliminary report of 0.6%. The 79.1% capacity use figure compared to a consensus estimate of 79.2%.
ALSO READ: 12 Analyst Stocks to Buy Under $10 With Huge Potential Upside
Bloomberg defines capacity utilization as follows:
The capacity index, which is an estimate of sustainable potential output, is also expressed as a percentage of actual output in 2007. The rate of capacity utilization equals the seasonally adjusted output index expressed as a percentage of the related capacity index.
What we find interesting about the recovery is that the capacity use is no longer catching up to a historical benchmark. In fact, the chart below compiled by the St. Louis Fed shows that the old 85% benchmark peak of the 1980s and 1990s is almost certainly now just a part of economic history.
The recovery continues, but as one portfolio manager once told us, the world is simply awash in capacity! Is it any wonder that you hear the recovery skeptics blasting each new improved unemployment and payrolls report with the lowest labor force participation rates in two generations?
The St. Louis Fed image below tracks capacity utilization back to the 1960s. The image can be expanded by clicking on it.