These were not universal downgrades, but all in all the Fed is less aggressive on gross domestic product growth (GDP) and is becoming more expecting of lower and lower inflation lasting longer. Another development is that we got to see the Fed’s initial 2018 outlook, and on the surface they just do not really add up on anything other than that the Fed members may just be taking stabs at long-term historical norms.
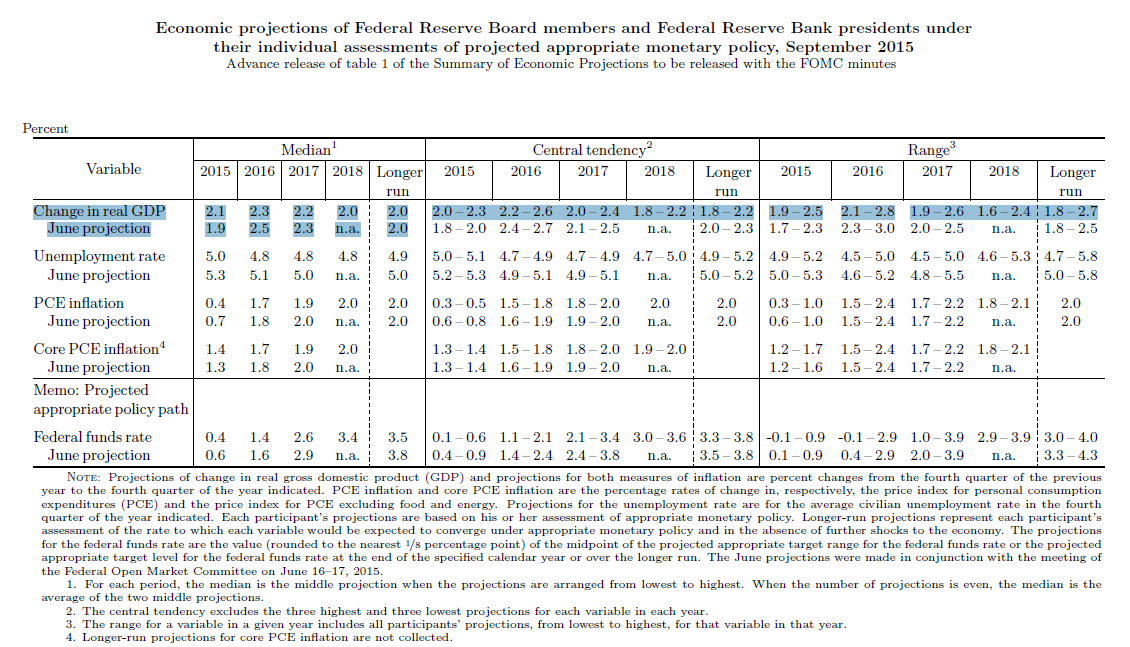
On real GDP, the following forecast changed were made:
- Median GDP now 2.1% for 2015, up from 1.9% seen in June.
- 2016 now seen at 2.3%, versus 2.5% forecast in June.
- 2017 now seen at 2.2%. versus June’s 2.3% projection.
- And 2018 now forecast at 2.0% as a new target.
The unemployment rate has seen improved expectations. The Fed sees 5.0% for 2015 now, versus 5.3% in June. The 2016 unemployment rate was lowered to 4.8% from 5.1%, the 2017 unemployment rate was pegged at 4.8% from the 5.0% prior expectation, and the target for 2018 was set at 4.8% as well.
ALSO READ: America’s Richest (and Poorest) States
PCE inflation on the headline was lowered for the years ahead as follows (versus June forecasts):
- 2015 at 0.4% (vs. 0.7% before)
- 2016 at 1.7% (vs. 1.8% before)
- 2017 at 1.9% (vs. 2.0% before)
- 2018 now targeted at 2.0%
Core PCE Inflation actually ticked a tad higher for 2015, to 1.4% from the 1.3% expected in June. The following core PCE rate projections were set as follows (again, versus the June forecast):
- 2016 at 1.7% (versus 1.8% before)
- 2017 at 1.9% (versus 2.0% before)
- 2018 set at 2.0%
The median projection on the fed funds rate has been reduced as well. These are versus the June projections:
- 2015 at 0.4% (versus 0.6% before)
- 2016 at 1.4% (versus 1.6% before)
- 2017 at 2.6% (versus 2.9% before)
- 2018 set at a preliminary 3.4%
As a reminder, long-term Federal Reserve targets are of course far from being assured. The reality is that many Fed presidents and policymakers tend to rely on historical norms. Whether those will be fair under a “new normal” remains to be seen. Stay tuned.
ALSO READ: 8 States Running Out of Water
An image from the FOMC’s new table has been included below.