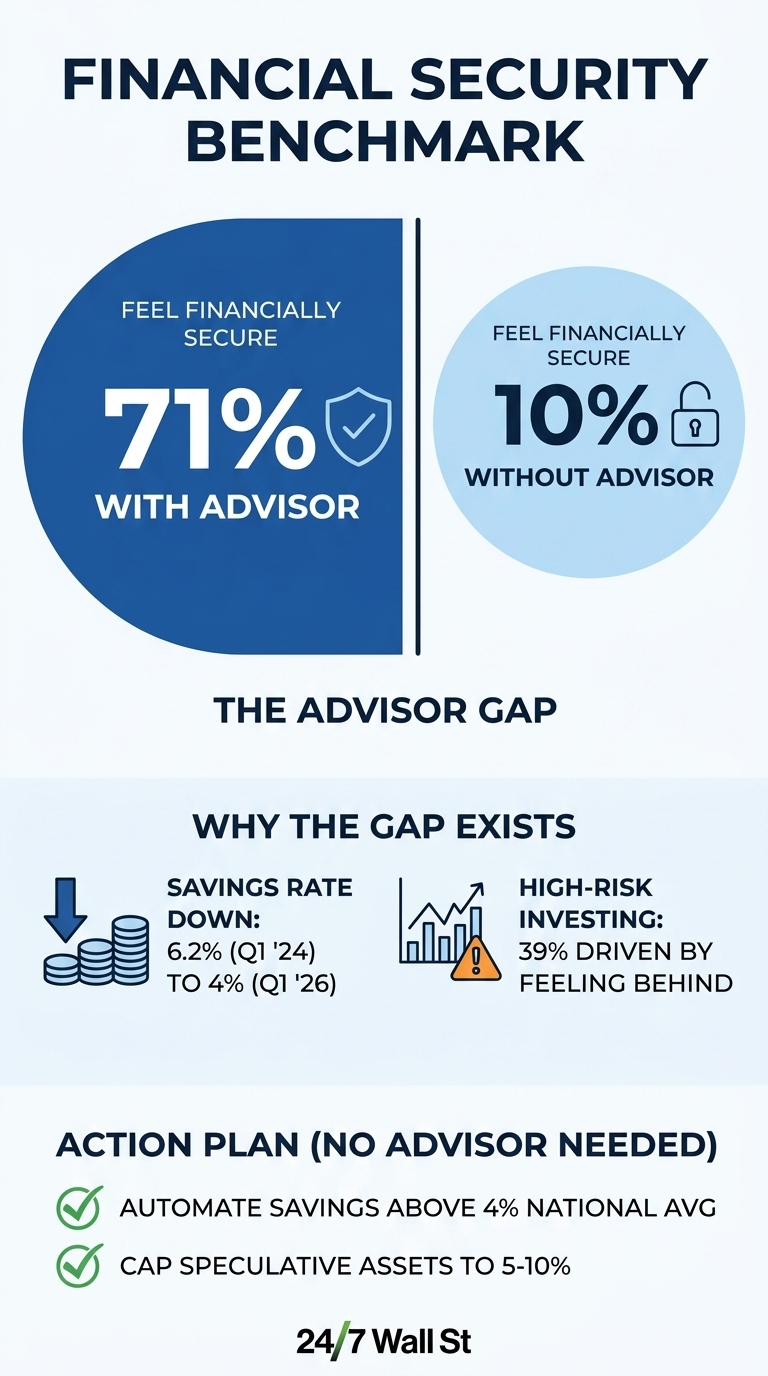
One number from the Northwestern Mutual 2026 Planning & Progress Study does more work than almost any other personal finance benchmark released this year. Among Americans who work with a financial advisor, 71% report feeling financially secure. Among those without one, only 10% do. The gap reflects a roughly seven-to-one difference in how confident people feel about their own money, sorted almost entirely by whether a professional is in the conversation.
That gap matters more right now than it would in a calmer environment. Inflation ranks as the single biggest obstacle to financial security for 42% of Americans in the same survey, running well ahead of lack of savings at 25%, personal debt at 22%, and healthcare costs at 22%. More than half of Americans, 56%, expect inflation to increase further in 2026, and 48% say their household income is already growing slower than prices.
The advisor’s question is being answered against that backdrop, which means the 71% figure is not just a vote of confidence in professional guidance. It is a reading on how households are coping with a financial environment that remains difficult, regardless of where the economy officially stands.
What the 71% actually reflects
The 71% figure tracks closely with a separate finding in the same report about financial discipline. In 2026, 53% of Americans describe themselves as disciplined financial planners, up from a record low of 45% in 2024 and continuing a two-year recovery. Discipline and advisor use tend to travel together, and the data support that connection. People who work with advisors are more likely to have written goals, automated contributions, and a clear plan for what to do when markets fall.
Whether the advisor creates the discipline or disciplined people are simply more likely to seek one out, the outcome in the data is the same: a stable framework for making decisions when the environment makes decisions harder.
The broader security picture reinforces why that framework matters. Overall financial security rose from 44% to 50% of Americans between 2025 and 2026, with Millennials jumping from 43% to 53% and Gen X climbing from 40% to 48%. Those are meaningful gains, but they also mean that half of the country still does not feel secure, and the households on the wrong side of that number are largely those without a structured plan.
Where the unadvised 90% are putting risk
The behavior gap shows up most clearly in how Americans are responding to feeling behind. 39% of all Americans are currently investing in or considering high-risk or speculative assets, including cryptocurrencies, prediction markets, sports betting, and options, with Gen Z and Millennials making up the largest share. Among those investors, 73% say they are doing it because they feel financially behind and believe speculation offers a faster path to their goals than traditional saving. The pattern looks less like a strategy and more like a shortcut, an attempt to compress years of compounding into a single concentrated bet, which is nearly the inverse of what advised households tend to do.
That urgency is not coming from nowhere. 45% of Americans expect the economy to weaken in 2026, and more than half expect inflation to keep climbing. When households feel squeezed from multiple directions at once, the appeal of a faster solution grows, and the data show that younger adults are most likely to act on that feeling in ways that carry the most long-term risk.
Closing the gap without hiring someone
The advisor benchmark is useful even for households that cannot or will not pay for one, because the behaviors associated with the 71% are largely reproducible without a professional in the room. The discipline finding in the same report suggests that planning, having written goals, a savings target, and a clear rule for handling market volatility correlate with feeling secure regardless of portfolio size. A household that automates contributions above the national savings average, caps speculative allocations, and writes down a one-page plan covering accounts and rebalancing rules has covered most of what an advisor would document in a first meeting.
The 71% versus 10% finding is one of the few gaps in personal finance data large enough to be visible through all the noise of a complicated year. The economy is sending mixed signals, inflation expectations are rising, and nearly half the country believes things will get harder before they get easier. Against that backdrop, the difference between feeling secure and not feeling secure hinges less on income or portfolio size than on whether someone has a plan and someone to help them stick to it.