Economy
City Budgets in an Era of Increased Uncertainty: Understanding the Fiscal Policy Space of Cities

Published:
Last Updated:

By Michael A. Pagano, Nonresident Senior Fellow—Metropolitan Policy Program, and Christopher W. Hoene, Executive Director—California Budget & Policy Center, for the Brookings Institution
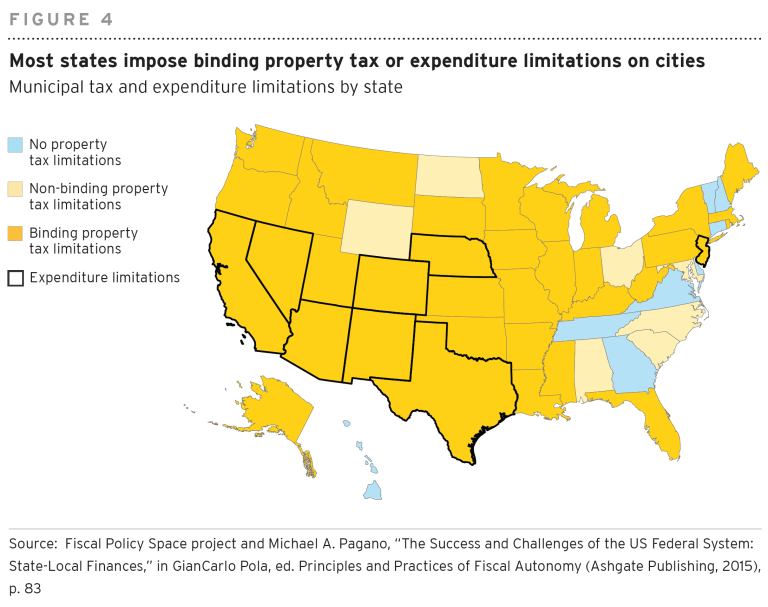
Editor’s Note: Figure 4 of this report was edited on July 19, 2018, to reflect a correction in the tax and expenditure limitations by state.
[in-text-ad]
Cities in the United States are likely to shoulder additional responsibilities during the Trump administration, as federal leaders seek to cut the federal budget and workforce and reduce regulatory authority in Washington. Yet cities’ revenue sources and budgetary constraints vary greatly, shaping their ability to carry out new mandates or raise additional revenues. Some, like Atlanta and Miami, primarily raise revenues through property taxes, while others, like Kansas City and Philadelphia, are authorized by their state governments to collect sales and income taxes as well. Cities in Virginia and Vermont face no property tax or expenditure limitations, while cities in Colorado and California face severe limitations on both tax collections and expenditures. And state funding comprises more than a quarter of municipal budgets in states like Nebraska and New York, but less than seven percent of municipal budgets in Oklahoma and Texas. In other words, given their unique fiscal positions, cities will not respond uniformly to structural shifts—and potential devolution—within American federalism.
To better understand the variation in cities’ fiscal outlooks, this report defines and assesses cities’ fiscal policy space, surveying 100 large cities across four factors:
Key findings are as follows:
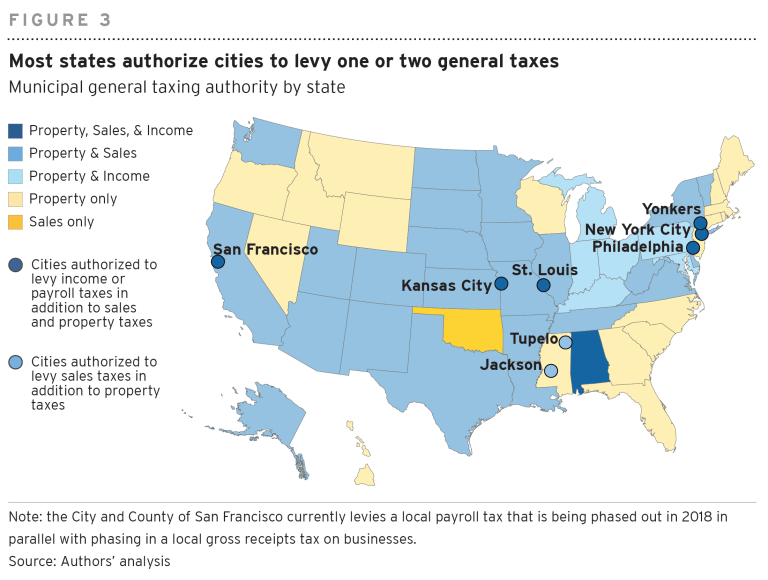
Most states authorize cities to levy one or two general taxes. Some states, particularly concentrated in the Northeast, South, and Mountain West, authorize cities to levy only property taxes to raise revenue, as seen in the map below. Many others authorize cities to levy both property and sales taxes. A number of states in the Great Lakes region authorize cities to levy property and income taxes, but not sales. And a handful of large cities, as well as cities within Alabama, can levy all three general taxes. Generally, more than half of cities within the United States rely primarily on a blend of property and sales tax, in addition to non-tax fees, for revenue.

Most states impose binding property tax or expenditure limitations on cities. Property tax limitations for municipalities, which are enacted by state governments or via ballot referenda, can be considered either “binding” or “non-binding,” depending on the extent of the restrictions. As seen in the map below, a handful of states, including Vermont, New Hampshire, Connecticut, Virginia, Tennessee, and Georgia, impose no property tax limitations. Others, including North Dakota, Nebraska, Maryland, North Carolina, South Carolina, and Alabama, have “non-binding” tax limitations on municipalities. Nearly all of the remaining states impose “binding” property tax limitations, which prevent municipalities from raising rates above a defined threshold. Additionally, many states in the Southwest and West, as well as New Jersey, set strict expenditure limitations on municipalities, capping their total budgets and severely restricting their fiscal positions.
[in-text-ad]

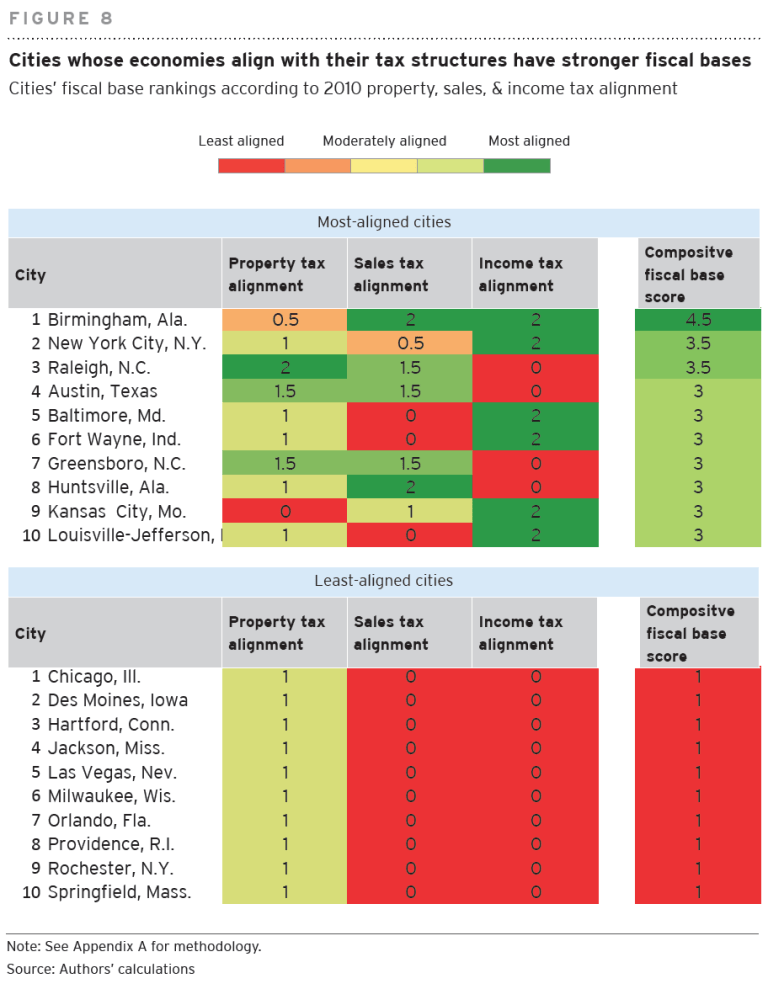
Cities with economies that align with their tax structures have stronger fiscal positions. Municipal budgets are strongest when they have diversified revenue streams and when cities’ taxation system aligns with their economies. A city with high overall property values should ideally have a taxation structure that collects a sizable amount of property tax revenue, just as a city with high rates of retail sales should collect a sizable amount of sales tax. To measure fiscal diversification and alignment, this report scored cities on a scale from 0 to 2 for each of the three general tax categories of property, sales, and income tax. Cities with above-average property values or sales receipts and above-average shares of property tax and sales tax revenue—such as Raleigh and Austin—scored highly. Cities with below-average property values and property tax revenue and that didn’t have authorization to levy sales or incomes taxes—such as Milwaukee and Las Vegas—scored lower. The following chart indicates the highest- and lowest-scoring cities on fiscal base alignment.

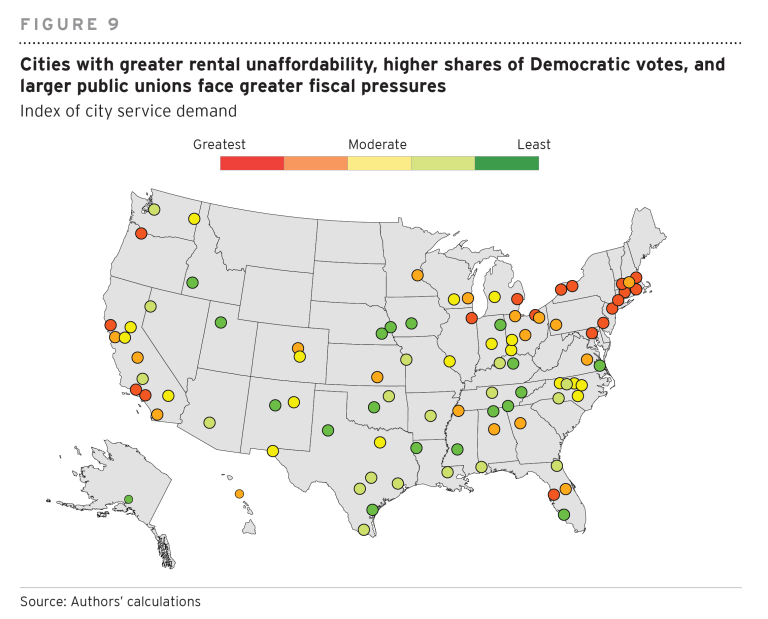
Cities with greater rental unaffordability, higher shares of Democratic voters, and larger public unions face greater fiscal pressures. Past research has correlated these three factors with greater demand for municipal services. As a result, cities with these characteristics are more likely to have experienced expansionary pressures on their budget, and therefore are more likely to have less fiscal space to raise rates further. By contrast, cities with comparatively more rental affordability, conservative voters, and smaller public unions face less expansionary pressure, and—hypothetically, at least—have more fiscal space to raise rates when given additional responsibilities. Assessing sample cities along these three characteristics reveals that cities with the greatest demand for public services tend to be more populous and located in the Northeast, Midwest, or West Coast, as can be seen in the map below. Cities with the least demand for public services tend to be mid-sized and located in the South, Great Plains, and Mountain West.
[in-text-ad]

The Great Recession provides insight into how cities with different fiscal positions may respond to increased responsibilities and pressures under the Trump administration. Through seven case studies of cities ranging from most to least fiscally constrained, this report explores how city leaders responded in times of fiscal pressure. Milwaukee, a severely constrained city, increased its property tax rates as much as possible during the Great Recession, but still faced major budget shortfalls due to declining property values and state funding. The city was forced to undergo hiring freezes and cuts to municipal employee benefits and raise fees for water filtration, parking permits, and other services; the city also received a much-needed infusion of $203 million from the federal stimulus package in 2009. On the other end of the spectrum, Dallas, a less constrained city, raised its property tax rate to counteract a decline in sales and property tax revenues and increased fees for a range of municipal services. The city coupled these revenue adjustments with relatively small cuts to public expenditures and was able to stabilize its budget relatively quickly.
This analysis of cities’ fiscal policy space carries implications for federal, state, and local leaders.
In conclusion, the policy pathways suggested by the fiscal policy space framework—providing greater municipal fiscal autonomy, encouraging cities to better align their tax structures with their underlying economic systems, and reconciling the public’s demand for services with their willingness to pay for them—are not “easy fix” solutions. In fact, these policies would require the reversal of trends that have acted to limit cities’ fiscal policy space over the past several decades. But if cities are to successfully design, fund, and implement policies that provide high-quality educational opportunities, safe streets and neighborhoods, modern transportation networks, affordable housing options, and economic opportunities for all residents, they will need significant fiscal resources and flexibility. This imperative is particularly salient in an era of federal devolution of power and responsibility. Ultimately, expanding the fiscal policy space of cities will serve to increase economic growth, prosperity, and inclusion for the nation as a whole.
Want retirement to come a few years earlier than you’d planned? Or are you ready to retire now, but want an extra set of eyes on your finances?
Now you can speak with up to 3 financial experts in your area for FREE. By simply clicking here you can begin to match with financial professionals who can help you build your plan to retire early. And the best part? The first conversation with them is free.
Click here to match with up to 3 financial pros who would be excited to help you make financial decisions.
Have questions about retirement or personal finance? Email us at [email protected]!
By emailing your questions to 24/7 Wall St., you agree to have them published anonymously on a673b.bigscoots-temp.com.
By submitting your story, you understand and agree that we may use your story, or versions of it, in all media and platforms, including via third parties.
Thank you for reading! Have some feedback for us?
Contact the 24/7 Wall St. editorial team.