24/7 Wall St. Insights
- Inflation has impacted every American in recent years, but still, how much Americans spend for similar goods and services can vary meaningfully, depending on where they live.
- In dozens of counties across the United States, the overall cost of living exceeds the national average by well over 10%.
- Also: 2 Dividend Legends To Hold Forever
The cost of living in the United States has been rising at a historic pace in recent years. Inflation, as measured by the Consumer Price Index, has exceeded the Federal Reserve’s 2.0% target rate every month since March 2021. Though the CPI is down from the multi-decade high of 9.1% reported in June 2022, at 2.6%, it remains elevated — and millions of American households are feeling the pinch.
According to a survey published by the U.S. Census Bureau in early October, just over 60% of adults reported at least some recent difficulty paying for usual household expenses — and more than 93% of adults who were aware of rising consumer prices reported a related increase in stress levels.
The factors driving the surge in prices are varied and complex, but some of the most commonly cited culprits include pandemic related supply constraints and increased consumer demand. But while the detrimental effects of these conditions have softened since the pandemic, similar market forces contribute to far more deeply entrenched variations in the cost of living between American communities. And some parts of the country have long stood out for their extraordinarily high cost of living.
Using data from the U.S. Department of Commerce, 24/7 Wall St. identified the most expensive U.S. counties to live in. The 50 counties on this list are ranked on estimated regional price parity — a measure of the cost of living relative to the national average. Supplemental data on median household income, median home value, and population are five-year estimates from the U.S. Census Bureau’s 2022 American Community Survey.
Among the counties on this list, the average cost of living is anywhere from 11.6% to over 30% higher than it is on average nationwide. Higher consumer prices in these areas are driven, in part, by consumer demand and limited supply — particularly in relation to housing.
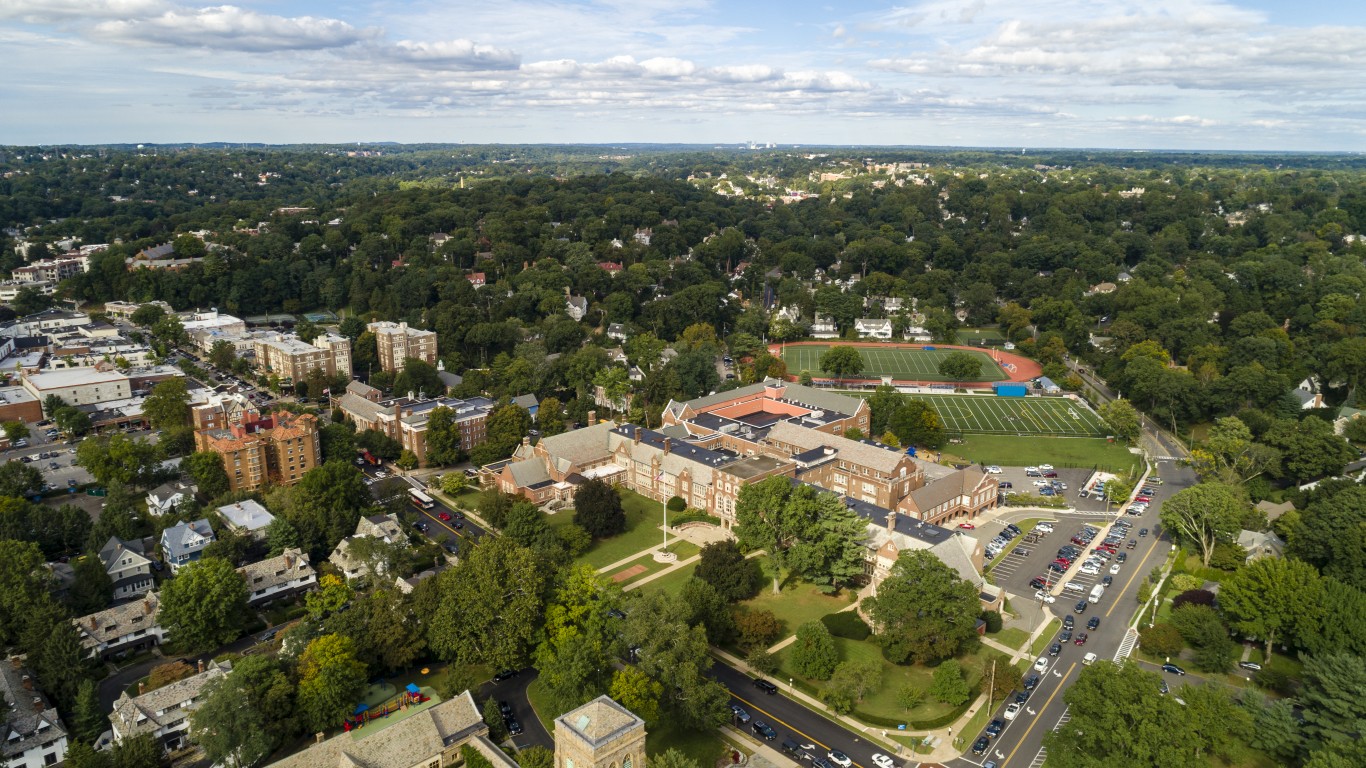
Many of these counties are located in major urban areas, including several in the greater Boston, New York, San Francisco, and Washington, D.C. metro areas. In these densely populated places, the real estate available for housing is often limited. With restrained housing supply and large populations driving demand — many counties on this list are home to over 1 million people — housing is not cheap. Among these counties, the typical home is worth anywhere from about $368,200 to more than $1.4 million. For context, the median home value nationwide is just $281,900, according to 2022 ACS estimates. (Here is a look at the cities Americans are flocking to.)
It is no coincidence that these same places are also home to relatively high-earning populations. Higher incomes often translate to greater consumer spending, which can, in turn, drive up the price of goods and services. The typical American household earns about $75,150 per year, and in all but two counties on this list, the median household income exceeds that amount — in most cases, by over $35,000. In many cases, higher median incomes in these counties are more than enough to offset higher consumer prices. (This is the income you need to comfortably afford a typical American home.)
These are the most expensive U.S. counties to live in.
Why It Matters

For years, the rapidly rising prices have been top of mind for millions of Americans. But while no corner of the country was spared from the effects of inflation, there are specific places where longstanding, deeply entrenched supply and demand dynamics have pushed the cost of living well above what most Americans are accustomed to. Of the more than 3,000 counties or county equivalents in the U.S., there are only a few dozen where goods and services are over 11% more expensive than they are nationwide.
50. Newport County, Rhode Island

- Est. cost of living in county: 11.57% more expensive than US avg.
- Median annual household income: $96,319 ($21,170 higher than US median)
- Median home value: $503,700 ($221,800 higher than US median)
- County population: 85,442
49. Santa Barbara County, California
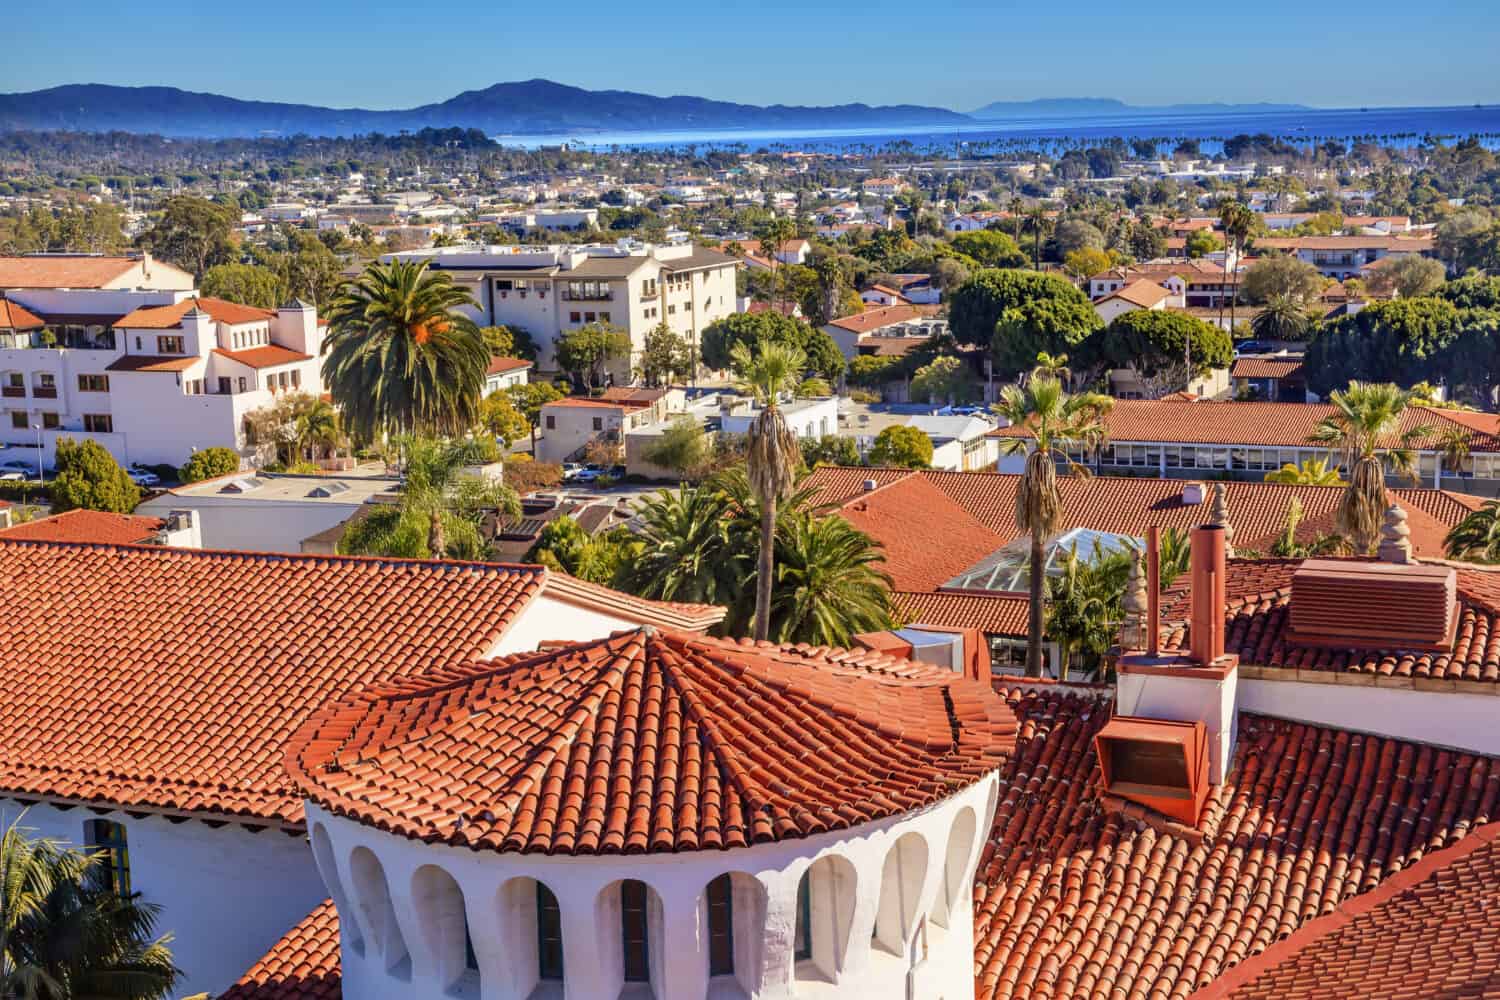
- Est. cost of living in county: 11.82% more expensive than US avg.
- Median annual household income: $92,332 ($17,183 higher than US median)
- Median home value: $714,800 ($432,900 higher than US median)
- County population: 445,213
48. Santa Clara County, California

- Est. cost of living in county: 12.02% more expensive than US avg.
- Median annual household income: $153,792 ($78,643 higher than US median)
- Median home value: $1,316,800 ($1,034,900 higher than US median)
- County population: 1,916,831
47. El Dorado County, California

- Est. cost of living in county: 12.03% more expensive than US avg.
- Median annual household income: $99,246 ($24,097 higher than US median)
- Median home value: $597,600 ($315,700 higher than US median)
- County population: 191,713
46. Los Angeles County, California
- Est. cost of living in county: 12.11% more expensive than US avg.
- Median annual household income: $83,411 ($8,262 higher than US median)
- Median home value: $732,200 ($450,300 higher than US median)
- County population: 9,936,690
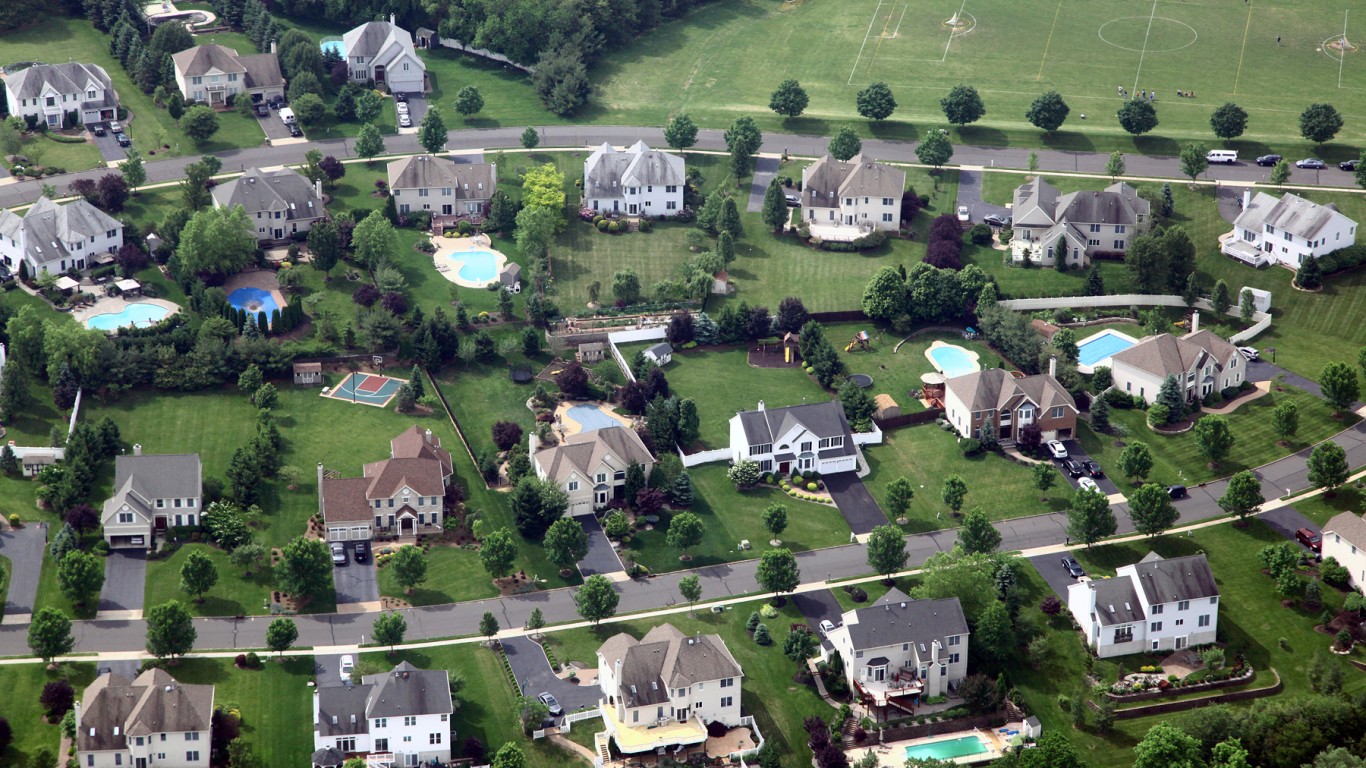
45. Monmouth County, New Jersey

- Est. cost of living in county: 12.14% more expensive than US avg.
- Median annual household income: $118,527 ($43,378 higher than US median)
- Median home value: $519,300 ($237,400 higher than US median)
- County population: 643,064
44. Broomfield County, Colorado
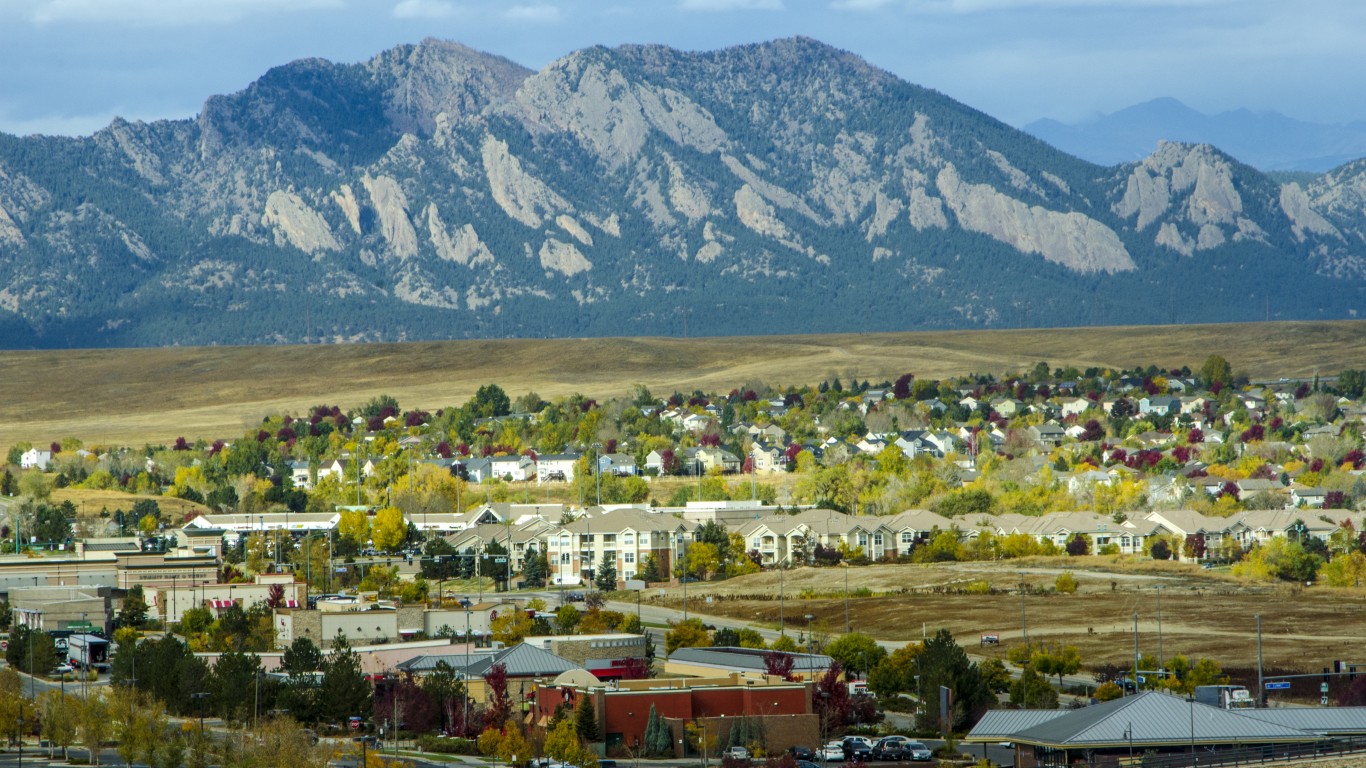
- Est. cost of living in county: 12.27% more expensive than US avg.
- Median annual household income: $117,541 ($42,392 higher than US median)
- Median home value: $581,600 ($299,700 higher than US median)
- County population: 73,946
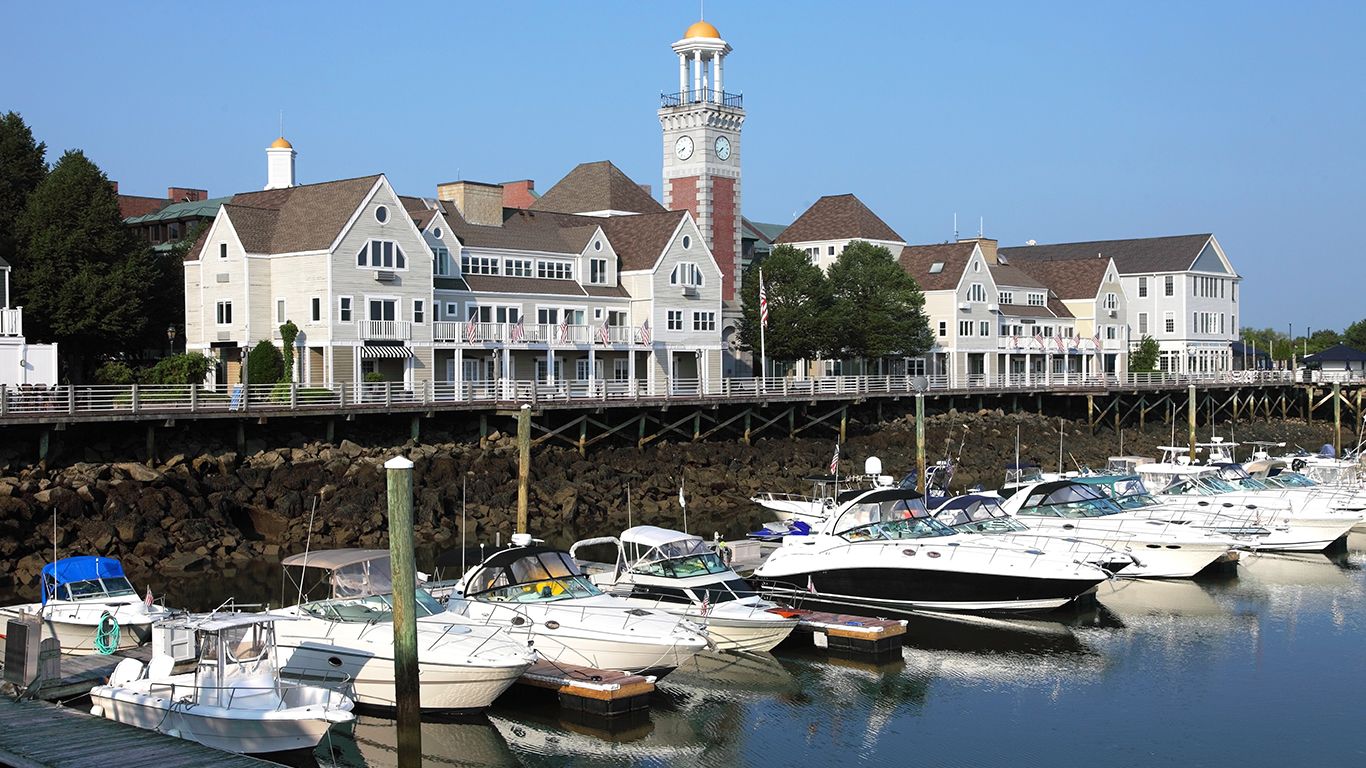
43. Suffolk County, Massachusetts

- Est. cost of living in county: 12.30% more expensive than US avg.
- Median annual household income: $87,669 ($12,520 higher than US median)
- Median home value: $650,900 ($369,000 higher than US median)
- County population: 785,443
42. Snohomish County, Washington

- Est. cost of living in county: 12.39% more expensive than US avg.
- Median annual household income: $104,083 ($28,934 higher than US median)
- Median home value: $592,800 ($310,900 higher than US median)
- County population: 828,337
41. Nevada County, California

- Est. cost of living in county: 12.43% more expensive than US avg.
- Median annual household income: $79,395 ($4,246 higher than US median)
- Median home value: $559,700 ($277,800 higher than US median)
- County population: 102,322
40. Napa County, California

- Est. cost of living in county: 12.49% more expensive than US avg.
- Median annual household income: $105,809 ($30,660 higher than US median)
- Median home value: $794,500 ($512,600 higher than US median)
- County population: 137,384
39. Middlesex County, Massachusetts

- Est. cost of living in county: 12.53% more expensive than US avg.
- Median annual household income: $121,304 ($46,155 higher than US median)
- Median home value: $654,300 ($372,400 higher than US median)
- County population: 1,623,109
38. Richmond County, New York

- Est. cost of living in county: 12.57% more expensive than US avg.
- Median annual household income: $96,185 ($21,036 higher than US median)
- Median home value: $637,100 ($355,200 higher than US median)
- County population: 492,925
37. Somerset County, New Jersey
- Est. cost of living in county: 12.61% more expensive than US avg.
- Median annual household income: $131,948 ($56,799 higher than US median)
- Median home value: $489,500 ($207,600 higher than US median)
- County population: 344,978
36. Washington, District of Columbia

- Est. cost of living in county: 12.70% more expensive than US avg.
- Median annual household income: $101,722 ($26,573 higher than US median)
- Median home value: $705,000 ($423,100 higher than US median)
- County population: 670,587
35. Howard County, Maryland

- Est. cost of living in county: 13.15% more expensive than US avg.
- Median annual household income: $140,971 ($65,822 higher than US median)
- Median home value: $551,300 ($269,400 higher than US median)
- County population: 332,011
34. Placer County, California

- Est. cost of living in county: 13.60% more expensive than US avg.
- Median annual household income: $109,375 ($34,226 higher than US median)
- Median home value: $627,100 ($345,200 higher than US median)
- County population: 406,608
33. Norfolk County, Massachusetts

- Est. cost of living in county: 13.63% more expensive than US avg.
- Median annual household income: $120,621 ($45,472 higher than US median)
- Median home value: $612,100 ($330,200 higher than US median)
- County population: 722,112
32. Bergen County, New Jersey

- Est. cost of living in county: 13.74% more expensive than US avg.
- Median annual household income: $118,714 ($43,565 higher than US median)
- Median home value: $561,500 ($279,600 higher than US median)
- County population: 953,243
31. Honolulu County, Hawaii

- Est. cost of living in county: 14.03% more expensive than US avg.
- Median annual household income: $99,816 ($24,667 higher than US median)
- Median home value: $832,200 ($550,300 higher than US median)
- County population: 1,010,100
30. Summit County, Colorado

- Est. cost of living in county: 14.08% more expensive than US avg.
- Median annual household income: $100,611 ($25,462 higher than US median)
- Median home value: $760,000 ($478,100 higher than US median)
- County population: 30,955
29. Montgomery County, Maryland

- Est. cost of living in county: 14.34% more expensive than US avg.
- Median annual household income: $125,583 ($50,434 higher than US median)
- Median home value: $588,900 ($307,000 higher than US median)
- County population: 1,056,910
28. Contra Costa County, California

- Est. cost of living in county: 14.97% more expensive than US avg.
- Median annual household income: $120,020 ($44,871 higher than US median)
- Median home value: $787,300 ($505,400 higher than US median)
- County population: 1,162,648
27. San Diego County, California
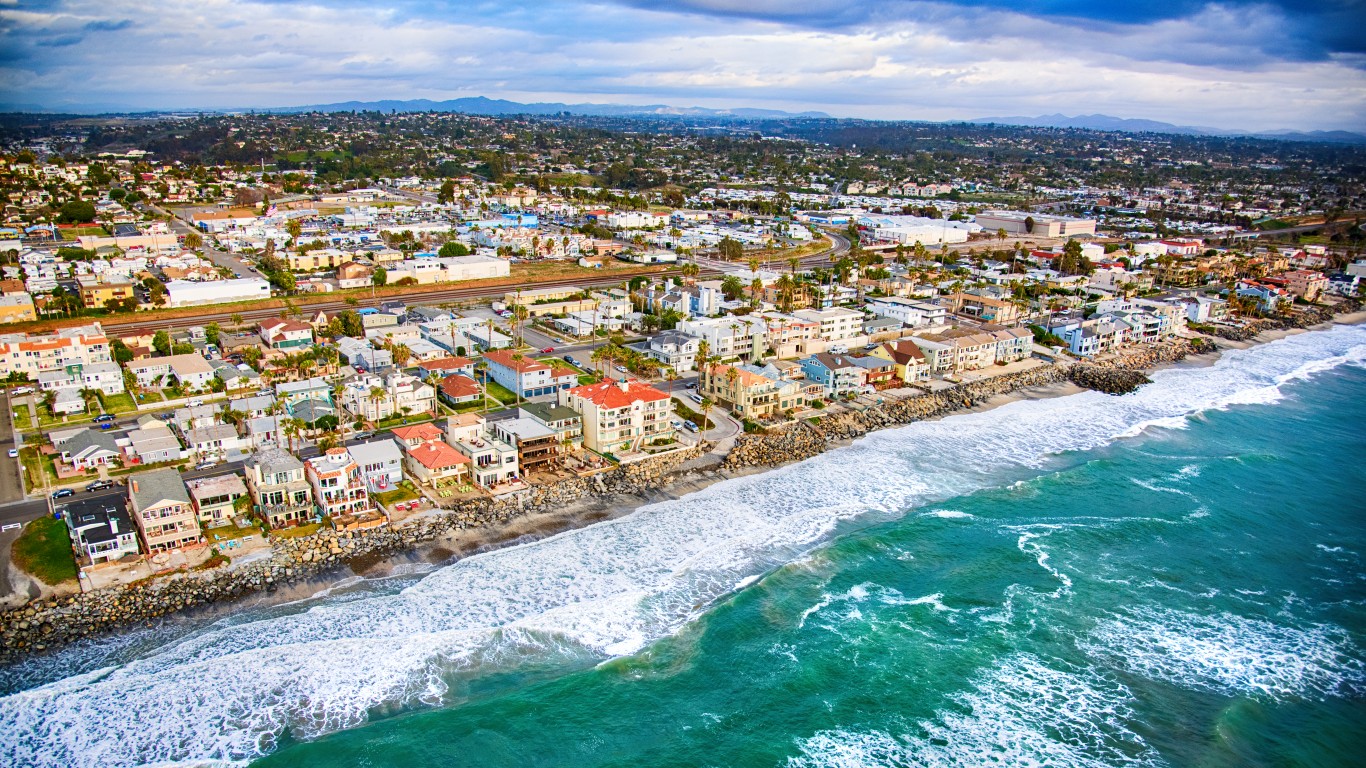
- Est. cost of living in county: 15.09% more expensive than US avg.
- Median annual household income: $96,974 ($21,825 higher than US median)
- Median home value: $725,200 ($443,300 higher than US median)
- County population: 3,289,701
26. Loudoun County, Virginia
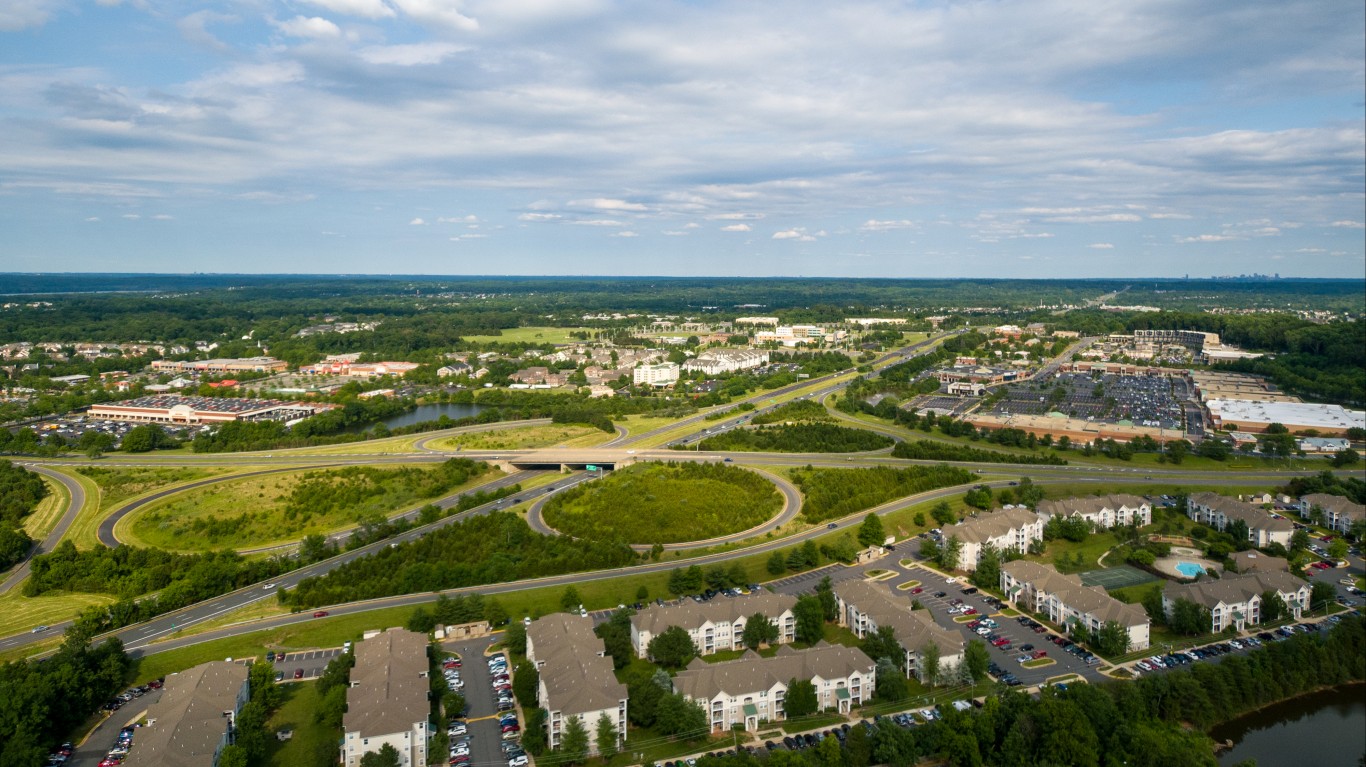
- Est. cost of living in county: 15.25% more expensive than US avg.
- Median annual household income: $170,463 ($95,314 higher than US median)
- Median home value: $657,000 ($375,100 higher than US median)
- County population: 420,773
25. Queens County, New York

- Est. cost of living in county: 15.35% more expensive than US avg.
- Median annual household income: $82,431 ($7,282 higher than US median)
- Median home value: $677,700 ($395,800 higher than US median)
- County population: 2,360,826
24. Morris County, New Jersey

- Est. cost of living in county: 15.57% more expensive than US avg.
- Median annual household income: $130,808 ($55,659 higher than US median)
- Median home value: $531,800 ($249,900 higher than US median)
- County population: 508,816
23. Kings County, New York

- Est. cost of living in county: 15.90% more expensive than US avg.
- Median annual household income: $74,692 ($457 lower than US median)
- Median home value: $865,300 ($583,400 higher than US median)
- County population: 2,679,620
22. Fairfax city, Virginia

- Est. cost of living in county: 15.93% more expensive than US avg.
- Median annual household income: $128,708 ($53,559 higher than US median)
- Median home value: $649,600 ($367,700 higher than US median)
- County population: 24,242
21. Douglas County, Colorado

- Est. cost of living in county: 16.16% more expensive than US avg.
- Median annual household income: $139,010 ($63,861 higher than US median)
- Median home value: $635,100 ($353,200 higher than US median)
- County population: 360,206
20. Westchester County, New York
- Est. cost of living in county: 16.68% more expensive than US avg.
- Median annual household income: $114,651 ($39,502 higher than US median)
- Median home value: $619,000 ($337,100 higher than US median)
- County population: 997,904
19. Putnam County, New York

- Est. cost of living in county: 16.97% more expensive than US avg.
- Median annual household income: $120,970 ($45,821 higher than US median)
- Median home value: $421,800 ($139,900 higher than US median)
- County population: 97,942
18. Alameda County, California

- Est. cost of living in county: 17.08% more expensive than US avg.
- Median annual household income: $122,488 ($47,339 higher than US median)
- Median home value: $999,200 ($717,300 higher than US median)
- County population: 1,663,823
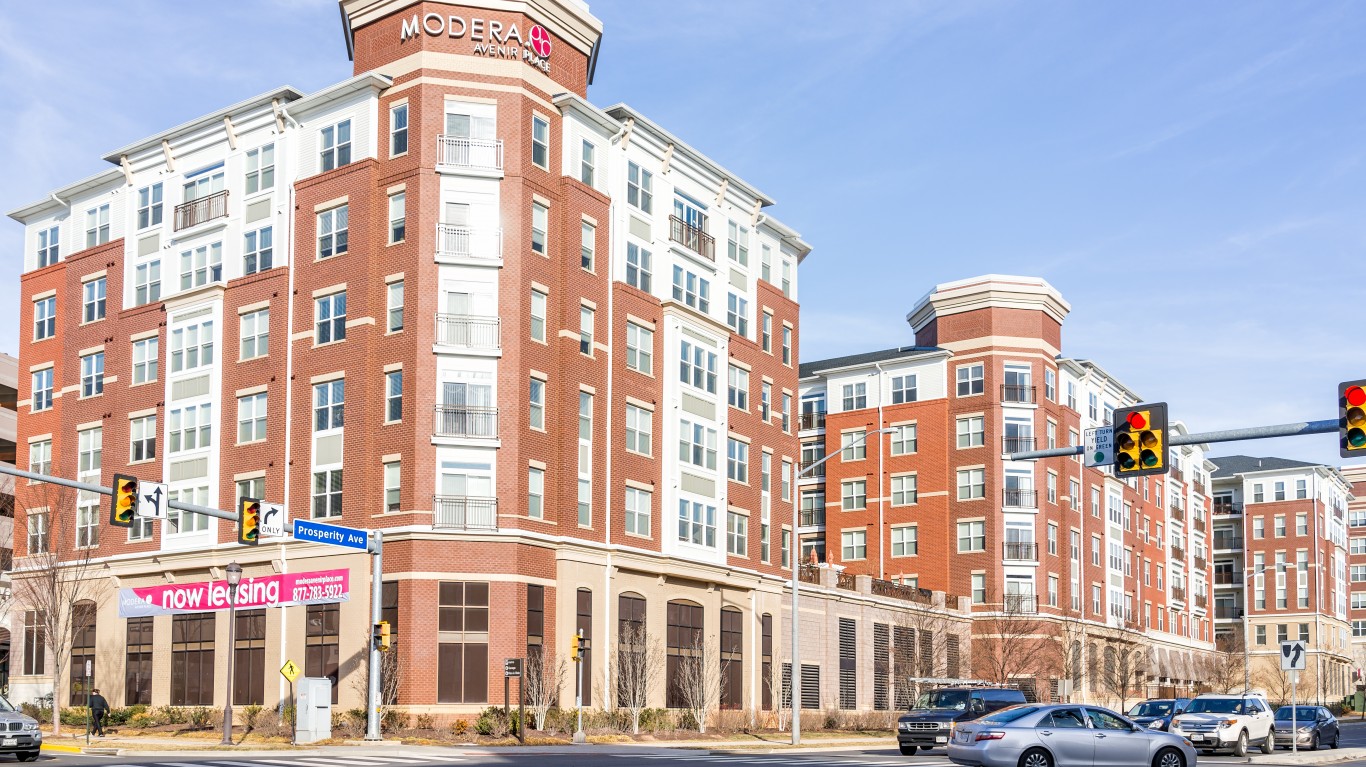
17. Fairfax County, Virginia

- Est. cost of living in county: 17.52% more expensive than US avg.
- Median annual household income: $145,165 ($70,016 higher than US median)
- Median home value: $666,900 ($385,000 higher than US median)
- County population: 1,145,354
16. Kalawao County, Hawaii

- Est. cost of living in county: 17.53% more expensive than US avg.
- Median annual household income: $87,813 ($12,664 higher than US median)
- Median home value: N/A
- County population: 50
15. King County, Washington

- Est. cost of living in county: 17.81% more expensive than US avg.
- Median annual household income: $116,340 ($41,191 higher than US median)
- Median home value: $761,500 ($479,600 higher than US median)
- County population: 2,254,371
14. Suffolk County, New York

- Est. cost of living in county: 18.06% more expensive than US avg.
- Median annual household income: $122,498 ($47,349 higher than US median)
- Median home value: $490,800 ($208,900 higher than US median)
- County population: 1,524,486
13. Alpine County, California

- Est. cost of living in county: 18.83% more expensive than US avg.
- Median annual household income: $101,125 ($25,976 higher than US median)
- Median home value: $463,900 ($182,000 higher than US median)
- County population: 1,515
12. Monroe County, Florida
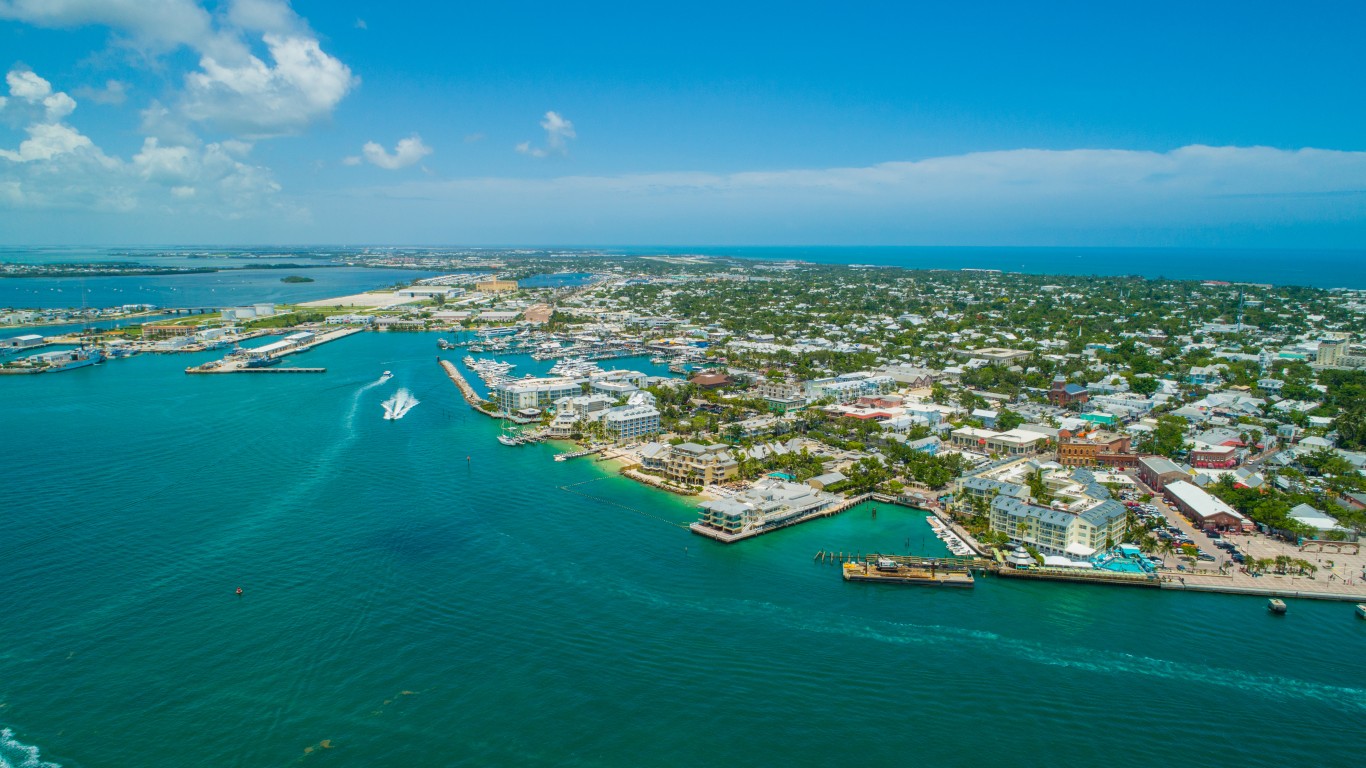
- Est. cost of living in county: 18.88% more expensive than US avg.
- Median annual household income: $80,111 ($4,962 higher than US median)
- Median home value: $696,900 ($415,000 higher than US median)
- County population: 82,044
11. Alexandria city, Virginia

- Est. cost of living in county: 19.86% more expensive than US avg.
- Median annual household income: $113,179 ($38,030 higher than US median)
- Median home value: $655,700 ($373,800 higher than US median)
- County population: 157,594
10. Falls Church city, Virginia
- Est. cost of living in county: 20.16% more expensive than US avg.
- Median annual household income: $164,536 ($89,387 higher than US median)
- Median home value: $938,500 ($656,600 higher than US median)
- County population: 14,576
9. Orange County, California

- Est. cost of living in county: 20.30% more expensive than US avg.
- Median annual household income: $109,361 ($34,212 higher than US median)
- Median home value: $862,900 ($581,000 higher than US median)
- County population: 3,175,227
8. Nassau County, New York

- Est. cost of living in county: 20.57% more expensive than US avg.
- Median annual household income: $137,709 ($62,560 higher than US median)
- Median home value: $633,800 ($351,900 higher than US median)
- County population: 1,389,160
7. Crook County, Oregon

- Est. cost of living in county: 22.59% more expensive than US avg.
- Median annual household income: $74,969 ($180 lower than US median)
- Median home value: $368,200 ($86,300 higher than US median)
- County population: 24,987
6. San Francisco County, California

- Est. cost of living in county: 23.26% more expensive than US avg.
- Median annual household income: $136,689 ($61,540 higher than US median)
- Median home value: $1,348,700 ($1,066,800 higher than US median)
- County population: 851,036
5. Arlington County, Virginia

- Est. cost of living in county: 25.16% more expensive than US avg.
- Median annual household income: $137,387 ($62,238 higher than US median)
- Median home value: $833,300 ($551,400 higher than US median)
- County population: 235,845
4. Marin County, California

- Est. cost of living in county: 27.24% more expensive than US avg.
- Median annual household income: $142,019 ($66,870 higher than US median)
- Median home value: $1,291,800 ($1,009,900 higher than US median)
- County population: 260,485
3. San Mateo County, California

- Est. cost of living in county: 27.74% more expensive than US avg.
- Median annual household income: $149,907 ($74,758 higher than US median)
- Median home value: $1,441,300 ($1,159,400 higher than US median)
- County population: 754,250
2. Leelanau County, Michigan

- Est. cost of living in county: 30.89% more expensive than US avg.
- Median annual household income: $82,345 ($7,196 higher than US median)
- Median home value: $371,200 ($89,300 higher than US median)
- County population: 22,426
1. New York County, New York

- Est. cost of living in county: 32.61% more expensive than US avg.
- Median annual household income: $99,880 ($24,731 higher than US median)
- Median home value: $1,104,000 ($822,100 higher than US median)
- County population: 1,645,867