Getting older is not for the faint of heart. Along with the myriad things that were once easy and are now not so easy, there are the inevitable concerns about having enough savings and other retirement income to cover routine things like food, shelter and clothing, along with stuff we didn’t often think about such as medical expenses and, should it become necessary, the costs for getting help with day-to-day activities.
According to the U.S. Bureau of Labor Statistics, 153.5 million Americans over the age of 16 were employed in November 2009. By November of 2019, that number had risen to more than 164 million. The number of employed Americans over the age of 65 rose from 6.7 million to more than 11 million. About half the employment gains over that time span are down to older Americans working longer. Because of the medical, social, and financial consequences of entering old age, life can change dramatically in retirement — here are best places to retire in every state.
Some are working longer because they want to and some because they have to. In either case, holding on to a job gets tougher as a person gets older. For one thing, company cost-cutting can land hard on older, more experienced and better-paid employees. For another, if an older employee is let go, that employee has a harder time finding another job.
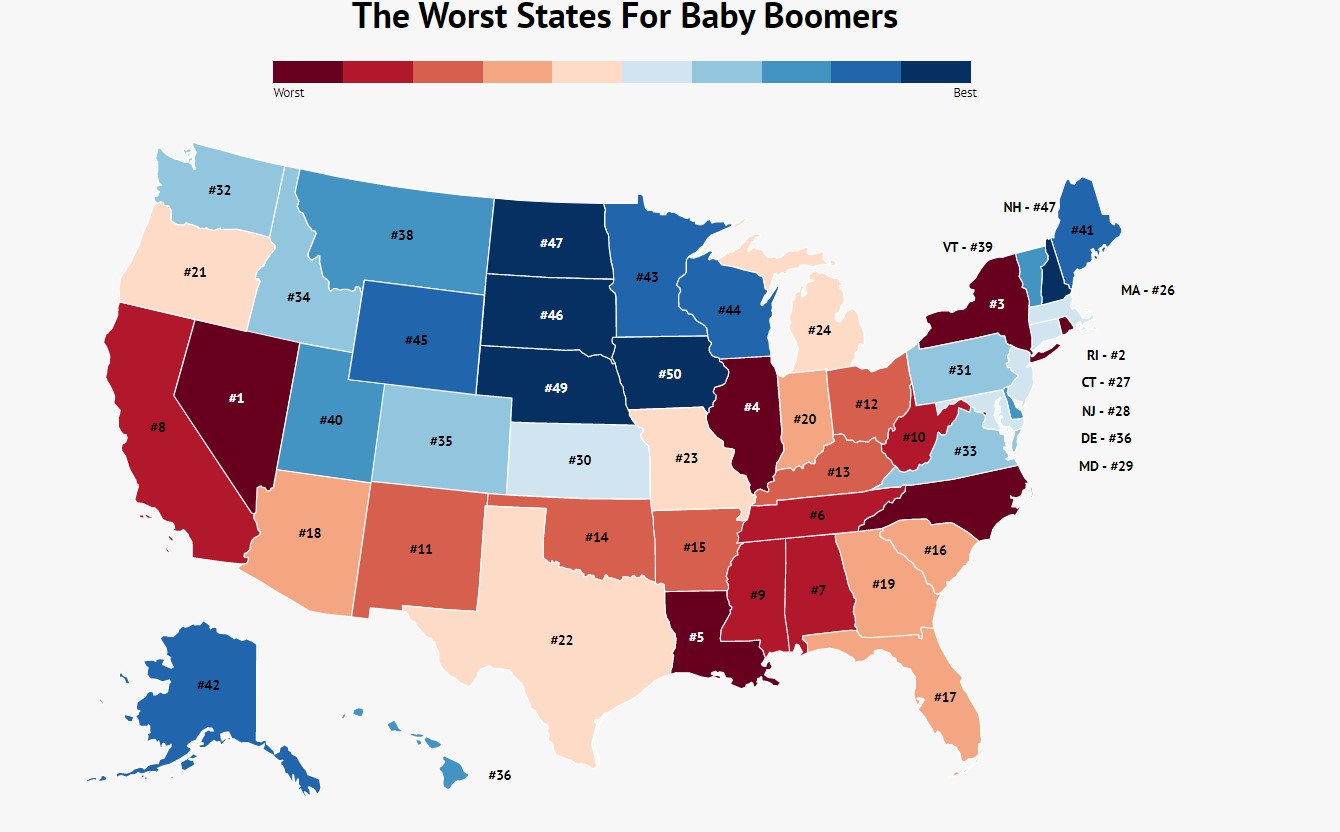
Online career search firm Zippia looked at state-by-state data to identify the worst states for baby boomers to retire in. The firm ranked all 50 states on each of five metrics: average retirement savings, state well-being, boomer unemployment rate, the percentage of boomers with a mortgage and the percentage of boomers living in poverty. The unemployment, mortgage and poverty data were culled from the Census Bureau’s 2018 American Community Survey. Well-being data came from the Gallup Health and Well-Being Report, and for average retirement savings it used data from Personal Capital.
Here are the 10 states that are the worst for boomers.
| Unemployed | Mortgages | Poverty rate | Savings | Well-Being | |
|---|---|---|---|---|---|
| Nevada | 4.20% | 60% | 10% | $183,946 | 19 |
| Rhode Island | 4.30% | 63% | 9% | $202,862 | 25 |
| New York | 3.60% | 52% | 11% | $207,889 | 37 |
| Illinois | 4.10% | 54% | 9% | $223,238 | 42 |
| Louisiana | 3.50% | 41% | 13% | $198,337 | 43 |
| Tennessee | 3.00% | 48% | 10% | $188,818 | 46 |
| Alabama | 2.80% | 48% | 12% | $191,599 | 44 |
| California | 3.90% | 66% | 10% | $227,290 | 14 |
| Mississippi | 2.90% | 39% | 14% | $201,989 | 47 |
| West Virginia | 3.00% | 38% | 12% | $211,086 | 50 |
The following map from Zippia shows how all 50 states rank for boomers. We’ve also done a more detailed ranking of what it costs to retire comfortably in every state.
Take This Retirement Quiz To Get Matched With An Advisor Now (Sponsored)
Are you ready for retirement? Planning for retirement can be overwhelming, that’s why it could be a good idea to speak to a fiduciary financial advisor about your goals today.
Start by taking this retirement quiz right here from SmartAsset that will match you with up to 3 financial advisors that serve your area and beyond in 5 minutes. Smart Asset is now matching over 50,000 people a month.
Click here now to get started.
Thank you for reading! Have some feedback for us?
Contact the 24/7 Wall St. editorial team.


