
Last year, some 34 million Americans lived in poverty, a decline of 4.2 million from 2018. The poverty rate fell from 11.8% in 2018 to 10.5%, the lowest level since estimates were first published in 1959.
The weighted average poverty threshold for last year for a family unit of four people was $26,370. If such a family earned less than that amount, that family and every person in it was considered to be in poverty.
The data is reported in the latest edition of the U.S. Census Bureau’s Current Population Reports, titled Income and Poverty in the United States: 2019, published this month.
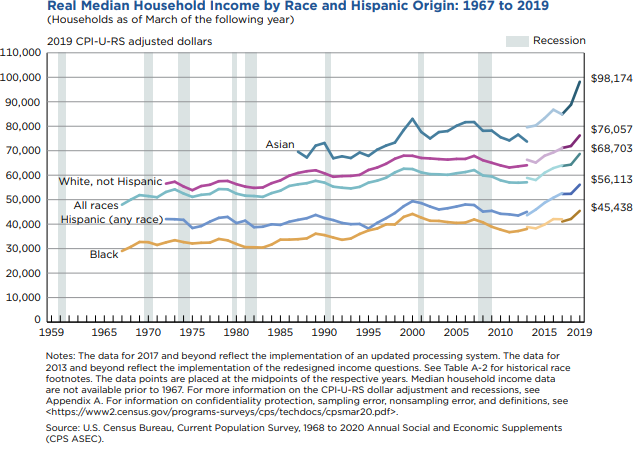
Real (inflation-adjusted) median household income last year rose 6.8% from $64,324 in 2018 to $68,703. Real median earnings for all workers rose by 1.4% year over year in 2019 and by 0.8% for full-time, year-round workers.
[nativounit]
Men with full-time year-round jobs had real median earnings of $57,456, an increase of 2.1% from 2018. Women with the same jobs posted real median earnings of $47,299, a year-over-year increase of 3.0%. Women earned about $0.82 for every dollar men earned, statistically flat compared to 2018.
Real median incomes for white, Black, Asian and Hispanic households all rose year over year as well. Among these groups, a median Asian household had an income level 1.29 times than of a non-Hispanic white household. A median Hispanic household earned 74% as much as a non-Hispanic white household, and a Black household earned just 60% of white households’ earnings.
Household income increased year over year at every percentile in 2019. In the lowest quintile, the income limit was $28,084 compared to a limit of $53,503 in the second quintile, $86,488 in the third quintile, $142,501 in the fourth quintile and $142,502 or more in the top quintile. The top 5% of households had income of $270,003 or more, an amount equal to 23% of all household income in 2019.
The first quintile earned 3.1% of total 2019 household income, the second quintile earned 8.3%, the third earned 14.1%, the fourth earned 22.7% and the fifth earned 51.9%. That means that the top 20% of U.S. households earned more than half of all household income in 2019. Since 2007, the top quintile of incomes consistently has earned 50.0% or more of all household income.
Between 2018 and 2019, the poverty rate fell by 2.0 percentage points to 18.8% for Black Americans, by 1.8 points to 15.7% for all Hispanics and by 2.8 points for Asian Americans and 0.8 points for white non-Hispanics. The latter two groups posted a poverty rate of 7.3% in 2019.
In 2019, non-Hispanic whites accounted for 59.9% of the total U.S. population and 41.6% of the people in poverty. Black Americans accounted for 13.2% of the total population and 23.8% of the people in poverty. Hispanics accounted for 18.7% of the total population and 28.1% of the people in poverty. Asian Americans accounted for 6.1% of the total population and 4.3% of the people in poverty.
Poverty is also spread unevenly among the states and among cities in the states. In most states, there is one city where poverty is heavily concentrated.
[recirclink id=738050][wallst_email_signup]