In the nation’s ongoing pursuit of racial equality, 2020 has been a year of reckoning. A series of high-profile police killings of unarmed Black Americans sparked protest demonstrations in over 100 U.S. cities and forced a broad acknowledgment of existing racial inequalities in the United States. And the facts are sobering.
Across the country, Black Americans are more than twice as likely as white Americans to live below the poverty line. In the labor force, Black workers are more than twice as likely as whites to be unemployed. Black people in the United States also are far less likely to have a college education or own a home than white Americans. As stark as these disparities are, in some U.S. cities, they are far worse.
Using metro area level data, 24/7 Wall St. created an index measuring racial disparities in income, education, health, incarceration and other socioeconomic measures to determine the worst cities for Black Americans.
Racial inequalities in the United States are largely a byproduct of institutionalized racism established centuries ago. Many racist policies in the country were legal just decades ago. Other policies and practices are still in existence and continue to lead to unequal effects of the law on Black and white Americans. In many cities on this list, racist housing covenants forbade Black homeownership in certain neighborhoods. Redlining policies made it difficult for Black families to secure mortgage loans, limiting homeownership opportunities and with it a means of building intergenerational wealth.
Although practices such as these were outlawed in the 1960s (in some places in the ’70s), they were in place long enough to entrench racial segregation. Such segregation often results in disparities on multiple fronts, including education, employment opportunities, policing and access to health care services. The detrimental effects of segregation are evident in every city on this list. Here is a look at the 25 most segregated cities in America.
It is important to note that the cities on this list are those in which the relative differences in social and economic outcomes between white and Black residents are most profound. These are not necessarily the cities where conditions are the worst for Black residents in an absolute sense, as in those places social and economic outcomes tend to be below average for all residents, regardless of race. Here is a look at the each state’s worst city to live in.
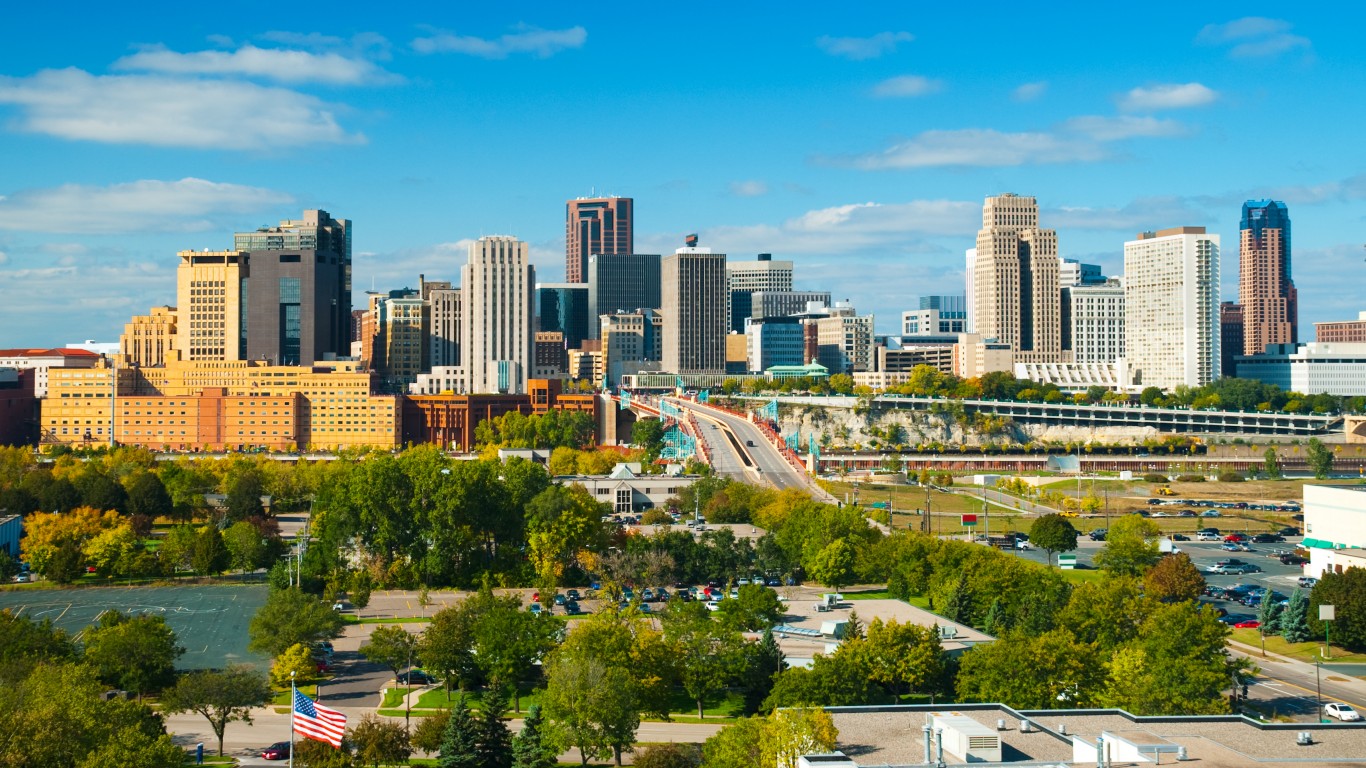
St. Cloud, Minnesota, has a Black population of 10,370, which is 5.3% of its total. Unemployment among Black workers is 17.4%, compared to 3.7% among whites. The city has the worst socioeconomic disparities along racial lines of any U.S. metro area. Homeownership is a practical way to build intergenerational wealth, and in St. Cloud, the Black homeownership rate is just 9.3%, compared to the 72.4% white homeownership rate. Differences in income are also pronounced. The typical Black household earns just $23,790 a year, while most white households earn over $62,000 annually. Also, Black St. Cloud workers are nearly five times more likely to be unemployed and Black residents are five times more likely to live below the poverty line than their white counterparts are.
Many of St. Cloud’s Black residents are newly settled immigrants and refugees. Over the past three decades, the city has seen an influx of new residents from East Africa.
Methodology
To determine the 15 worst cities for Black Americans, 24/7 Wall St. created an index of eight variables measuring racial socioeconomic gaps in each of the nation’s 383 metropolitan areas. For each city, we evaluated the gap between white and Black residents in poverty, education, income, homeownership, unemployment, mortality and incarceration.
Creating the index in this way means cities were ranked on relative differences between Black and white residents, and not on absolute levels of socioeconomic development, which, if used instead for the ranking, would result in a list of cities with the worst social and economic measures for anyone regardless of race.
For each measure, we constructed an index of the gaps between Black and white Americans. The index was standardized using interdecile normalization so outliers in the data did not skew results.
We excluded metro areas where Black residents comprise less than 5% of the population or where data limitations made comparisons between racial groups impossible.
Within the index, we considered data from the U.S. Census Bureau’s 2018 American Community Survey on median household income, poverty, adult high school and bachelor’s degree attainment, homeownership, and unemployment for each racial group. All ACS data are five-year estimates for 2018.
Data on the number of prisoners in state or federal correctional facilities by race are for 2019 and came from the Bureau of Justice Statistics. These statistics were adjusted for population using ACS data. Because states, rather than metro areas, are responsible for the prison population, incarceration rates are for the state where the metro area is located. If a metro area spans more than one state, we used the state in which the metro area’s principal city is located.
We also included age-adjusted mortality rates for the years 2016 to 2018 from the Centers for Disease Control and Prevention. We aggregated mortality rates from the county to the metropolitan level using boundary definitions from the Census Bureau. Incarceration and mortality rates are per 100,000 residents.
 24/7 Wall St.
Get Ready To Retire (Sponsored)
Start by taking a quick retirement quiz from SmartAsset that will match you with up to 3 financial advisors that serve your area and beyond in 5 minutes, or less.
Each advisor has been vetted by SmartAsset and is held to a fiduciary standard to act in your best interests.
Here’s how it works:
1. Answer SmartAsset advisor match quiz
2. Review your pre-screened matches at your leisure. Check out the advisors’ profiles.
3. Speak with advisors at no cost to you. Have an introductory call on the phone or introduction in person and choose whom to work with in the future
Thank you for reading! Have some feedback for us?
Contact the 24/7 Wall St. editorial team.
Latest from 24/7


Our expert who first called NVIDIA in 2009 is predicting 2025 will see a historic AI breakthrough.
You can follow him investing $500,000 of his own money on our top AI stocks for free.