Compared to the rest of the world, the United States has a relatively high standard of living. However, in a country home to over 328 million people spanning nearly 3.8 million square miles, there are outliers — places where quality of life has been eroded by any number of economic and historical forces.
While there are countless factors — many of them subjective — that can contribute to or detract from quality of life, there are a few key objective measures that can reveal a great deal about a given area. The United Nations Development Programme identified some of these measures and created the Human Development Index, a tool to gauge and compare prosperity at a national level from a holistic perspective.
Inspired by the HDI, 24/7 Wall St. created an index of three measures — poverty, life expectancy at birth, and bachelor’s degree attainment — to identify the worst U.S. county to live in.
The three measures used to create the list of finalists are closely related to each other. People living in poverty are often less able to afford health care or healthy lifestyles, both of which can have serious health repercussions. Similarly, higher educational attainment has been shown to improve health outcomes and reduce the likelihood of unemployment and financial hardship. Both high poverty rates and low educational attainment rates are common in parts of the U.S. with low life expectancy at birth.
Many of the counties on the list of finalists are in rural Appalachian coal country — an area that has been economically decimated by the decline of coal mining in the United States. Once an economic pillar in communities across West Virginia and Kentucky, coal production has precipitously declined in these areas as the U.S. power grid moves away from coal and relies more on cleaner burning natural gas and renewable energy sources.
Most of the remaining counties on the list of finalists are located in or around American Indian reservations. Native Americans commonly face generational poverty resulting, in part, from their historical mistreatment by the U.S. government. Certain existing conditions in some reservations also affect upward economic mobility. For example, reservation land is often communally-owned, making it difficult for local residents to build wealth through homeownership.
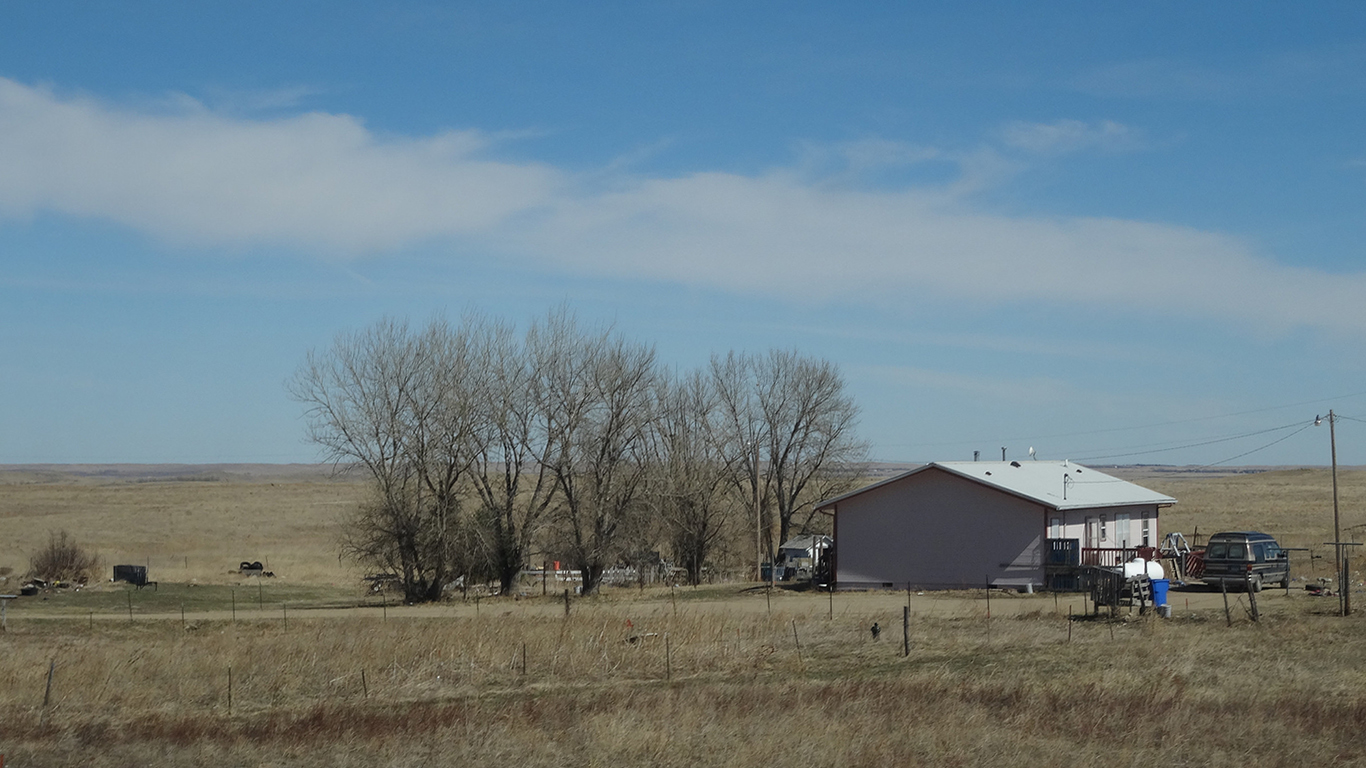
Todd County, South Dakota
> Poverty rate: 55.5%
> Adults with a bachelor’s degree: 15.6%
> Life expectancy at birth: 66.7 years
> Total population: 10,195
> Largest place in county: Rosebud
Todd County, South Dakota, which covers part of the Rosebud Indian Reservation along the state’s southern border ranks as the worst place to live in the country — in part because it is the poorest place in the country. Due to a number of historical and contemporary factors, Native American populations are among the most disadvantaged in the United States. An estimated 55.5% of the local population live below the poverty line, more than four times the national poverty rate of 13.4%, and most households in the area earn less than $25,000 a year.
As is the case in most poor areas in the United States, public health outcomes are also below average in Todd County. Life expectancy at birth in the county is just 66.7 years, more than 12 years below the national average. While poverty contributes to poor health outcomes in the area, so do unhealthy behaviors. For example, smoking is the leading cause of preventable death in the United States, and in Todd County, 41.5% of adults smoke, the largest share of any U.S. county.
Our methodology: To determine the worst U.S. county to live in, 24/7 Wall St. constructed an index of three measures: poverty, bachelor’s degree attainment among adults, and average life expectancy at birth.
Data on the share of individuals living below the poverty line, as well as the share of adults 25 and older with at least a bachelor’s degree came from the 2019 U.S. Census Bureau’s American Community Survey and are five-year estimates.
Data on average life expectancy at birth came from the 2020 County Health Rankings, a joint program of the Robert Wood Johnson Foundation and University of Wisconsin Population Health Institute, and are based on mortality data from the years 2016 to 2018.
Supplemental data on population, income, and median home value are five-year estimates from the ACS. Data on unemployment in January 2021 came from the Bureau of Labor Statistics and are not seasonally adjusted. Data on the number of annual drug deaths per 100,000 residents came from the Centers for Disease Control and Prevention and are for the years 2015 to 2019.
Click here to read These Are The Worst Counties To Live In
100 Million Americans Are Missing This Crucial Retirement Tool
The thought of burdening your family with a financial disaster is most Americans’ nightmare. However, recent studies show that over 100 million Americans still don’t have proper life insurance in the event they pass away.
Life insurance can bring peace of mind – ensuring your loved ones are safeguarded against unforeseen expenses and debts. With premiums often lower than expected and a variety of plans tailored to different life stages and health conditions, securing a policy is more accessible than ever.
A quick, no-obligation quote can provide valuable insight into what’s available and what might best suit your family’s needs. Life insurance is a simple step you can take today to help secure peace of mind for your loved ones tomorrow.
Click here to learn how to get a quote in just a few minutes.
Thank you for reading! Have some feedback for us?
Contact the 24/7 Wall St. editorial team.
Latest from 24/7


Our expert who first called NVIDIA in 2009 is predicting 2025 will see a historic AI breakthrough.
You can follow him investing $500,000 of his own money on our top AI stocks for free.