
Change in gross domestic product over time is perhaps the most comprehensive and widely cited indicator of overall economic health for any country or region. And by this measure, the U.S. has outperformed many of its peers on the world stage in recent years.
24/7 Wall St. Key Points:
- Among similarly wealthy, highly developed countries, the U.S. economy — as indicated by GDP growth — has been relatively healthy in recent years.
- Certain parts of the country have made an outsized contribution to American economic expansion in the last year.
- Also: Discover the next Nvidia
According to the World Bank, the U.S. economy contracted by 2.2% during the COVID-19 recession of 2020. That same year, GDP fell by 3.9% among all high-income countries, and by 5.6% in the European Union. Additionally, between 2021 and 2023, cumulative U.S. economic growth has outperformed comparable GDP growth among both high-income and E.U. countries.
Strong GDP growth can come from a growing work force, increased business investment, and improvements in productivity and innovation. These conditions can feed a virtuous cycle of higher wages, lower unemployment, and greater investor confidence.
The U.S. economy is the sum of its parts, and certain places across the U.S. have played an outsized role in driving U.S. GDP growth in recent years.
Using data from the Bureau of Economic Analysis, 24/7 Wall St. identified the fastest growing local economy in each state. We reviewed data on GDP growth from 2022 to 2023 in every U.S. county or county equivalent and identified the place in every state that reported the largest economic expansion. Rankings are based on real GDP figures chained to 2017 dollars. Supplemental data on population and median household income are from the U.S. Census Bureau’s Population Estimates Program and American Community Survey.
Among the counties on this list, real GDP growth between 2022 and 2023, as calculated by the BEA, ranges from 2.4% to over 125%. While population growth can contribute to GDP growth, just over half of these counties reported a net population decline between 2022 and 2023 — suggesting economic expansion was driven by other factors, like increased productivity. (Here is a look at the U.S. cities people are fleeing.)
While GDP growth does not always lead to rising incomes, residents of nearly every county or county equivalent on this list have benefited financially. In all but a handful of these counties, the typical household earned more in 2023 than they did in 2022 — in most cases, by over $2,500. (Here is a look at the richest county in every state.)
Why It Matters

Year-over-year change in gross domestic product, or GDP is perhaps the most comprehensive indicator of the health of any economy. GDP growth generally benefits households, businesses, and governments — and in some parts of the country, GDP surged in 2023.
Alabama: Perry County

- GDP growth in county, 2022-2023: +13.5%
- County GDP in 2023: $204.8 million (0.08% of state GDP)
- County GDP in 2022: $180.5 million (0.08% of state GDP)
- Population change in county, 2022-2023: -2.10%
- County population in 2023: 7,738 (0.15% of state population)
- County population in 2022: 7,904 (0.16% of state population)
- Median household income in county: $34,368 in 2023, $32,332 in 2022
Alaska: North Slope Borough

- GDP growth in borough, 2022-2023: +32.9%
- Borough GDP in 2023: $7.1 billion (13.11% of state GDP)
- Borough GDP in 2022: $5.3 billion (10.50% of state GDP)
- Population change in borough, 2022-2023: -1.92%
- Borough population in 2023: 10,603 (1.44% of state population)
- Borough population in 2022: 10,811 (1.47% of state population)
- Median household income in borough: $86,313 in 2023, $83,472 in 2022
Arizona: Pinal County

- GDP growth in county, 2022-2023: +9.0%
- County GDP in 2023: $11.5 billion (2.72% of state GDP)
- County GDP in 2022: $10.5 billion (2.57% of state GDP)
- Population change in county, 2022-2023: +4.13%
- County population in 2023: 484,239 (6.48% of state population)
- County population in 2022: 465,037 (6.30% of state population)
- Median household income in county: $77,588 in 2023, $73,313 in 2022
Arkansas: Woodruff County

- GDP growth in county, 2022-2023: +28.2%
- County GDP in 2023: $314.4 million (0.22% of state GDP)
- County GDP in 2022: $245.3 million (0.18% of state GDP)
- Population change in county, 2022-2023: -1.54%
- County population in 2023: 5,964 (0.19% of state population)
- County population in 2022: 6,057 (0.20% of state population)
- Median household income in county: $49,982 in 2023, $49,608 in 2022
California: Modoc County

- GDP growth in county, 2022-2023: +19.0%
- County GDP in 2023: $554.7 million (0.02% of state GDP)
- County GDP in 2022: $466.1 million (0.01% of state GDP)
- Population change in county, 2022-2023: -1.38%
- County population in 2023: 8,500 (0.02% of state population)
- County population in 2022: 8,619 (0.02% of state population)
- Median household income in county: $56,648 in 2023, $54,962 in 2022
Colorado: Kiowa County

- GDP growth in county, 2022-2023: +32.3%
- County GDP in 2023: $97.7 million (0.02% of state GDP)
- County GDP in 2022: $73.8 million (0.02% of state GDP)
- Population change in county, 2022-2023: -3.49%
- County population in 2023: 1,384 (0.02% of state population)
- County population in 2022: 1,434 (0.02% of state population)
- Median household income in county: $56,389 in 2023, $45,250 in 2022
Connecticut: Middlesex County

- GDP growth in county, 2022-2023: +4.5%
- County GDP in 2023: $10.3 billion (3.60% of state GDP)
- County GDP in 2022: $9.9 billion (3.54% of state GDP)
- Population change in county, 2022-2023: N/A
- County population in 2023: N/A
- County population in 2022: N/A
- Median household income in county: N/A
Delaware: Sussex County

- GDP growth in county, 2022-2023: +2.8%
- County GDP in 2023: $15.2 billion (19.51% of state GDP)
- County GDP in 2022: $14.8 billion (1.19% of state GDP)
- Population change in county, 2022-2023: +2.75%
- County population in 2023: 263,509 (25.42% of state population)
- County population in 2022: 256,447 (25.13% of state population)
- Median household income in county: $78,162 in 2023, $75,406 in 2022
Florida: Lafayette County
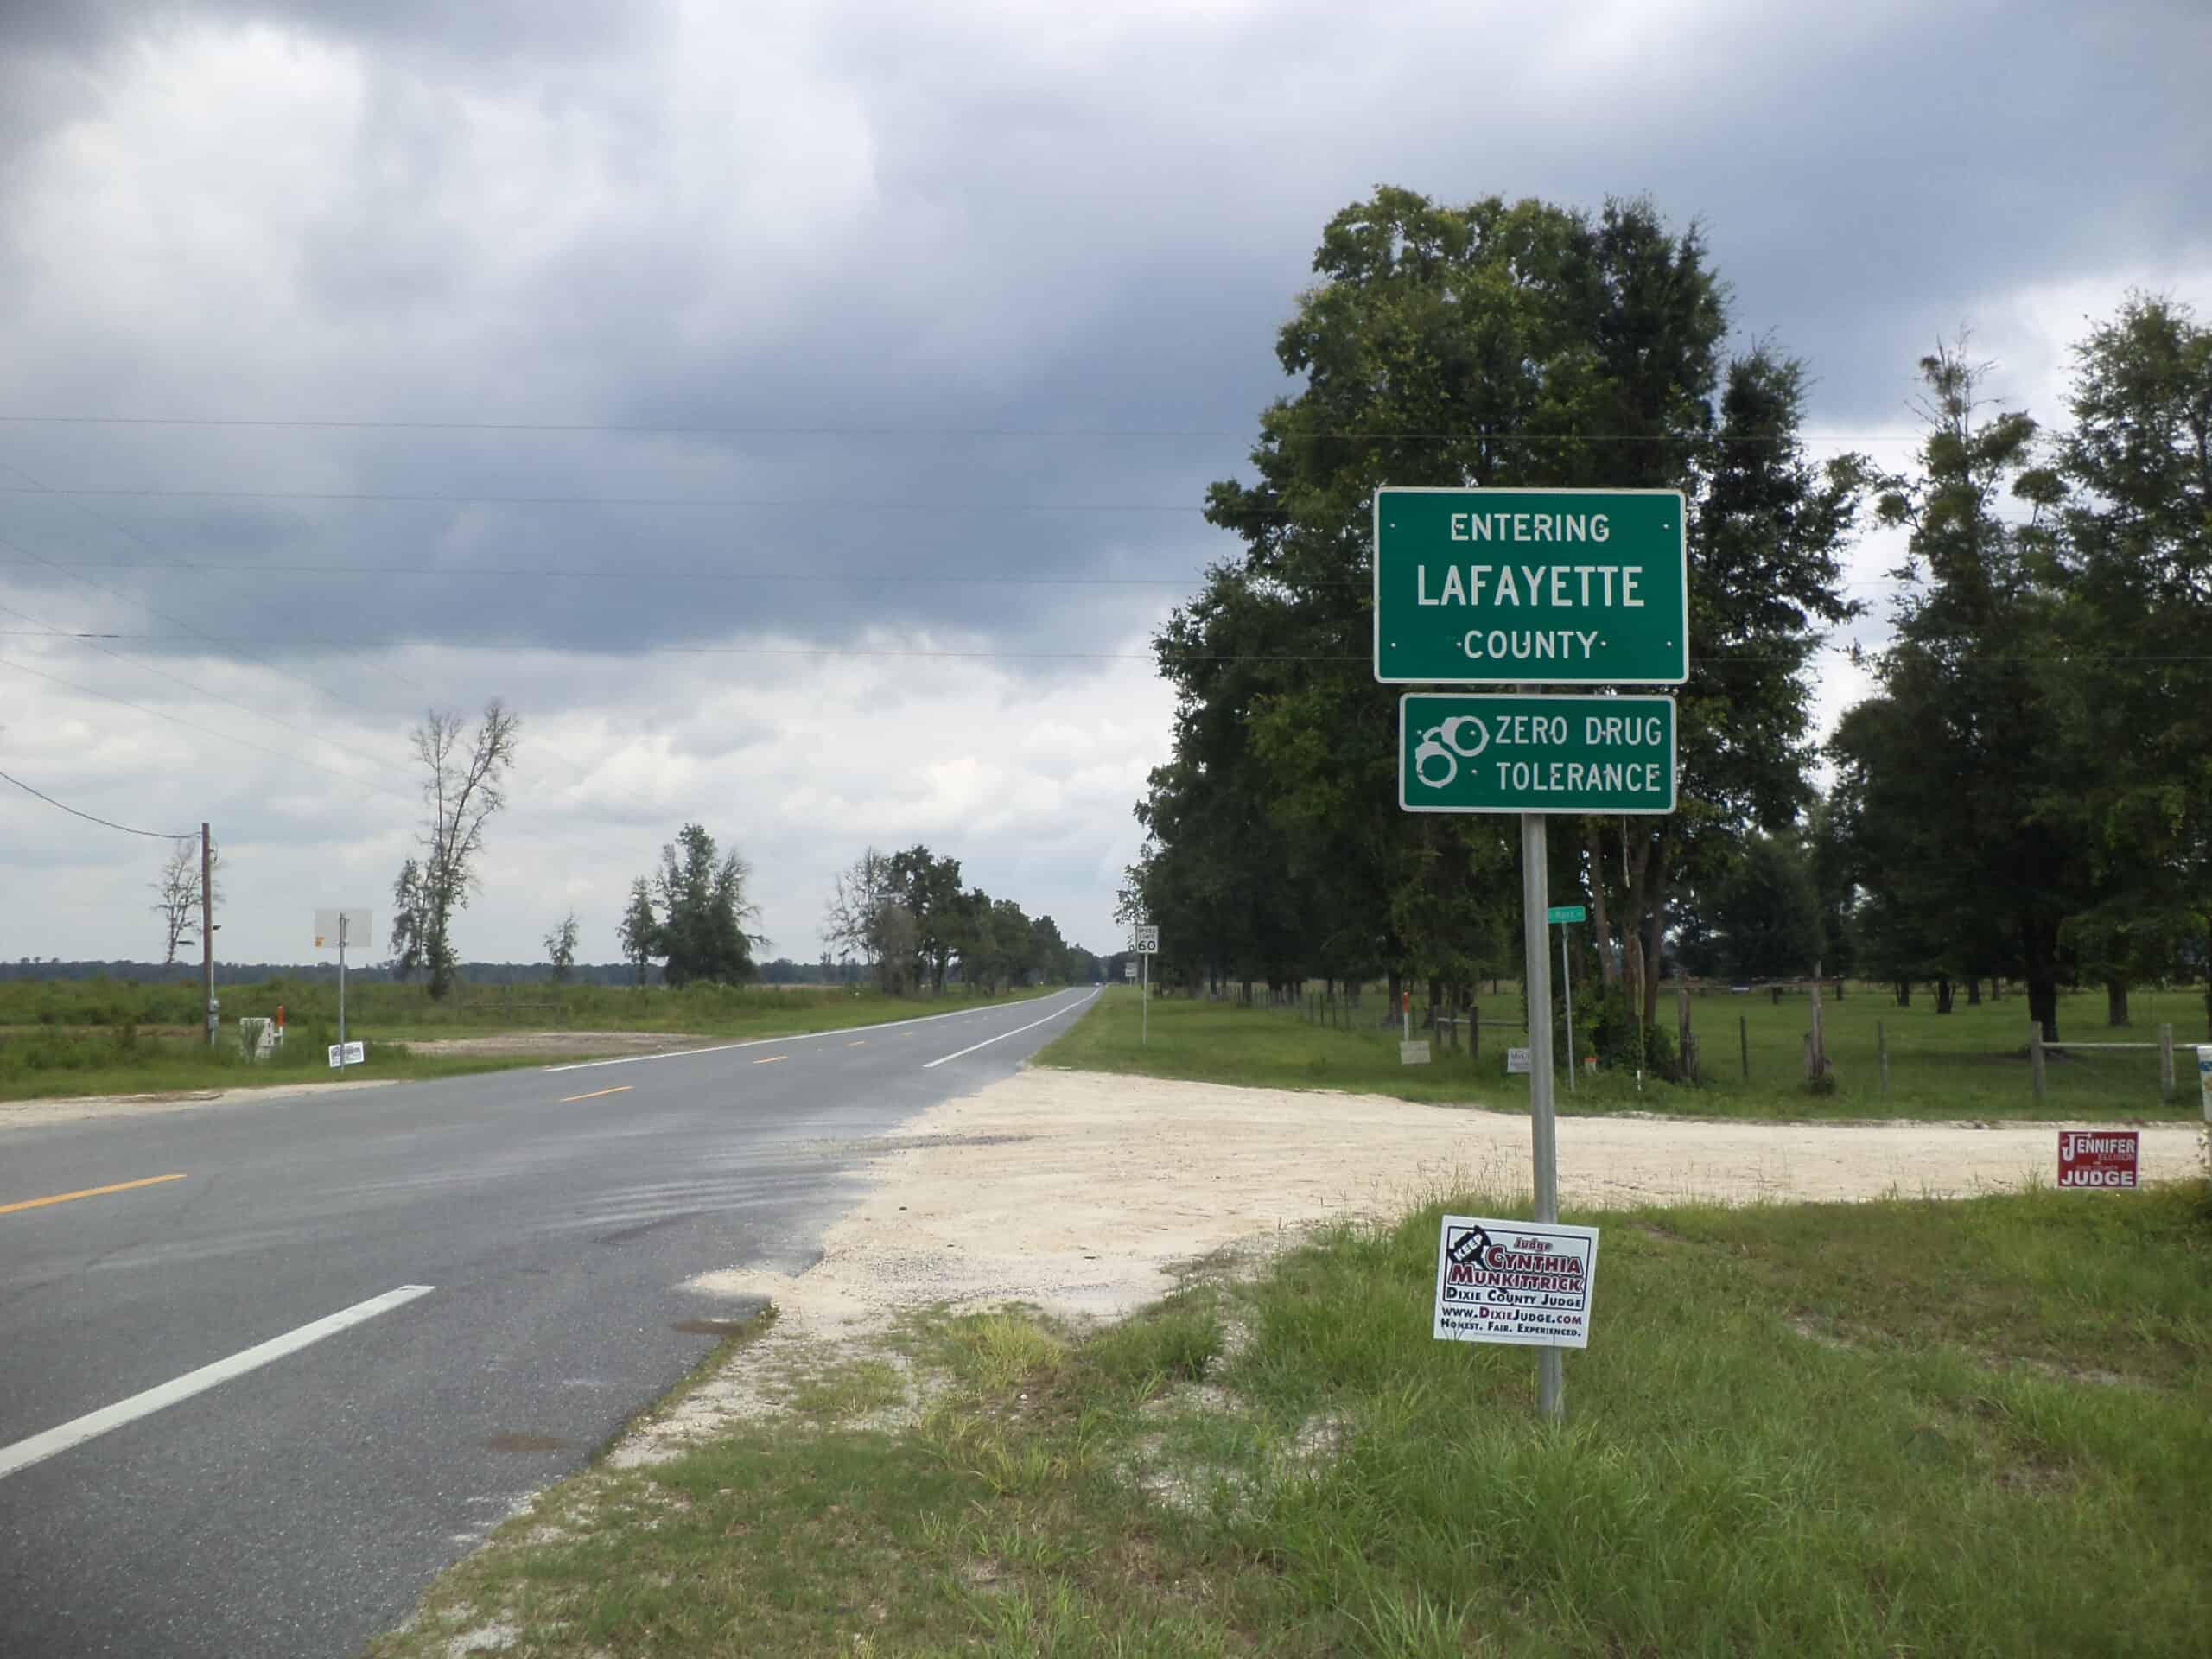
- GDP growth in county, 2022-2023: +23.1%
- County GDP in 2023: $210.9 million (0.02% of state GDP)
- County GDP in 2022: $171.3 million (0.01% of state GDP)
- Population change in county, 2022-2023: +3.87%
- County population in 2023: 8,078 (0.04% of state population)
- County population in 2022: 7,777 (0.03% of state population)
- Median household income in county: $60,692 in 2023, $57,852 in 2022
Georgia: Clay County

- GDP growth in county, 2022-2023: +18.9%
- County GDP in 2023: $87.0 million (0.01% of state GDP)
- County GDP in 2022: $73.2 million (0.01% of state GDP)
- Population change in county, 2022-2023: +0.00%
- County population in 2023: 2,853 (0.03% of state population)
- County population in 2022: 2,853 (0.03% of state population)
- Median household income in county: $48,715 in 2023, $43,264 in 2022
Hawaii: Honolulu County

- GDP growth in county, 2022-2023: +2.4%
- County GDP in 2023: $66.0 billion (74.48% of state GDP)
- County GDP in 2022: $64.5 billion (74.18% of state GDP)
- Population change in county, 2022-2023: -0.54%
- County population in 2023: 989,408 (68.64% of state population)
- County population in 2022: 994,828 (69.07% of state population)
- Median household income in county: $104,264 in 2023, $99,816 in 2022
Idaho: Oneida County

- GDP growth in county, 2022-2023: +16.0%
- County GDP in 2023: $158.5 million (0.17% of state GDP)
- County GDP in 2022: $136.7 million (0.15% of state GDP)
- Population change in county, 2022-2023: +4.49%
- County population in 2023: 4,953 (0.25% of state population)
- County population in 2022: 4,740 (0.24% of state population)
- Median household income in county: $72,563 in 2023, $67,383 in 2022
Illinois: Cumberland County

- GDP growth in county, 2022-2023: +25.0%
- County GDP in 2023: $987.5 million (0.11% of state GDP)
- County GDP in 2022: $790.1 million (0.09% of state GDP)
- Population change in county, 2022-2023: -0.46%
- County population in 2023: 10,261 (0.08% of state population)
- County population in 2022: 10,308 (0.08% of state population)
- Median household income in county: $69,826 in 2023, $71,274 in 2022
Indiana: Posey County

- GDP growth in county, 2022-2023: +9.6%
- County GDP in 2023: $4.6 billion (1.14% of state GDP)
- County GDP in 2022: $4.2 billion (1.05% of state GDP)
- Population change in county, 2022-2023: -0.23%
- County population in 2023: 25,040 (0.36% of state population)
- County population in 2022: 25,098 (0.37% of state population)
- Median household income in county: $79,124 in 2023, $75,594 in 2022
Iowa: Monona County

- GDP growth in county, 2022-2023: +12.6%
- County GDP in 2023: $383.8 million (0.19% of state GDP)
- County GDP in 2022: $340.8 million (0.17% of state GDP)
- Population change in county, 2022-2023: -0.15%
- County population in 2023: 8,493 (0.26% of state population)
- County population in 2022: 8,506 (0.27% of state population)
- Median household income in county: $62,944 in 2023, $59,897 in 2022
Kansas: Jewell County

- GDP growth in county, 2022-2023: +79.2%
- County GDP in 2023: $130.8 million (0.07% of state GDP)
- County GDP in 2022: $73.0 million (0.04% of state GDP)
- Population change in county, 2022-2023: -1.32%
- County population in 2023: 2,847 (0.10% of state population)
- County population in 2022: 2,885 (0.10% of state population)
- Median household income in county: $52,344 in 2023, $47,109 in 2022
Kentucky: Lawrence County

- GDP growth in county, 2022-2023: +11.4%
- County GDP in 2023: $411.5 million (0.18% of state GDP)
- County GDP in 2022: $369.3 million (0.17% of state GDP)
- Population change in county, 2022-2023: -0.60%
- County population in 2023: 16,000 (0.35% of state population)
- County population in 2022: 16,097 (0.36% of state population)
- Median household income in county: $45,584 in 2023, $42,488 in 2022
Louisiana: De Soto Parish

- GDP growth in parish, 2022-2023: +32.5%
- Parish GDP in 2023: $2.7 billion (1.08% of state GDP)
- Parish GDP in 2022: $2.0 billion (0.86% of state GDP)
- Population change in parish, 2022-2023: +0.96%
- Parish population in 2023: 27,114 (0.59% of state population)
- Parish population in 2022: 26,856 (0.58% of state population)
- Median household income in parish: $46,077 in 2023, $49,807 in 2022
Maine: Sagadahoc County

- GDP growth in county, 2022-2023: +9.1%
- County GDP in 2023: $2.4 billion (3.19% of state GDP)
- County GDP in 2022: $2.2 billion (3.01% of state GDP)
- Population change in county, 2022-2023: +0.38%
- County population in 2023: 37,513 (2.68% of state population)
- County population in 2022: 37,372 (2.69% of state population)
- Median household income in county: $82,080 in 2023, $77,591 in 2022
Maryland: Cecil County

- GDP growth in county, 2022-2023: +5.3%
- County GDP in 2023: $5.5 billion (1.30% of state GDP)
- County GDP in 2022: $5.2 billion (1.25% of state GDP)
- Population change in county, 2022-2023: +0.76%
- County population in 2023: 105,672 (1.70% of state population)
- County population in 2022: 104,870 (1.69% of state population)
- Median household income in county: $91,146 in 2023, $86,869 in 2022
Massachusetts: Franklin County

- GDP growth in county, 2022-2023: +6.2%
- County GDP in 2023: $3.0 billion (0.49% of state GDP)
- County GDP in 2022: $2.8 billion (0.46% of state GDP)
- Population change in county, 2022-2023: -0.22%
- County population in 2023: 70,836 (1.00% of state population)
- County population in 2022: 70,995 (1.01% of state population)
- Median household income in county: $72,584 in 2023, $70,383 in 2022
Michigan: Cass County

- GDP growth in county, 2022-2023: +24.6%
- County GDP in 2023: $1.6 billion (0.29% of state GDP)
- County GDP in 2022: $1.3 billion (0.23% of state GDP)
- Population change in county, 2022-2023: +0.32%
- County population in 2023: 51,642 (0.51% of state population)
- County population in 2022: 51,477 (0.51% of state population)
- Median household income in county: $68,011 in 2023, $65,183 in 2022
Minnesota: Lake County

- GDP growth in county, 2022-2023: +9.7%
- County GDP in 2023: $516.9 million (0.13% of state GDP)
- County GDP in 2022: $471.0 million (0.12% of state GDP)
- Population change in county, 2022-2023: -0.52%
- County population in 2023: 10,855 (0.19% of state population)
- County population in 2022: 10,912 (0.19% of state population)
- Median household income in county: $75,621 in 2023, $73,860 in 2022
Mississippi: Issaquena County

- GDP growth in county, 2022-2023: +30.6%
- County GDP in 2023: $28.0 million (0.02% of state GDP)
- County GDP in 2022: $21.4 million (0.02% of state GDP)
- Population change in county, 2022-2023: -0.48%
- County population in 2023: 1,256 (0.04% of state population)
- County population in 2022: 1,262 (0.04% of state population)
- Median household income in county: $29,271 in 2023, $17,900 in 2022
Missouri: Monroe County

- GDP growth in county, 2022-2023: +23.4%
- County GDP in 2023: $238.0 million (0.07% of state GDP)
- County GDP in 2022: $192.9 million (0.06% of state GDP)
- Population change in county, 2022-2023: +0.73%
- County population in 2023: 8,698 (0.14% of state population)
- County population in 2022: 8,635 (0.14% of state population)
- Median household income in county: $48,299 in 2023, $50,245 in 2022
Montana: Richland County

- GDP growth in county, 2022-2023: +27.0%
- County GDP in 2023: $986.2 million (1.72% of state GDP)
- County GDP in 2022: $776.5 million (1.41% of state GDP)
- Population change in county, 2022-2023: -0.51%
- County population in 2023: 11,173 (0.99% of state population)
- County population in 2022: 11,230 (1.00% of state population)
- Median household income in county: $69,578 in 2023, $67,515 in 2022
Nebraska: Arthur County

- GDP growth in county, 2022-2023: +78.3%
- County GDP in 2023: $21.9 million (0.02% of state GDP)
- County GDP in 2022: $12.3 million (0.01% of state GDP)
- Population change in county, 2022-2023: -3.06%
- County population in 2023: 412 (0.02% of state population)
- County population in 2022: 425 (0.02% of state population)
- Median household income in county: $67,500 in 2023, $66,667 in 2022
Nevada: Esmeralda County

- GDP growth in county, 2022-2023: +7.1%
- County GDP in 2023: $41.0 million (0.02% of state GDP)
- County GDP in 2022: $38.2 million (0.02% of state GDP)
- Population change in county, 2022-2023: -1.47%
- County population in 2023: 736 (0.02% of state population)
- County population in 2022: 747 (0.02% of state population)
- Median household income in county: N/A
New Hampshire: Rockingham County

- GDP growth in county, 2022-2023: +3.7%
- County GDP in 2023: $26.0 billion (27.79% of state GDP)
- County GDP in 2022: $25.1 billion (27.41% of state GDP)
- Population change in county, 2022-2023: +0.33%
- County population in 2023: 320,689 (22.87% of state population)
- County population in 2022: 319,633 (22.89% of state population)
- Median household income in county: $113,927 in 2023, $110,225 in 2022
New Jersey: Salem County

- GDP growth in county, 2022-2023: +15.9%
- County GDP in 2023: $6.1 billion (0.92% of state GDP)
- County GDP in 2022: $5.3 billion (0.81% of state GDP)
- Population change in county, 2022-2023: +0.28%
- County population in 2023: 65,338 (0.70% of state population)
- County population in 2022: 65,157 (0.70% of state population)
- Median household income in county: $78,412 in 2023, $73,378 in 2022
New Mexico: Lea County

- GDP growth in county, 2022-2023: +34.6%
- County GDP in 2023: $8.5 billion (7.73% of state GDP)
- County GDP in 2022: $6.3 billion (6.13% of state GDP)
- Population change in county, 2022-2023: -0.33%
- County population in 2023: 72,101 (3.40% of state population)
- County population in 2022: 72,343 (3.42% of state population)
- Median household income in county: $68,750 in 2023, $65,855 in 2022
New York: Schenectady County

- GDP growth in county, 2022-2023: +5.0%
- County GDP in 2023: $9.2 billion (0.52% of state GDP)
- County GDP in 2022: $8.8 billion (0.50% of state GDP)
- Population change in county, 2022-2023: +0.13%
- County population in 2023: 159,902 (0.81% of state population)
- County population in 2022: 159,694 (0.81% of state population)
- Median household income in county: $76,989 in 2023, $75,056 in 2022
North Carolina: Mitchell County

- GDP growth in county, 2022-2023: +20.0%
- County GDP in 2023: $598.7 million (0.09% of state GDP)
- County GDP in 2022: $498.9 million (0.08% of state GDP)
- Population change in county, 2022-2023: -0.33%
- County population in 2023: 14,999 (0.14% of state population)
- County population in 2022: 15,048 (0.14% of state population)
- Median household income in county: $58,089 in 2023, $55,534 in 2022
North Dakota: Dunn County
")
- GDP growth in county, 2022-2023: +53.5%
- County GDP in 2023: $1.7 billion (2.89% of state GDP)
- County GDP in 2022: $1.1 billion (2.03% of state GDP)
- Population change in county, 2022-2023: +0.63%
- County population in 2023: 4,019 (0.51% of state population)
- County population in 2022: 3,994 (0.51% of state population)
- Median household income in county: $94,688 in 2023, $91,758 in 2022
Ohio: Guernsey County

- GDP growth in county, 2022-2023: +46.3%
- County GDP in 2023: $2.8 billion (0.40% of state GDP)
- County GDP in 2022: $1.9 billion (0.28% of state GDP)
- Population change in county, 2022-2023: +0.08%
- County population in 2023: 38,089 (0.32% of state population)
- County population in 2022: 38,060 (0.32% of state population)
- Median household income in county: $55,756 in 2023, $53,901 in 2022
Oklahoma: Ellis County

- GDP growth in county, 2022-2023: +71.5%
- County GDP in 2023: $863.2 million (0.42% of state GDP)
- County GDP in 2022: $503.2 million (0.26% of state GDP)
- Population change in county, 2022-2023: -0.95%
- County population in 2023: 3,648 (0.09% of state population)
- County population in 2022: 3,683 (0.09% of state population)
- Median household income in county: $56,992 in 2023, $57,768 in 2022
Oregon: Gilliam County

- GDP growth in county, 2022-2023: +16.1%
- County GDP in 2023: $341.1 million (0.13% of state GDP)
- County GDP in 2022: $293.9 million (0.11% of state GDP)
- Population change in county, 2022-2023: +0.90%
- County population in 2023: 2,026 (0.05% of state population)
- County population in 2022: 2,008 (0.05% of state population)
- Median household income in county: $64,219 in 2023, $58,409 in 2022
Pennsylvania: Susquehanna County

- GDP growth in county, 2022-2023: +30.4%
- County GDP in 2023: $2.7 billion (0.34% of state GDP)
- County GDP in 2022: $2.1 billion (0.27% of state GDP)
- Population change in county, 2022-2023: -0.08%
- County population in 2023: 38,109 (0.29% of state population)
- County population in 2022: 38,139 (0.29% of state population)
- Median household income in county: $66,930 in 2023, $63,968 in 2022
Rhode Island: Washington County

- GDP growth in county, 2022-2023: +4.5%
- County GDP in 2023: $7.6 billion (12.03% of state GDP)
- County GDP in 2022: $7.3 billion (2.86% of state GDP)
- Population change in county, 2022-2023: -0.21%
- County population in 2023: 129,982 (11.78% of state population)
- County population in 2022: 130,256 (11.85% of state population)
- Median household income in county: $102,478 in 2023, $99,510 in 2022
South Carolina: Jasper County

- GDP growth in county, 2022-2023: +12.2%
- County GDP in 2023: $1.6 billion (0.62% of state GDP)
- County GDP in 2022: $1.5 billion (0.57% of state GDP)
- Population change in county, 2022-2023: +4.87%
- County population in 2023: 33,544 (0.62% of state population)
- County population in 2022: 31,986 (0.60% of state population)
- Median household income in county: $63,503 in 2023, $60,452 in 2022
South Dakota: Sanborn County

- GDP growth in county, 2022-2023: +29.8%
- County GDP in 2023: $150.0 million (0.26% of state GDP)
- County GDP in 2022: $115.5 million (0.21% of state GDP)
- Population change in county, 2022-2023: -0.17%
- County population in 2023: 2,399 (0.26% of state population)
- County population in 2022: 2,403 (0.26% of state population)
- Median household income in county: $69,870 in 2023, $65,806 in 2022
Tennessee: Hancock County

- GDP growth in county, 2022-2023: +16.2%
- County GDP in 2023: $109.6 million (0.03% of state GDP)
- County GDP in 2022: $94.3 million (0.02% of state GDP)
- Population change in county, 2022-2023: +1.61%
- County population in 2023: 6,956 (0.10% of state population)
- County population in 2022: 6,846 (0.10% of state population)
- Median household income in county: $31,995 in 2023, $31,809 in 2022
Texas: Throckmorton County

- GDP growth in county, 2022-2023: +125.8%
- County GDP in 2023: $160.4 million (0.01% of state GDP)
- County GDP in 2022: $71.1 million (0.00% of state GDP)
- Population change in county, 2022-2023: -0.84%
- County population in 2023: 1,526 (0.00% of state population)
- County population in 2022: 1,539 (0.01% of state population)
- Median household income in county: $58,864 in 2023, $55,221 in 2022
Utah: Duchesne County

- GDP growth in county, 2022-2023: +27.6%
- County GDP in 2023: $1.5 billion (0.65% of state GDP)
- County GDP in 2022: $1.2 billion (0.53% of state GDP)
- Population change in county, 2022-2023: +1.66%
- County population in 2023: 20,477 (0.59% of state population)
- County population in 2022: 20,142 (0.59% of state population)
- Median household income in county: $74,738 in 2023, $70,821 in 2022
Vermont: Lamoille County

- GDP growth in county, 2022-2023: +3.3%
- County GDP in 2023: $1.3 billion (3.55% of state GDP)
- County GDP in 2022: $1.2 billion (3.49% of state GDP)
- Population change in county, 2022-2023: -0.16%
- County population in 2023: 26,060 (4.02% of state population)
- County population in 2022: 26,103 (4.03% of state population)
- Median household income in county: $69,897 in 2023, $69,886 in 2022
Virginia: Giles County

- GDP growth in county, 2022-2023: +23.3%
- County GDP in 2023: $709.8 million (0.12% of state GDP)
- County GDP in 2022: $575.6 million (0.10% of state GDP)
- Population change in county, 2022-2023: +0.15%
- County population in 2023: 16,457 (0.19% of state population)
- County population in 2022: 16,432 (0.19% of state population)
- Median household income in county: $64,819 in 2023, $61,987 in 2022
Washington: Grant County

- GDP growth in county, 2022-2023: +20.2%
- County GDP in 2023: $6.8 billion (1.00% of state GDP)
- County GDP in 2022: $5.7 billion (0.88% of state GDP)
- Population change in county, 2022-2023: +1.08%
- County population in 2023: 102,678 (1.31% of state population)
- County population in 2022: 101,580 (1.30% of state population)
- Median household income in county: $71,115 in 2023, $66,387 in 2022
West Virginia: Clay County
")
- GDP growth in county, 2022-2023: +48.5%
- County GDP in 2023: $157.5 million (0.19% of state GDP)
- County GDP in 2022: $106.0 million (0.14% of state GDP)
- Population change in county, 2022-2023: -0.73%
- County population in 2023: 7,783 (0.44% of state population)
- County population in 2022: 7,840 (0.44% of state population)
- Median household income in county: $42,790 in 2023, $41,530 in 2022
Wisconsin: Lafayette County

- GDP growth in county, 2022-2023: +10.5%
- County GDP in 2023: $668.1 million (0.19% of state GDP)
- County GDP in 2022: $604.7 million (0.18% of state GDP)
- Population change in county, 2022-2023: +0.23%
- County population in 2023: 16,945 (0.29% of state population)
- County population in 2022: 16,906 (0.29% of state population)
- Median household income in county: $72,091 in 2023, $69,293 in 2022
Wyoming: Converse County

- GDP growth in county, 2022-2023: +21.2%
- County GDP in 2023: $1.6 billion (3.98% of state GDP)
- County GDP in 2022: $1.3 billion (3.49% of state GDP)
- Population change in county, 2022-2023: +0.32%
- County population in 2023: 13,809 (2.36% of state population)
- County population in 2022: 13,765 (2.37% of state population)
- Median household income in county: $79,164 in 2023, $79,235 in 2022