Economy

Once Symbols of the American Dream, These Towns Are Quickly Fading Away

Kim Grosz / iStock via Getty Images

With the sole exception of 2020, the year large segments of the U.S. economy were shut down to prevent the spread of COVID-19, American gross domestic product increased every year since 2009. This consistent, year-over-year expansion reflects the strength and resilience of the U.S. economy, as GDP growth is perhaps the single most comprehensive measure of overall economic health.

24/7 Wall St. Key Points:

  • Among similarly wealthy, highly developed countries, the U.S. economy — as indicated by GDP growth — has been relatively healthy in recent years.
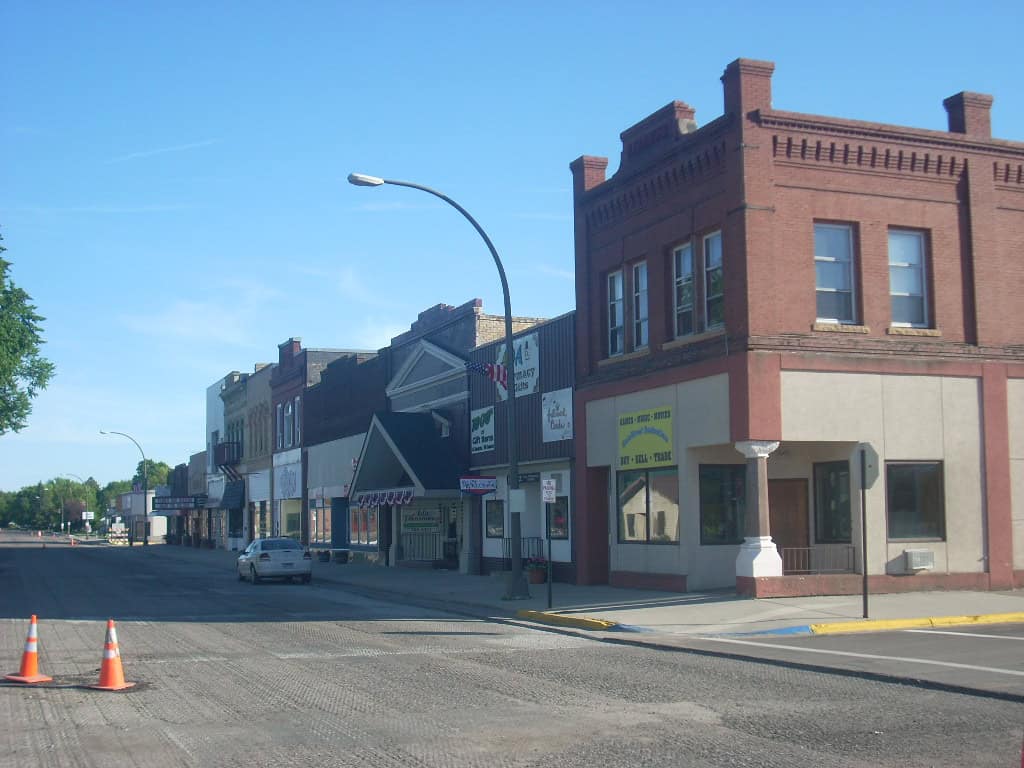
  • Not all parts of the country have followed this trend, however, and in nearly every state, there are cities and towns suffering through economic contractions.
  • Also: 2 Dividend Legends To Hold Forever

GDP growth can fuel virtuous economic cycles, as it often results in higher wages, reduced unemployment, improved corporate profits, and greater investor confidence. Indeed, in recent years, wages have been rising, unemployment has been at historic lows, and major stock indices have hit record highs.

But while the U.S. economy as a whole has been steadily growing — and even outperforming many other similarly wealthy, highly developed countries in recent years — the rising tide has not necessarily lifted all ships. In the last year alone, cities and towns across the country have broken with the broader trend and reported economic contractions.

Using data from the Bureau of Economic Analysis, 24/7 Wall St. identified the fastest shrinking local economy in each state. We reviewed data on change in GDP from 2022 to 2023 in every U.S. county or county equivalent and identified the place in every state that reported the largest economic contraction. In four states – Connecticut, New Hampshire, New Jersey, and Rhode Island – no county reported a lower GDP in 2023 than in 2022. In these states, the county with the weakest economic growth is listed. Rankings are based on real GDP figures chained to 2017 dollars. Supplemental data on population and median household income are from the U.S. Census Bureau’s Population Estimates Program and American Community Survey.

Among the four states where no county reported a GDP contraction, economic growth rates in the counties on this list were relatively weak, all coming in below 1%. In the 46 remaining counties and county equivalents on this list, reported economic contractions range from 0.1% to well over 30%.

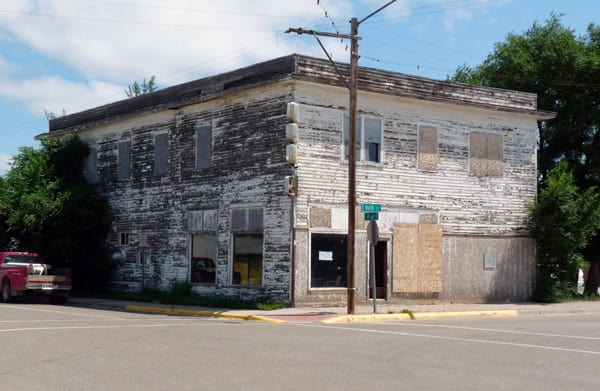
Just as economic growth can often be triggered by a growing population, declines in GDP can be precipitated by population decline. Among the 50 counties on this list, 22 had a smaller population in 2023 than they did in 2022. (Here is a look at the U.S. cities people are fleeing.)

Fortunately, economic decline does not appear to have had an overly negative impact on household finances in most places on this list. There are only six counties on this list where the median household income declined between 2022 and 2023. (Here is a look at the richest county in every state.)

This is the fastest shrinking local economy in every state.

Why It Matters

Darren415 / iStock via Getty Images

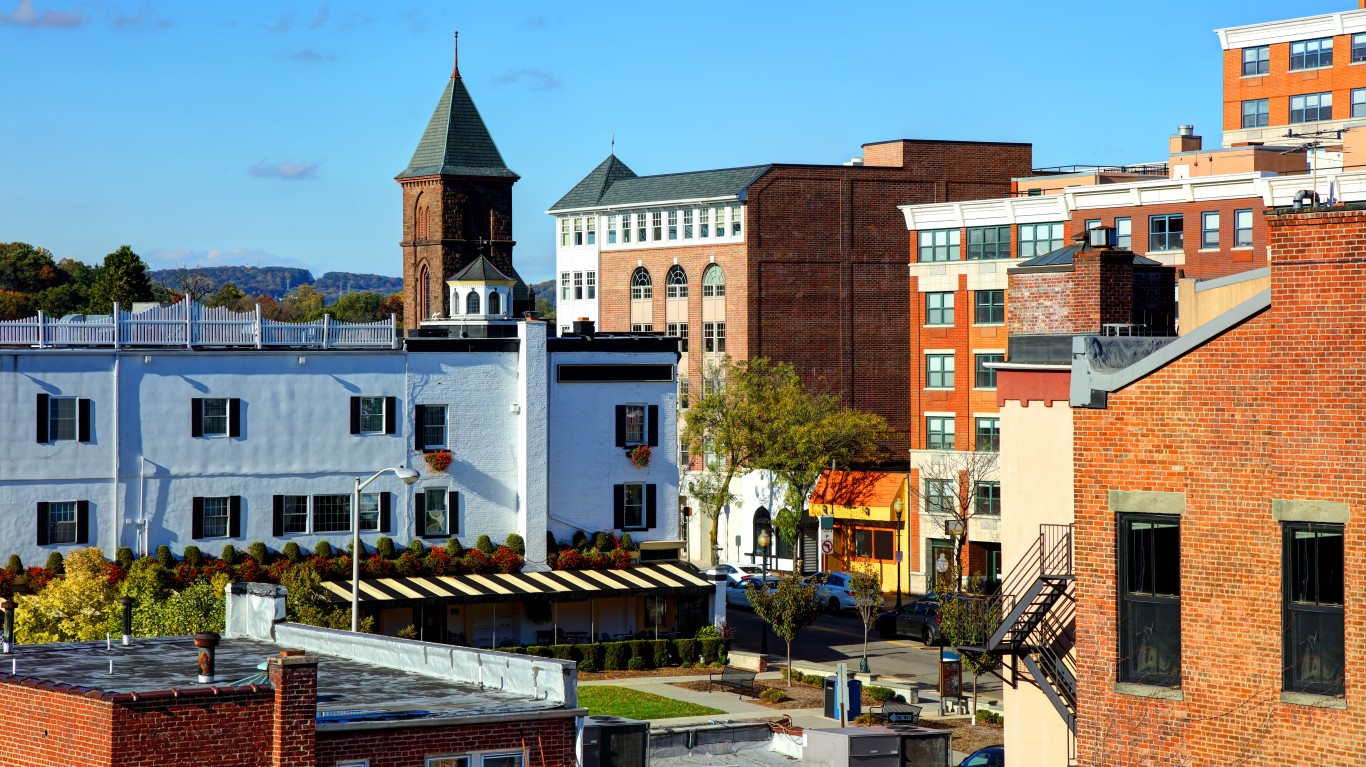
Change in gross domestic product over time is perhaps the most comprehensive and widely cited indicator of overall economic health for any country or region. And by this measure, the U.S. has outperformed many of its peers on the world stage in recent years. Still, positive national GDP growth does not reflect economic conditions in many American cities and towns. In nearly every state, there is at least one county that reported an economic contraction in 2023.

Alabama: Clay County

Jacqueline Nix / iStock Editorial via Getty Images
  • GDP growth in county, 2022-2023: -10.3%
  • County GDP in 2023: $386.4 million (0.16% of state GDP)
  • County GDP in 2022: $430.8 million (0.18% of state GDP)
  • Population change in county, 2022-2023: -0.51%
  • County population in 2023: 14,111 (0.28% of state population)
  • County population in 2022: 14,183 (0.28% of state population)
  • Median household income in county: $51,852 in 2023, $48,074 in 2022

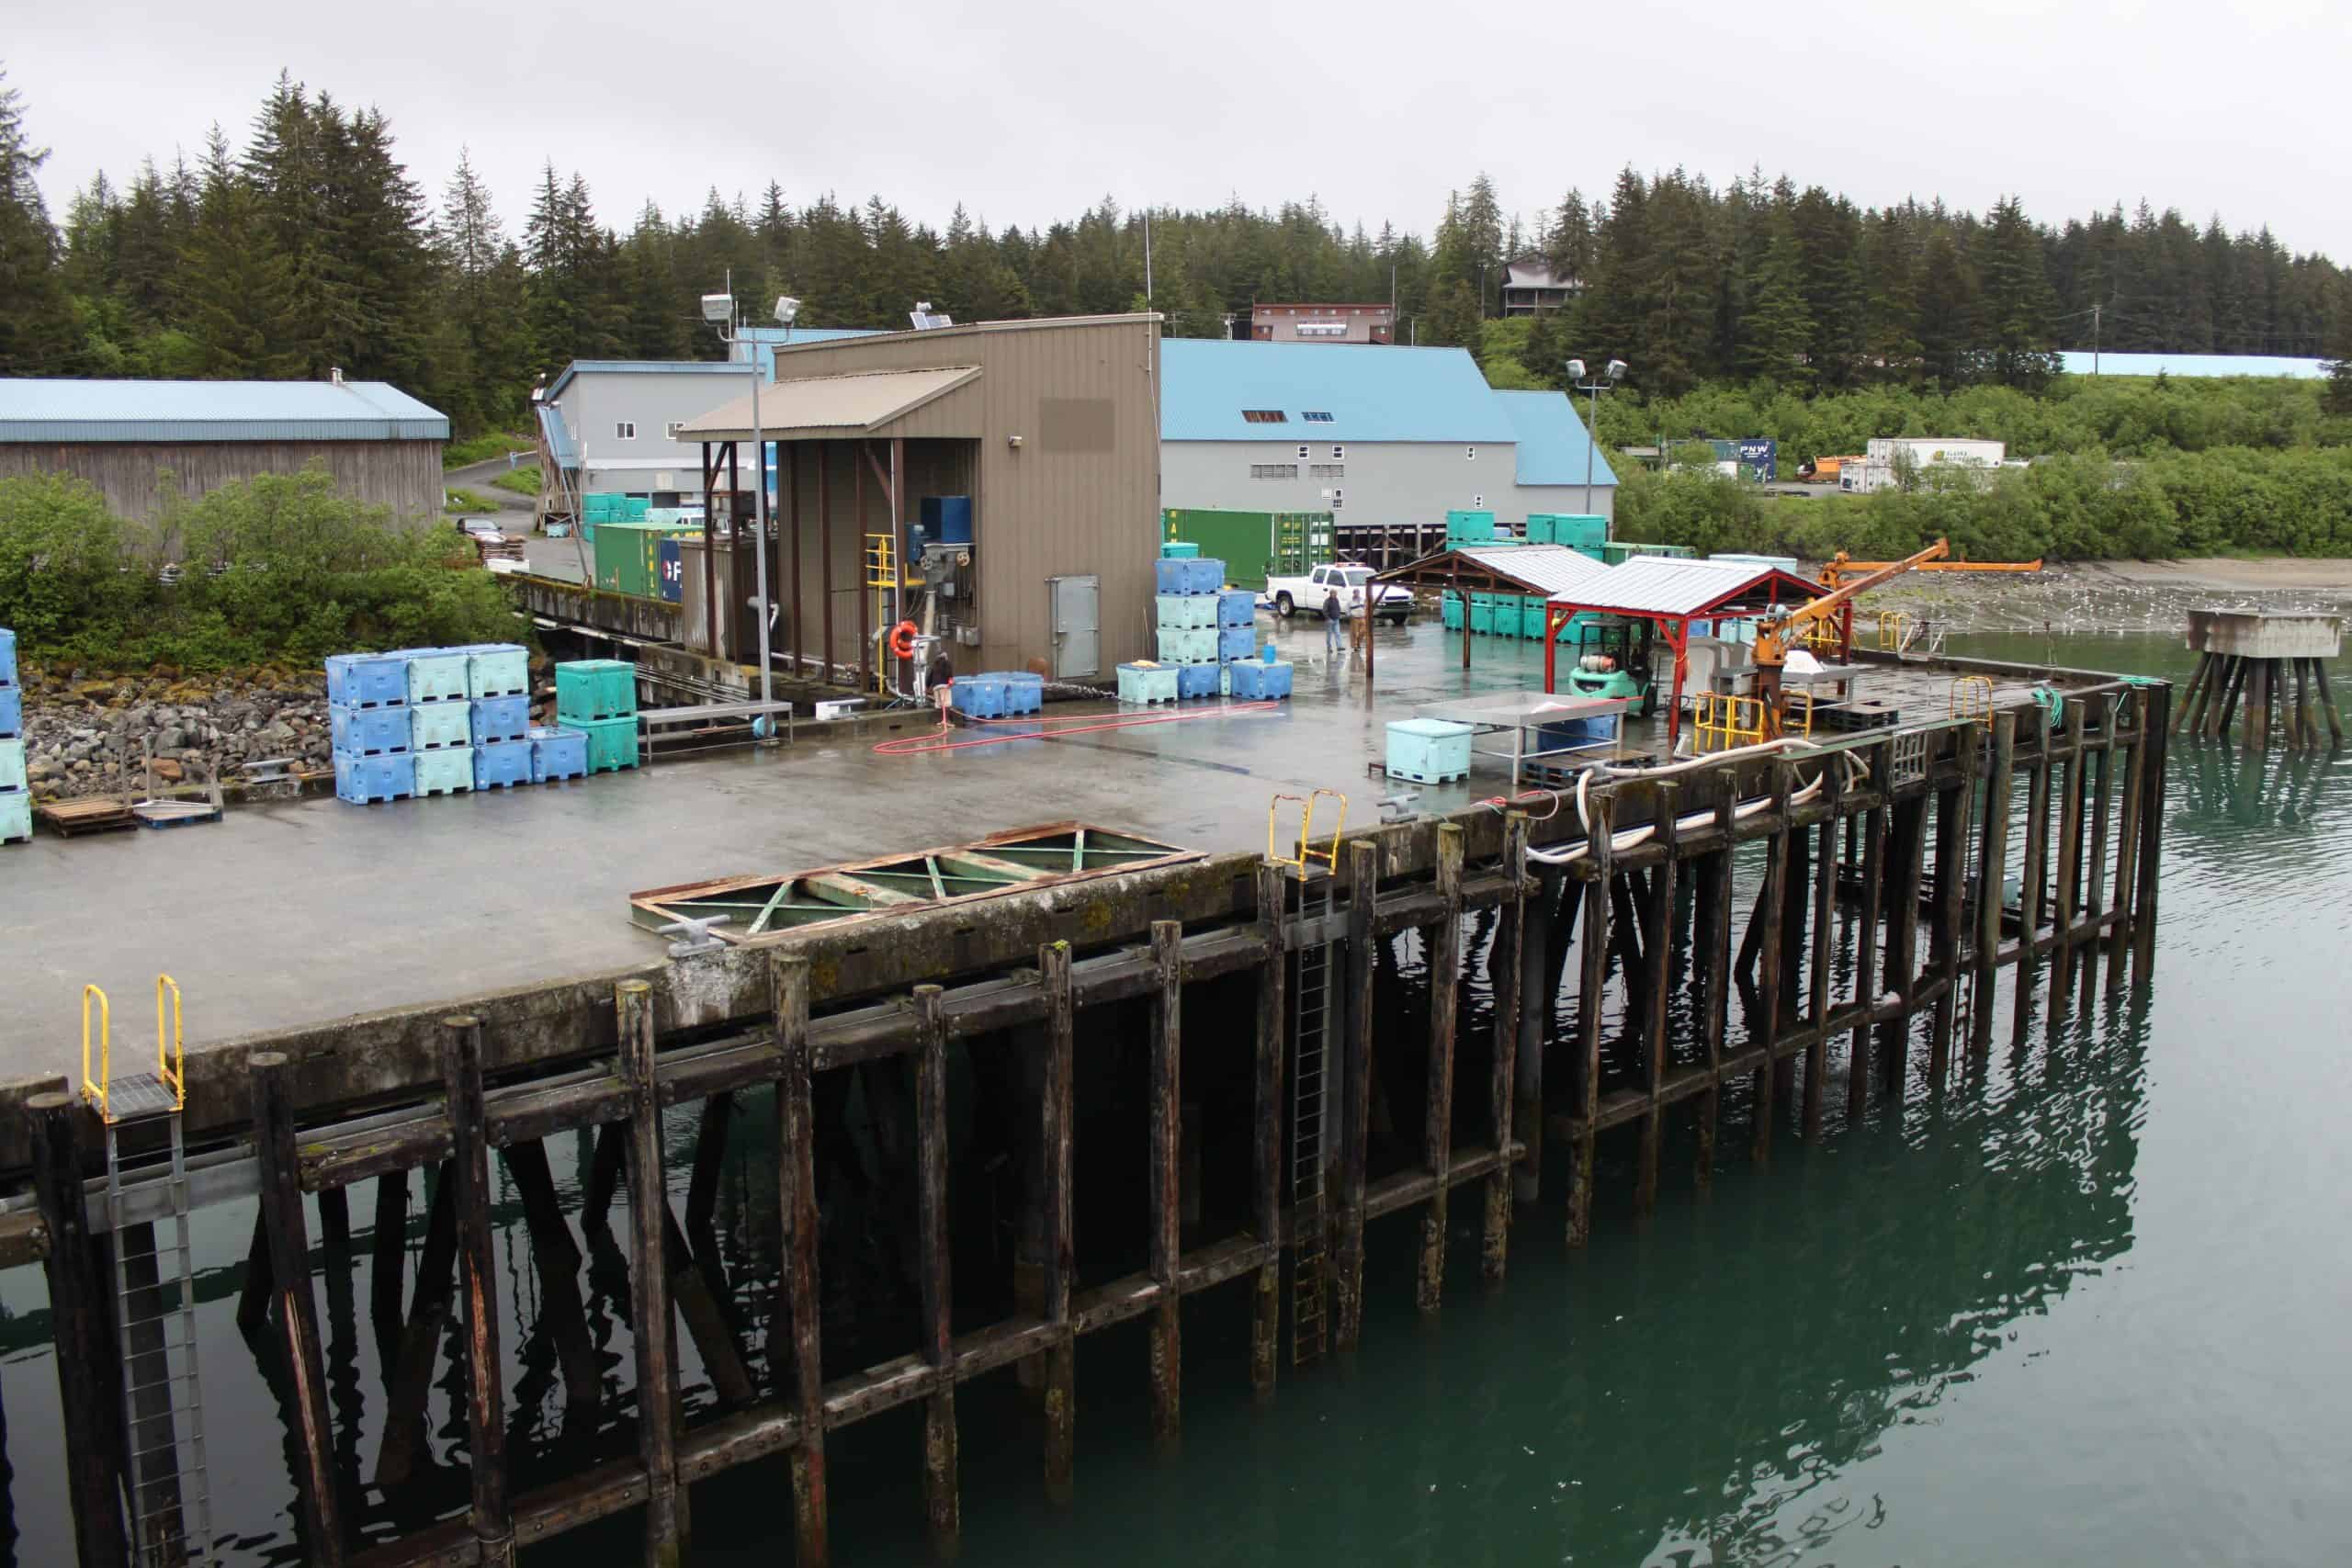
Alaska: Yakutat City and Borough

Eli Duke / Wikimedia Commons
  • GDP growth in borough, 2022-2023: -5.9%
  • Borough GDP in 2023: $36.8 million (0.07% of state GDP)
  • Borough GDP in 2022: $39.1 million (0.08% of state GDP)
  • Population change in borough, 2022-2023: +0.29%
  • Borough population in 2023: 687 (0.09% of state population)
  • Borough population in 2022: 685 (0.09% of state population)
  • Median household income in borough: $80,625 in 2023, $76,875 in 2022

Arizona: Greenlee County

BOB WESTON / iStock via Getty Images
  • GDP growth in county, 2022-2023: -8.1%
  • County GDP in 2023: $1.5 billion (0.35% of state GDP)
  • County GDP in 2022: $1.6 billion (0.39% of state GDP)
  • Population change in county, 2022-2023: +0.45%
  • County population in 2023: 9,369 (0.13% of state population)
  • County population in 2022: 9,327 (0.13% of state population)
  • Median household income in county: $75,239 in 2023, $73,756 in 2022

Arkansas: Howard County

Valis55 / Wikimedia Commons
  • GDP growth in county, 2022-2023: -12.2%
  • County GDP in 2023: $577.8 million (0.40% of state GDP)
  • County GDP in 2022: $657.8 million (0.47% of state GDP)
  • Population change in county, 2022-2023: -0.71%
  • County population in 2023: 12,533 (0.41% of state population)
  • County population in 2022: 12,622 (0.41% of state population)
  • Median household income in county: $44,492 in 2023, $44,824 in 2022

California: Sierra County

Public Domain / Wikimedia Commons
  • GDP growth in county, 2022-2023: -2.4%
  • County GDP in 2023: $98.0 million (0.00% of state GDP)
  • County GDP in 2022: $100.4 million (0.00% of state GDP)
  • Population change in county, 2022-2023: -0.68%
  • County population in 2023: 3,200 (0.01% of state population)
  • County population in 2022: 3,222 (0.01% of state population)
  • Median household income in county: $60,000 in 2023, $61,108 in 2022

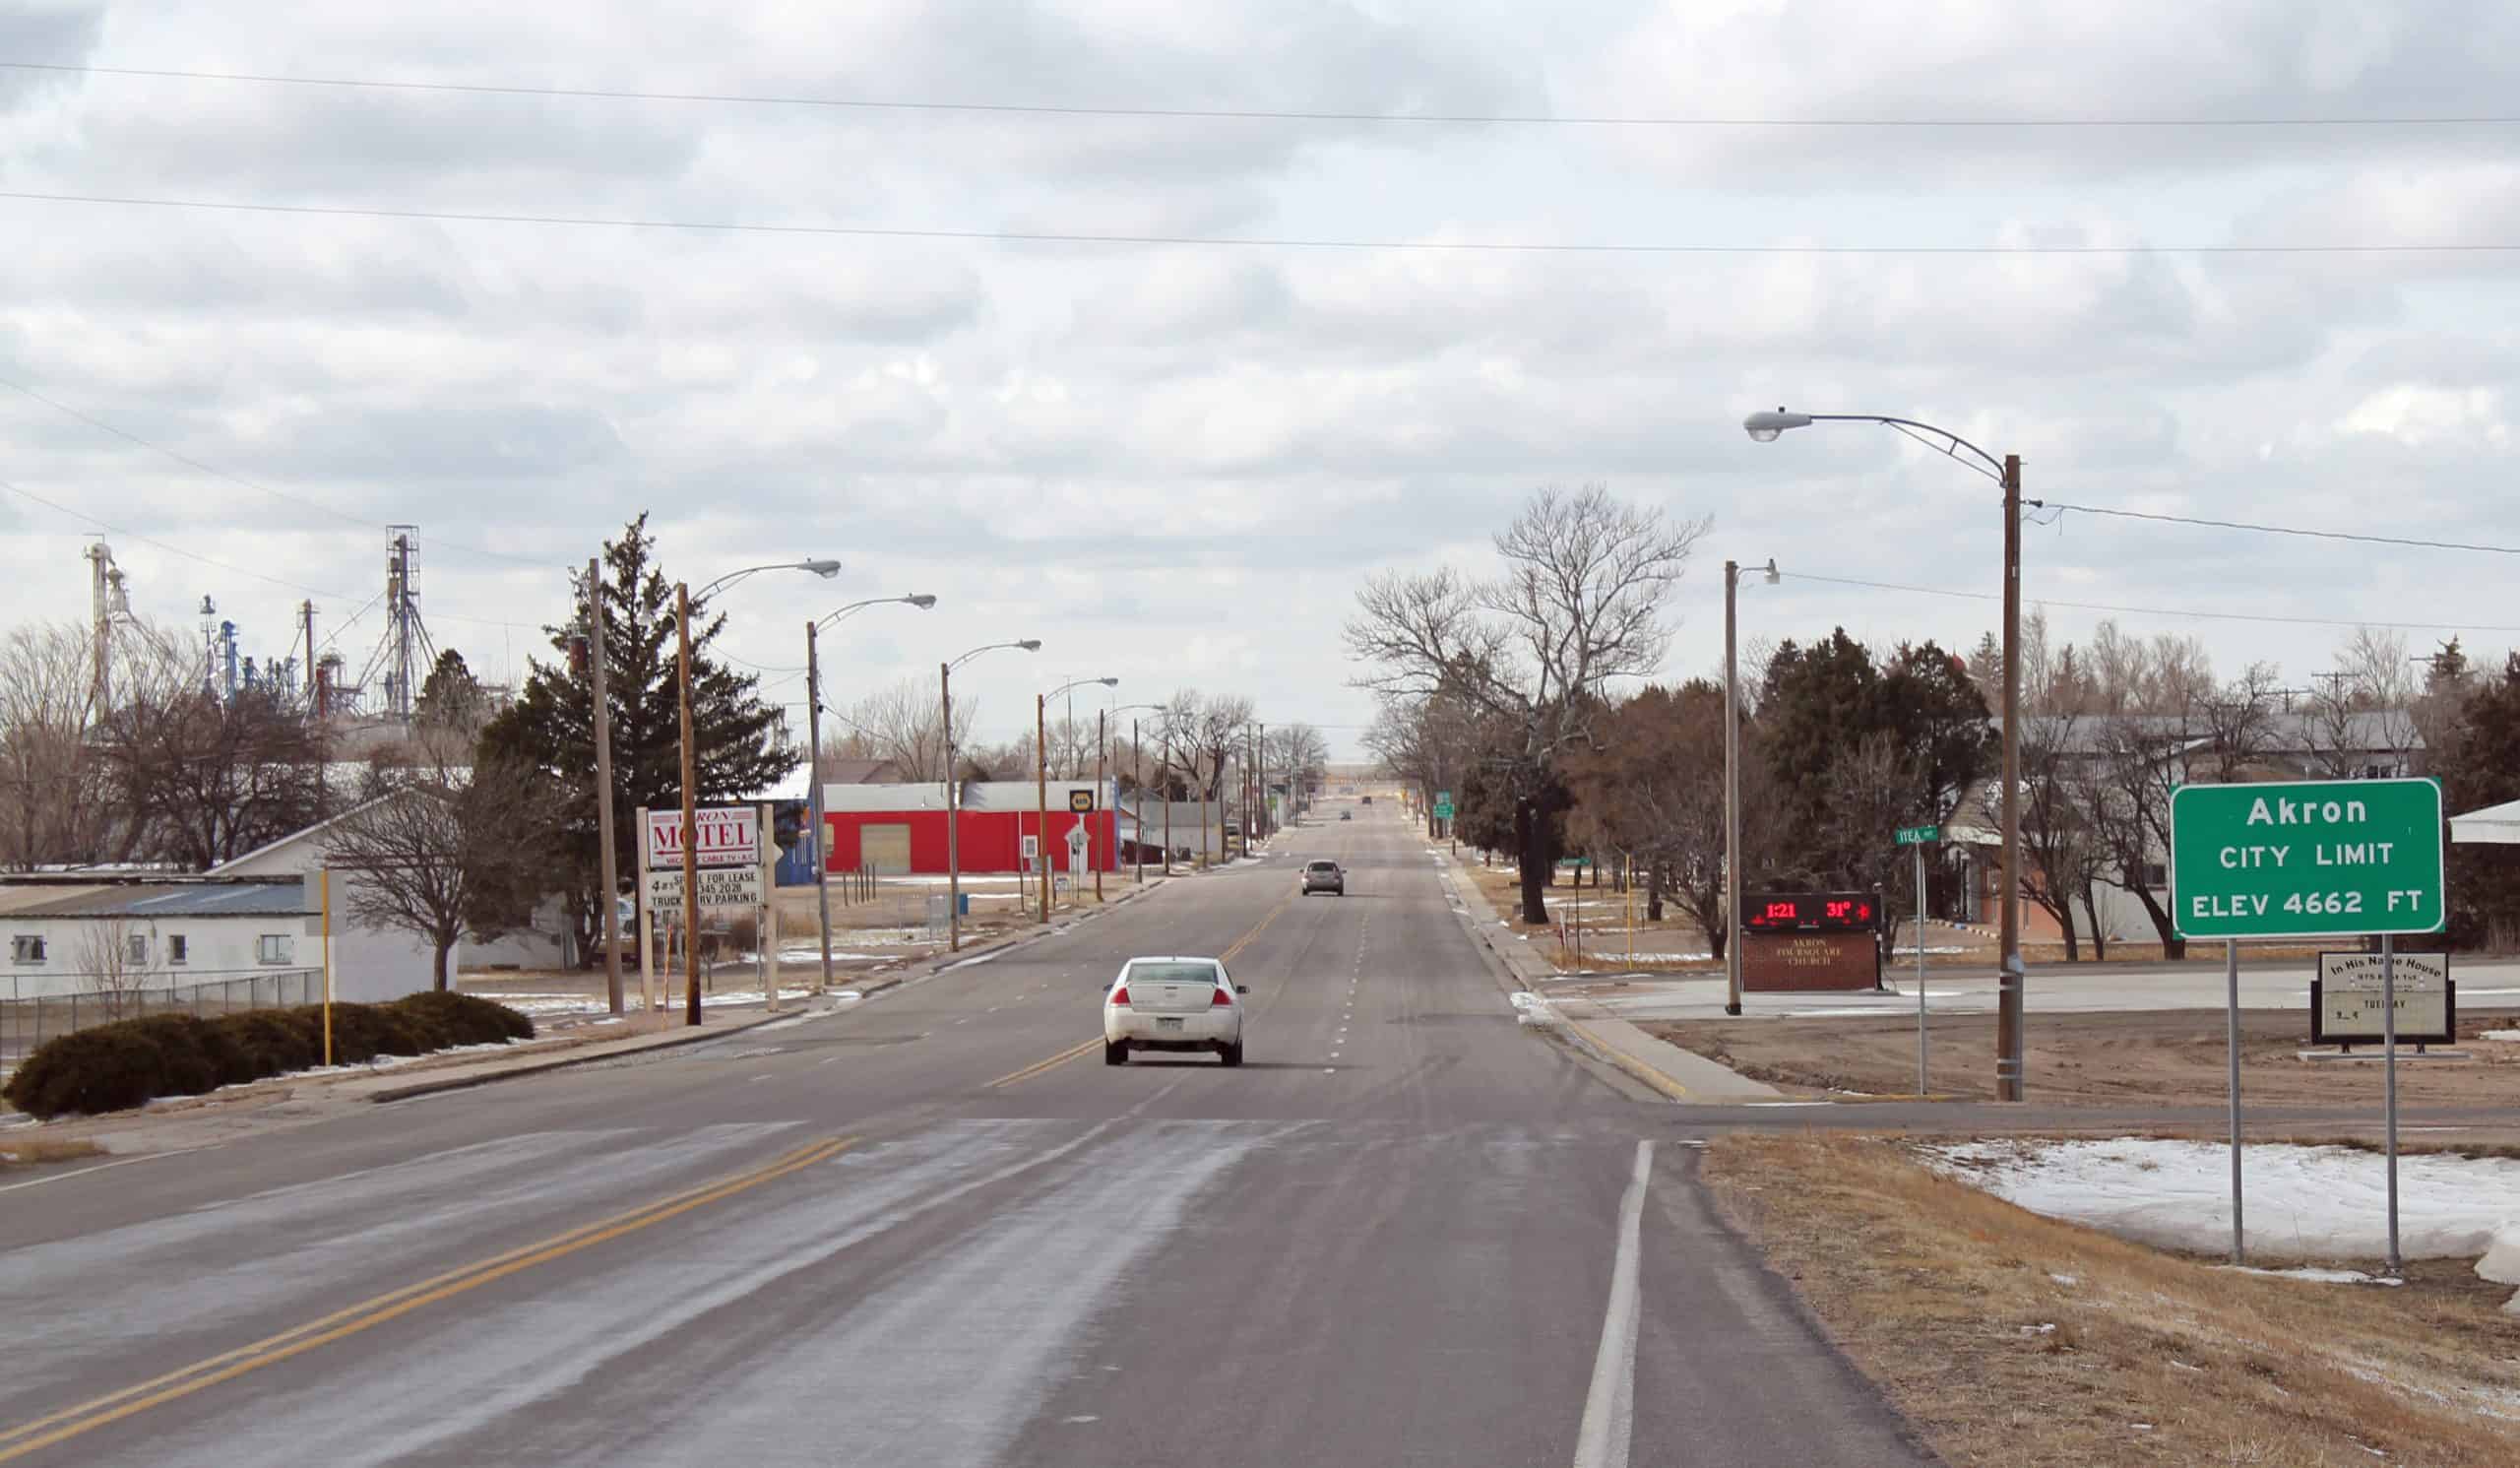
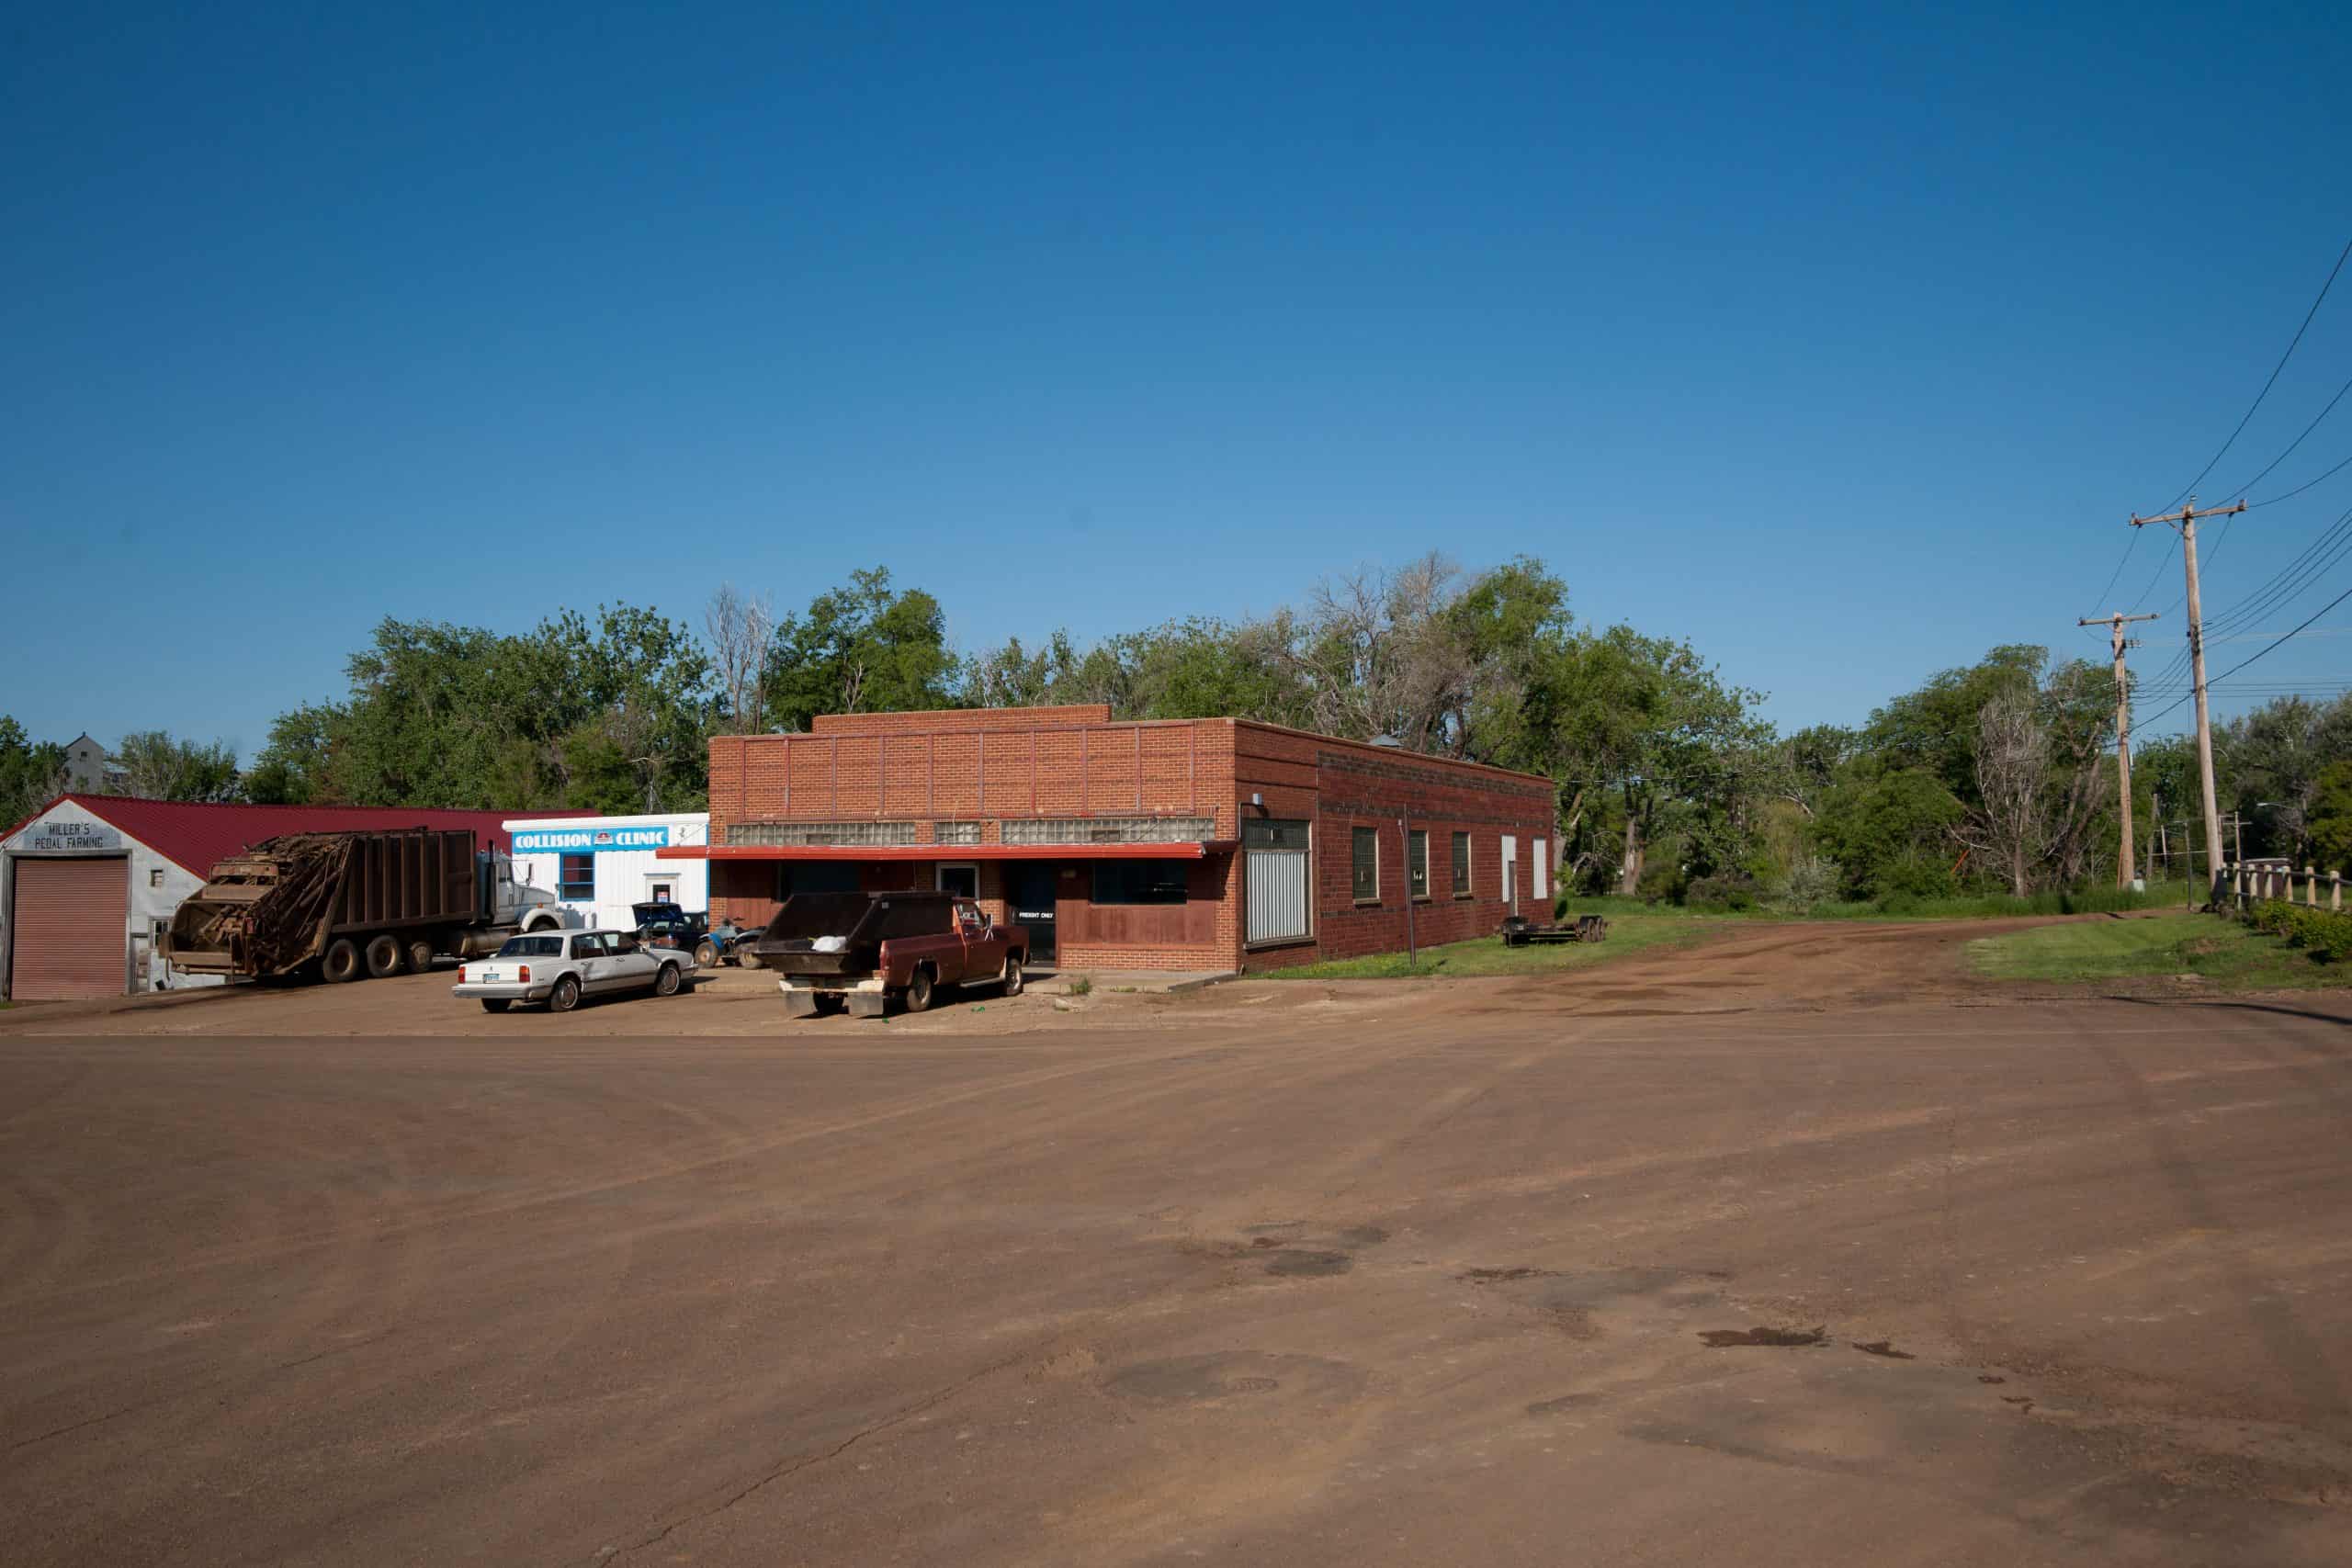
Colorado: Washington County

Jeffrey Beall / Wikimedia Commons
  • GDP growth in county, 2022-2023: -8.2%
  • County GDP in 2023: $186.8 million (0.04% of state GDP)
  • County GDP in 2022: $203.5 million (0.05% of state GDP)
  • Population change in county, 2022-2023: +0.17%
  • County population in 2023: 4,855 (0.08% of state population)
  • County population in 2022: 4,847 (0.08% of state population)
  • Median household income in county: $65,164 in 2023, $59,087 in 2022

Connecticut: Litchfield County

DenisTangneyJr / iStock via Getty Images
  • GDP growth in county, 2022-2023: +0.7%
  • County GDP in 2023: $9.1 billion (3.16% of state GDP)
  • County GDP in 2022: $9.0 billion (3.23% of state GDP)
  • Population change in county, 2022-2023: N/A
  • County population in 2023: N/A
  • County population in 2022: N/A
  • Median household income in county: N/A

Delaware: Kent County

  • GDP growth in county, 2022-2023: -1.3%
  • County GDP in 2023: $8.4 billion (10.79% of state GDP)
  • County GDP in 2022: $8.5 billion (11.05% of state GDP)
  • Population change in county, 2022-2023: +1.08%
  • County population in 2023: 189,789 (18.31% of state population)
  • County population in 2022: 187,758 (18.40% of state population)
  • Median household income in county: $72,872 in 2023, $69,278 in 2022

Florida: Hardee County

csfotoimages / iStock Editorial via Getty Images
  • GDP growth in county, 2022-2023: -7.6%
  • County GDP in 2023: $1.2 billion (0.09% of state GDP)
  • County GDP in 2022: $1.3 billion (0.10% of state GDP)
  • Population change in county, 2022-2023: +0.42%
  • County population in 2023: 25,760 (0.11% of state population)
  • County population in 2022: 25,651 (0.11% of state population)
  • Median household income in county: $54,231 in 2023, $44,665 in 2022

Georgia: Taliaferro County

  • GDP growth in county, 2022-2023: -14.6%
  • County GDP in 2023: $29.0 million (0.00% of state GDP)
  • County GDP in 2022: $34.0 million (0.01% of state GDP)
  • Population change in county, 2022-2023: +0.06%
  • County population in 2023: 1,609 (0.01% of state population)
  • County population in 2022: 1,608 (0.01% of state population)
  • Median household income in county: $48,036 in 2023, $45,881 in 2022

Hawaii: Maui + Kalawao County

chrys35 / iStock via Getty Images
  • GDP growth in county, 2022-2023: -0.6%
  • County GDP in 2023: $9.7 billion (10.96% of state GDP)
  • County GDP in 2022: $9.8 billion (10.52% of state GDP)
  • Population change in county, 2022-2023: N/A
  • County population in 2023: N/A
  • County population in 2022: N/A
  • Median household income in county: N/A

Idaho: Clark County

Public Domain / Wikimedia Commons
  • GDP growth in county, 2022-2023: -16.1%
  • County GDP in 2023: $39.1 million (0.04% of state GDP)
  • County GDP in 2022: $46.6 million (0.05% of state GDP)
  • Population change in county, 2022-2023: -1.11%
  • County population in 2023: 801 (0.04% of state population)
  • County population in 2022: 810 (0.04% of state population)
  • Median household income in county: $52,083 in 2023, $53,500 in 2022

Illinois: Massac County

Public Domain / Wikimedia Commons
  • GDP growth in county, 2022-2023: -37.4%
  • County GDP in 2023: $371.2 million (0.04% of state GDP)
  • County GDP in 2022: $593.0 million (0.07% of state GDP)
  • Population change in county, 2022-2023: -1.20%
  • County population in 2023: 13,661 (0.11% of state population)
  • County population in 2022: 13,827 (0.11% of state population)
  • Median household income in county: $62,584 in 2023, $57,365 in 2022

Indiana: Pike County

Public Domain / Wikimedia Commons
  • GDP growth in county, 2022-2023: -24.3%
  • County GDP in 2023: $531.8 million (0.13% of state GDP)
  • County GDP in 2022: $702.9 million (0.18% of state GDP)
  • Population change in county, 2022-2023: -0.30%
  • County population in 2023: 12,106 (0.18% of state population)
  • County population in 2022: 12,143 (0.18% of state population)
  • Median household income in county: $66,250 in 2023, $64,182 in 2022

Iowa: Emmet County

Scott Romine / Wikimedia Commons
  • GDP growth in county, 2022-2023: -12.9%
  • County GDP in 2023: $346.0 million (0.17% of state GDP)
  • County GDP in 2022: $397.3 million (0.20% of state GDP)
  • Population change in county, 2022-2023: +0.16%
  • County population in 2023: 9,229 (0.29% of state population)
  • County population in 2022: 9,214 (0.29% of state population)
  • Median household income in county: $65,181 in 2023, $64,461 in 2022

Kansas: Rawlins County

Public Domain / Wikimedia Commons
  • GDP growth in county, 2022-2023: -32.5%
  • County GDP in 2023: $129.5 million (0.07% of state GDP)
  • County GDP in 2022: $191.9 million (0.11% of state GDP)
  • Population change in county, 2022-2023: -2.38%
  • County population in 2023: 2,463 (0.08% of state population)
  • County population in 2022: 2,523 (0.09% of state population)
  • Median household income in county: $65,000 in 2023, $61,827 in 2022

Kentucky: Trimble County

Chris Light / Wikimedia Commons
  • GDP growth in county, 2022-2023: -19.6%
  • County GDP in 2023: $520.9 million (0.23% of state GDP)
  • County GDP in 2022: $647.9 million (0.29% of state GDP)
  • Population change in county, 2022-2023: +0.94%
  • County population in 2023: 8,607 (0.19% of state population)
  • County population in 2022: 8,527 (0.19% of state population)
  • Median household income in county: $67,813 in 2023, $66,492 in 2022

Louisiana: Cameron Parish

  • GDP growth in parish, 2022-2023: -10.7%
  • Parish GDP in 2023: $733.2 million (0.29% of state GDP)
  • Parish GDP in 2022: $820.7 million (0.35% of state GDP)
  • Population change in parish, 2022-2023: -2.61%
  • Parish population in 2023: 4,768 (0.10% of state population)
  • Parish population in 2022: 4,896 (0.11% of state population)
  • Median household income in parish: $72,500 in 2023, $69,847 in 2022

Maine: Waldo County

danlogan / iStock Editorial via Getty Images
  • GDP growth in county, 2022-2023: -2.4%
  • County GDP in 2023: $1.5 billion (2.04% of state GDP)
  • County GDP in 2022: $1.6 billion (2.15% of state GDP)
  • Population change in county, 2022-2023: +0.91%
  • County population in 2023: 40,620 (2.90% of state population)
  • County population in 2022: 40,255 (2.89% of state population)
  • Median household income in county: $68,441 in 2023, $62,694 in 2022

Maryland: Somerset County

  • GDP growth in county, 2022-2023: -17.7%
  • County GDP in 2023: $797.5 million (0.19% of state GDP)
  • County GDP in 2022: $968.6 million (0.23% of state GDP)
  • Population change in county, 2022-2023: +1.23%
  • County population in 2023: 24,910 (0.40% of state population)
  • County population in 2022: 24,608 (0.40% of state population)
  • Median household income in county: $52,462 in 2023, $52,149 in 2022

Massachusetts: Hampden County

DenisTangneyJr / iStock via Getty Images
  • GDP growth in county, 2022-2023: -0.1%
  • County GDP in 2023: $23.1 billion (3.76% of state GDP)
  • County GDP in 2022: $23.1 billion (3.80% of state GDP)
  • Population change in county, 2022-2023: -0.10%
  • County population in 2023: 460,291 (6.51% of state population)
  • County population in 2022: 460,758 (6.56% of state population)
  • Median household income in county: $70,535 in 2023, $66,619 in 2022

Michigan: Lake County

Roberto Galan / iStock Editorial via Getty Images
  • GDP growth in county, 2022-2023: -5.5%
  • County GDP in 2023: $215.2 million (0.04% of state GDP)
  • County GDP in 2022: $227.7 million (0.04% of state GDP)
  • Population change in county, 2022-2023: +0.66%
  • County population in 2023: 12,734 (0.13% of state population)
  • County population in 2022: 12,651 (0.13% of state population)
  • Median household income in county: $49,680 in 2023, $45,946 in 2022

Minnesota: Norman County

Mathieu Nicklay / Wikimedia Commons
  • GDP growth in county, 2022-2023: -25.4%
  • County GDP in 2023: $192.1 million (0.05% of state GDP)
  • County GDP in 2022: $257.5 million (0.07% of state GDP)
  • Population change in county, 2022-2023: -0.66%
  • County population in 2023: 6,329 (0.11% of state population)
  • County population in 2022: 6,371 (0.11% of state population)
  • Median household income in county: $69,833 in 2023, $65,278 in 2022

Mississippi: Kemper County

BOB WESTON / iStock via Getty Images
  • GDP growth in county, 2022-2023: -8.6%
  • County GDP in 2023: $286.2 million (0.24% of state GDP)
  • County GDP in 2022: $313.2 million (0.27% of state GDP)
  • Population change in county, 2022-2023: -0.99%
  • County population in 2023: 8,584 (0.29% of state population)
  • County population in 2022: 8,670 (0.29% of state population)
  • Median household income in county: $43,595 in 2023, $42,947 in 2022

Missouri: New Madrid County

Roberto Galan / iStock Editorial via Getty Images
  • GDP growth in county, 2022-2023: -11.2%
  • County GDP in 2023: $993.4 million (0.29% of state GDP)
  • County GDP in 2022: $1.1 billion (0.33% of state GDP)
  • Population change in county, 2022-2023: -1.82%
  • County population in 2023: 15,424 (0.25% of state population)
  • County population in 2022: 15,710 (0.25% of state population)
  • Median household income in county: $49,237 in 2023, $44,092 in 2022

Montana: McCone County

Ltvine / Wikimedia Commons
  • GDP growth in county, 2022-2023: -17.3%
  • County GDP in 2023: $82.8 million (0.14% of state GDP)
  • County GDP in 2022: $100.2 million (0.18% of state GDP)
  • Population change in county, 2022-2023: -2.05%
  • County population in 2023: 1,676 (0.15% of state population)
  • County population in 2022: 1,711 (0.15% of state population)
  • Median household income in county: $71,842 in 2023, $79,022 in 2022

Nebraska: Deuel County

Public Domain / Wikimedia Commons
  • GDP growth in county, 2022-2023: -17.7%
  • County GDP in 2023: $80.9 million (0.06% of state GDP)
  • County GDP in 2022: $98.3 million (0.07% of state GDP)
  • Population change in county, 2022-2023: -1.58%
  • County population in 2023: 1,871 (0.09% of state population)
  • County population in 2022: 1,901 (0.10% of state population)
  • Median household income in county: $61,438 in 2023, $58,875 in 2022

Nevada: Storey County

atlantic-kid / iStock Editorial via Getty Images
  • GDP growth in county, 2022-2023: -10.1%
  • County GDP in 2023: $2.0 billion (1.02% of state GDP)
  • County GDP in 2022: $2.2 billion (1.17% of state GDP)
  • Population change in county, 2022-2023: +0.29%
  • County population in 2023: 4,177 (0.13% of state population)
  • County population in 2022: 4,165 (0.13% of state population)
  • Median household income in county: $96,000 in 2023, $86,932 in 2022

New Hampshire: Sullivan County

DenisTangneyJr / iStock via Getty Images
  • GDP growth in county, 2022-2023: +0.2%
  • County GDP in 2023: $1.6 billion (1.70% of state GDP)
  • County GDP in 2022: $1.6 billion (0.24% of state GDP)
  • Population change in county, 2022-2023: +0.12%
  • County population in 2023: 43,969 (3.14% of state population)
  • County population in 2022: 43,918 (3.14% of state population)
  • Median household income in county: $75,929 in 2023, $70,788 in 2022

New Jersey: Morris County

DenisTangneyJr / iStock via Getty Images
  • GDP growth in county, 2022-2023: +0.3%
  • County GDP in 2023: $60.2 billion (9.07% of state GDP)
  • County GDP in 2022: $60.0 billion (9.23% of state GDP)
  • Population change in county, 2022-2023: +0.63%
  • County population in 2023: 514,423 (5.48% of state population)
  • County population in 2022: 511,219 (5.50% of state population)
  • Median household income in county: $134,929 in 2023, $130,808 in 2022

New Mexico: Union County

mtcurado / iStock via Getty Images
  • GDP growth in county, 2022-2023: -18.0%
  • County GDP in 2023: $128.9 million (0.12% of state GDP)
  • County GDP in 2022: $157.2 million (0.15% of state GDP)
  • Population change in county, 2022-2023: -0.45%
  • County population in 2023: 3,964 (0.19% of state population)
  • County population in 2022: 3,982 (0.19% of state population)
  • Median household income in county: $45,319 in 2023, $41,714 in 2022

New York: Greene County

rickberk / Getty Images
  • GDP growth in county, 2022-2023: -9.1%
  • County GDP in 2023: $2.5 billion (0.14% of state GDP)
  • County GDP in 2022: $2.7 billion (0.15% of state GDP)
  • Population change in county, 2022-2023: -0.60%
  • County population in 2023: 47,062 (0.24% of state population)
  • County population in 2022: 47,345 (0.24% of state population)
  • Median household income in county: $74,011 in 2023, $70,294 in 2022

North Carolina: Jones County

shep89292 / Wikimedia Commons
  • GDP growth in county, 2022-2023: -16.3%
  • County GDP in 2023: $209.9 million (0.03% of state GDP)
  • County GDP in 2022: $250.7 million (0.04% of state GDP)
  • Population change in county, 2022-2023: +1.97%
  • County population in 2023: 9,401 (0.09% of state population)
  • County population in 2022: 9,219 (0.09% of state population)
  • Median household income in county: $55,659 in 2023, $53,053 in 2022

North Dakota: Hettinger County

In memoriam afiler / Wikimedia Commons
  • GDP growth in county, 2022-2023: -29.7%
  • County GDP in 2023: $69.1 million (0.11% of state GDP)
  • County GDP in 2022: $98.4 million (0.18% of state GDP)
  • Population change in county, 2022-2023: +0.17%
  • County population in 2023: 2,415 (0.31% of state population)
  • County population in 2022: 2,411 (0.31% of state population)
  • Median household income in county: $70,827 in 2023, $66,797 in 2022

Ohio: Hancock County

Oralleff / iStock via Getty Images
  • GDP growth in county, 2022-2023: -3.9%
  • County GDP in 2023: $5.4 billion (0.76% of state GDP)
  • County GDP in 2022: $5.6 billion (0.81% of state GDP)
  • Population change in county, 2022-2023: -0.09%
  • County population in 2023: 74,704 (0.63% of state population)
  • County population in 2022: 74,774 (0.63% of state population)
  • Median household income in county: $69,699 in 2023, $67,006 in 2022

Oklahoma: Tillman County

  • GDP growth in county, 2022-2023: -11.9%
  • County GDP in 2023: $152.1 million (0.07% of state GDP)
  • County GDP in 2022: $172.6 million (0.09% of state GDP)
  • Population change in county, 2022-2023: -1.46%
  • County population in 2023: 6,869 (0.17% of state population)
  • County population in 2022: 6,971 (0.17% of state population)
  • Median household income in county: $47,445 in 2023, $46,306 in 2022

Oregon: Sherman County

Rex_Wholster / iStock via Getty Images
  • GDP growth in county, 2022-2023: -9.5%
  • County GDP in 2023: $547.5 million (0.21% of state GDP)
  • County GDP in 2022: $604.8 million (0.24% of state GDP)
  • Population change in county, 2022-2023: +0.21%
  • County population in 2023: 1,951 (0.05% of state population)
  • County population in 2022: 1,947 (0.05% of state population)
  • Median household income in county: $59,500 in 2023, $57,171 in 2022

Pennsylvania: Potter County

dougtone / Flickr
  • GDP growth in county, 2022-2023: -5.6%
  • County GDP in 2023: $748.1 million (0.09% of state GDP)
  • County GDP in 2022: $792.1 million (0.10% of state GDP)
  • Population change in county, 2022-2023: -1.28%
  • County population in 2023: 15,999 (0.12% of state population)
  • County population in 2022: 16,206 (0.12% of state population)
  • Median household income in county: $59,840 in 2023, $56,491 in 2022

Rhode Island: Providence County

SeanPavonePhoto / iStock via Getty Images
  • GDP growth in county, 2022-2023: +0.6%
  • County GDP in 2023: $36.9 billion (58.30% of state GDP)
  • County GDP in 2022: $36.7 billion (58.89% of state GDP)
  • Population change in county, 2022-2023: +0.49%
  • County population in 2023: 660,615 (59.87% of state population)
  • County population in 2022: 657,424 (59.79% of state population)
  • Median household income in county: $78,204 in 2023, $72,579 in 2022

South Carolina: Saluda County

Evanoco / Wikimedia Commons
  • GDP growth in county, 2022-2023: -8.2%
  • County GDP in 2023: $440.6 million (0.17% of state GDP)
  • County GDP in 2022: $479.9 million (0.19% of state GDP)
  • Population change in county, 2022-2023: +0.73%
  • County population in 2023: 19,123 (0.35% of state population)
  • County population in 2022: 18,984 (0.36% of state population)
  • Median household income in county: $52,957 in 2023, $51,041 in 2022

South Dakota: Potter County

  • GDP growth in county, 2022-2023: -19.9%
  • County GDP in 2023: $124.4 million (0.22% of state GDP)
  • County GDP in 2022: $155.3 million (0.28% of state GDP)
  • Population change in county, 2022-2023: -1.35%
  • County population in 2023: 2,413 (0.26% of state population)
  • County population in 2022: 2,446 (0.27% of state population)
  • Median household income in county: $71,726 in 2023, $71,786 in 2022

Tennessee: Clay County

  • GDP growth in county, 2022-2023: -25.1%
  • County GDP in 2023: $171.5 million (0.04% of state GDP)
  • County GDP in 2022: $228.8 million (0.06% of state GDP)
  • Population change in county, 2022-2023: +0.76%
  • County population in 2023: 7,714 (0.11% of state population)
  • County population in 2022: 7,656 (0.11% of state population)
  • Median household income in county: $44,712 in 2023, $39,572 in 2022

Texas: Terrell County

  • GDP growth in county, 2022-2023: -19.6%
  • County GDP in 2023: $57.0 million (0.00% of state GDP)
  • County GDP in 2022: $70.9 million (0.00% of state GDP)
  • Population change in county, 2022-2023: -0.15%
  • County population in 2023: 687 (0.00% of state population)
  • County population in 2022: 688 (0.00% of state population)
  • Median household income in county: $46,989 in 2023, $52,813 in 2022

Utah: Emery County

halbergman / iStock via Getty Images
  • GDP growth in county, 2022-2023: -15.5%
  • County GDP in 2023: $1.1 billion (0.50% of state GDP)
  • County GDP in 2022: $1.3 billion (0.62% of state GDP)
  • Population change in county, 2022-2023: +0.51%
  • County population in 2023: 10,144 (0.29% of state population)
  • County population in 2022: 10,093 (0.30% of state population)
  • Median household income in county: $69,956 in 2023, $67,056 in 2022

Vermont: Essex County

  • GDP growth in county, 2022-2023: -4.3%
  • County GDP in 2023: $135.9 million (0.39% of state GDP)
  • County GDP in 2022: $142.0 million (0.41% of state GDP)
  • Population change in county, 2022-2023: +0.22%
  • County population in 2023: 6,010 (0.93% of state population)
  • County population in 2022: 5,997 (0.93% of state population)
  • Median household income in county: $58,985 in 2023, $55,247 in 2022

Virginia: Accomack County

Public Domain / Wikimedia Commons
  • GDP growth in county, 2022-2023: -13.9%
  • County GDP in 2023: $1.5 billion (0.26% of state GDP)
  • County GDP in 2022: $1.8 billion (0.31% of state GDP)
  • Population change in county, 2022-2023: +0.05%
  • County population in 2023: 33,239 (0.38% of state population)
  • County population in 2022: 33,223 (0.38% of state population)
  • Median household income in county: $57,500 in 2023, $52,694 in 2022

Washington: Lincoln County

  • GDP growth in county, 2022-2023: -39.6%
  • County GDP in 2023: $357.6 million (0.05% of state GDP)
  • County GDP in 2022: $592.5 million (0.09% of state GDP)
  • Population change in county, 2022-2023: +1.08%
  • County population in 2023: 11,738 (0.15% of state population)
  • County population in 2022: 11,613 (0.15% of state population)
  • Median household income in county: $71,227 in 2023, $68,172 in 2022

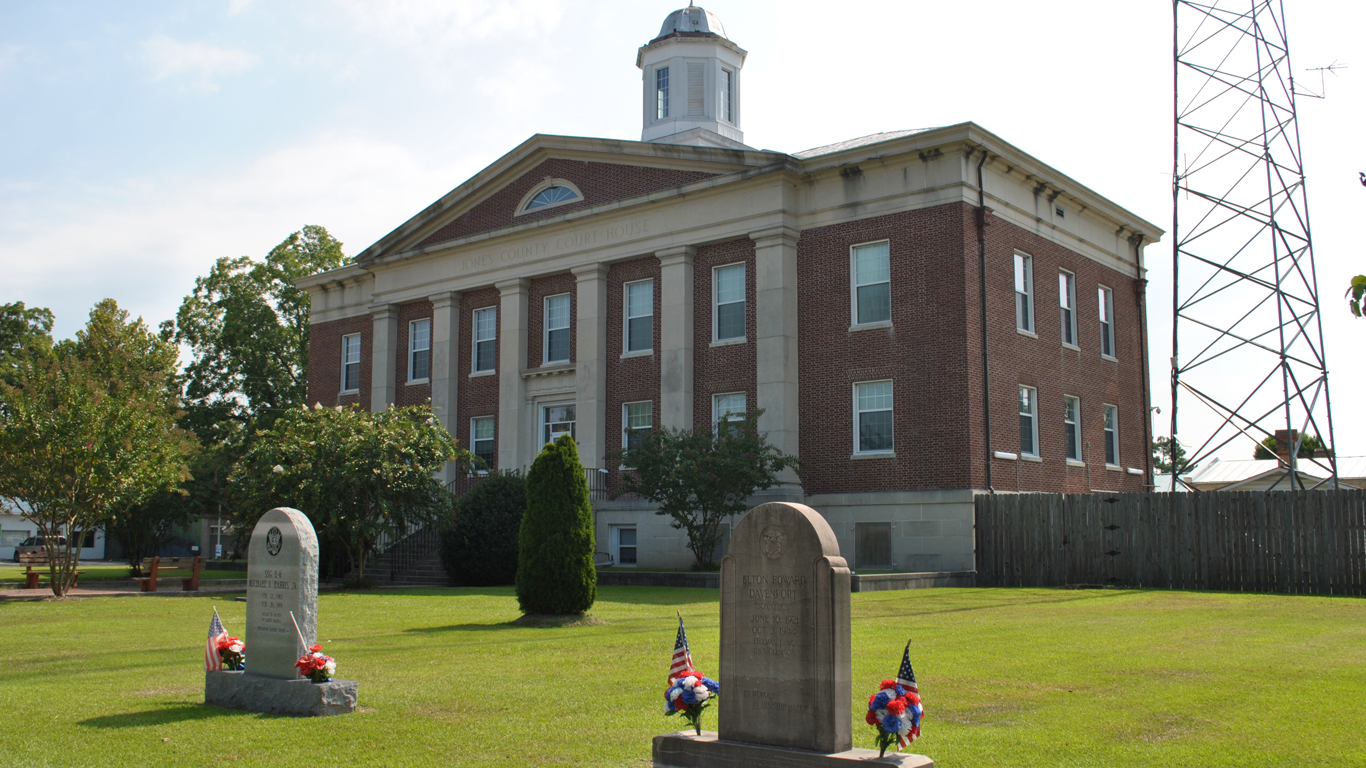
West Virginia: Pendleton County

traveler1116 / E+ via Getty Images
  • GDP growth in county, 2022-2023: -27.4%
  • County GDP in 2023: $154.9 million (0.19% of state GDP)
  • County GDP in 2022: $213.5 million (0.28% of state GDP)
  • Population change in county, 2022-2023: -0.63%
  • County population in 2023: 6,029 (0.34% of state population)
  • County population in 2022: 6,067 (0.34% of state population)
  • Median household income in county: $61,738 in 2023, $52,458 in 2022

Wisconsin: Buffalo County

MicheleVM / iStock via Getty Images
  • GDP growth in county, 2022-2023: -5.6%
  • County GDP in 2023: $562.3 million (0.16% of state GDP)
  • County GDP in 2022: $595.9 million (0.18% of state GDP)
  • Population change in county, 2022-2023: +0.22%
  • County population in 2023: 13,419 (0.23% of state population)
  • County population in 2022: 13,390 (0.23% of state population)
  • Median household income in county: $68,722 in 2023, $64,238 in 2022

Wyoming: Hot Springs County

PhilAugustavo / iStock via Getty Images
  • GDP growth in county, 2022-2023: -16.9%
  • County GDP in 2023: $223.5 million (0.56% of state GDP)
  • County GDP in 2022: $268.9 million (0.71% of state GDP)
  • Population change in county, 2022-2023: +0.82%
  • County population in 2023: 4,661 (0.80% of state population)
  • County population in 2022: 4,623 (0.79% of state population)
  • Median household income in county: $64,375 in 2023, $64,031 in 2022

The Average American Is Losing Momentum on Their Savings Every Day (Sponsor)

If you’re like many Americans and keep your money ‘safe’ in a checking or savings account, think again. The average yield on a savings account is a paltry .4%* today. Checking accounts are even worse.

But there is good news. To win qualified customers, some accounts are paying nearly 10x the national average! That’s an incredible way to keep your money safe and earn more at the same time. Our top pick for high yield savings accounts includes other benefits as well. You can earn up to 3.80% with a Checking & Savings Account today Sign up and get up to $300 with direct deposit. No account fees. FDIC Insured.

Click here to see how much more you could be earning on your savings today. It takes just a few minutes to open an account to make your money work for you.

* https://www.fdic.gov/national-rates-and-rate-caps

Thank you for reading! Have some feedback for us?
Contact the 24/7 Wall St. editorial team.

AI Portfolio

Discover Our Top AI Stocks

Our expert who first called NVIDIA in 2009 is predicting 2025 will see a historic AI breakthrough.

You can follow him investing $500,000 of his own money on our top AI stocks for free.