Total gasoline inventories increased by 8.2 million barrels last week and have moved to the middle of the five-year average range. Total motor gasoline supplied (the EIA’s measure of consumption) averaged 9.1 million barrels a day for the past four weeks, up by 3.9% compared with the same period a year ago.
Distillate inventories increased by 5.6 million barrels last week but remain near the lower limit of the average range. Distillate product supplied averaged over 3.7 million barrels a day over the past four weeks, down by 1.7% when compared with the same period last year. Distillate production averaged over 5.2 million barrels a day last week, roughly 200,000 barrels a day more than the prior week’s production.
Tuesday evening the American Petroleum Institute (API) reported that crude inventories rose by 4.4 million barrels in the week ending December 5. The trade group also said gasoline stockpiles were unchanged and distillate inventories rose by 2.5 million barrels. For the same period, analysts estimated a decrease of 3 million barrels in crude inventories.
ALSO READ: Major Oil Short Sellers May Have Missed the Boat
Before the EIA report, West Texas Intermediate (WTI) crude for January delivery was trading down more than 2.6% at around $62.10 a barrel Wednesday morning. The WTI price dipped further to around $61.75 (down about 3.4% for the day) immediately after the report was released.
For the past week, crude imports averaged more than 7.7 million barrels a day, up by 365,000 barrels a day compared with the previous week. Refineries were running at 95.4% of capacity, with daily input of about 16.6 million barrels a day, about 271,000 barrels a day above the previous week’s average.
The massive build in gasoline stockpiles combined with gains in both crude and distillate inventories could push the WTI price down to near $60 a barrel. So far, there seems to be no bottom in sight for crude prices.
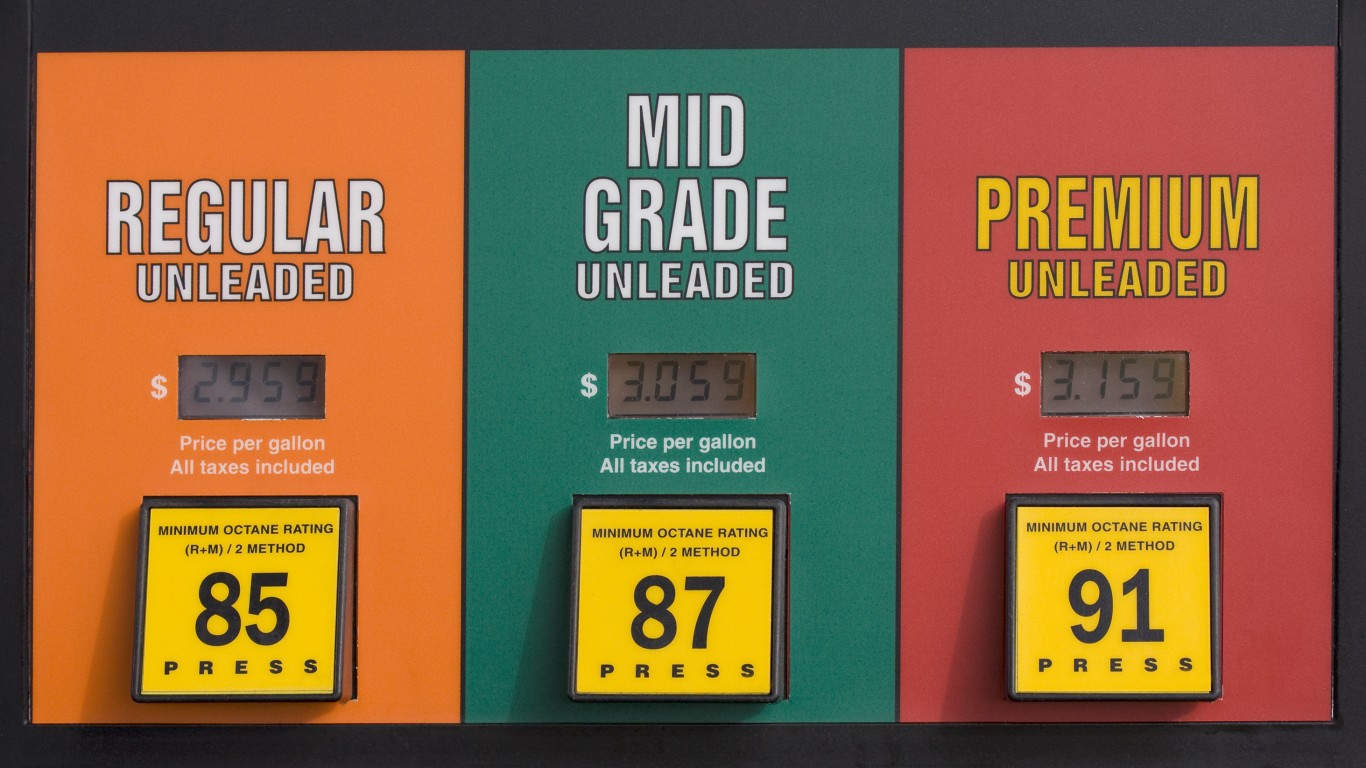
According to AAA, the current national average pump price per gallon of regular gasoline is $2.639, down from $2.746 a week ago and from $2.927 a month ago. Last year a gallon of regular cost $3.259 on average in the United States.
Here is a look at how share prices for two exchange traded funds reacted to the latest report.
The United States Oil ETF (NYSEMKT: USO) traded down about 4%, at $23.22 in a 52-week range of $23.12 to $39.44. The low was set Wednesday.
The Market Vectors Oil Services ETF (NYSEMKT: OIH) traded down about 3.3%, at $35.24 in a 52-week range of $35.10 to $58.01. The low here was also set Wednesday morning.
ALSO READ: Will Oil Drop to $40?
It’s Your Money, Your Future—Own It (sponsor)
Are you ahead, or behind on retirement? For families with more than $500,000 saved for retirement, finding a financial advisor who puts your interest first can be the difference, and today it’s easier than ever. SmartAsset’s free tool matches you with up to three fiduciary financial advisors who serve your area in minutes. Each advisor has been carefully vetted and must act in your best interests. Start your search now.
If you’ve saved and built a substantial nest egg for you and your family, don’t delay; get started right here and help your retirement dreams become a retirement reality.
Thank you for reading! Have some feedback for us?
Contact the 24/7 Wall St. editorial team.


