Tuesday evening, the American Petroleum Institute (API) reported that crude inventories rose by 7.6 million barrels in the week ending August 28. For the same period, analysts surveyed by The Wall Street Journal had estimated an increase of 100,000 barrels in crude inventories.
Total gasoline inventories decreased by 300,000 barrels last week, according to the EIA, and remain in the middle of the five-year average range. Total motor gasoline supplied (the agency’s measure of consumption) averaged 9.5 million barrels a day for the past four weeks, up by 4.8% compared with the same period a year ago.
In three trading sessions through Monday, the price of crude rose more than 25% on relatively little hard news. Analysts parsing the OPEC Bulletin that was published on Monday thought they saw an indication that the cartel — and especially Saudi Arabia — would be willing to cut production if that would help boost the price of crude. Maybe, but the kingdom’s production was up by 350,000 barrels a day between April and July. The Saudis themselves have given no indication that they have any intention of changing strategy.
ALSO READ: The Top-Selling Products From Each State
The one thing we overlooked when trying to figure out why crude prices spiked last week was the futures market. We do look at the Commitment of Traders report from the Commodity Futures Trading Commission (CFTC) weekly, but sometimes it takes a while for the obvious to sink in: much of last Thursday’s and Friday’s increase in the price of crude was very likely short covering. As we noted in our weekly report on the oil rig count, hedge funds cut their short positions in the seven-day period ended August 25, but when crude prices began rising last Thursday, covering those remaining short positions was an imperative. There is nothing like a short squeeze to give a stock or a commodity a boost, and that certainly contributed to last week’s exuberance for oil.
Before the EIA report, West Texas Intermediate (WTI) crude for October delivery traded down about 0.5% at around $45.20 a barrel. The WTI price plummeted to around $44.50, down about 2% on the day, shortly after the report was released. The 52-week range on WTI futures is $37.75 to $91.84.
Distillate inventories increased by 100,000 barrels last week and remain in the middle of the average range for this time of year. Distillate product supplied averaged 3.7 million barrels a day over the past four weeks, down by 5.3% when compared with the same period last year. Distillate production averaged over 4.9 million barrels a day last week, up less than 100,000 barrels a day compared with the prior week’s production.
For the past week, crude imports averaged 7.9 million barrels a day, up by 656,000 barrels a day compared with the previous week. Refineries were running at 92.8% of capacity, with daily input of about 16.4 million barrels, about 269,000 barrels a day below the previous week’s average.
ALSO READ: Will Lifting the US Ban on Oil Exports Really Make a Difference?
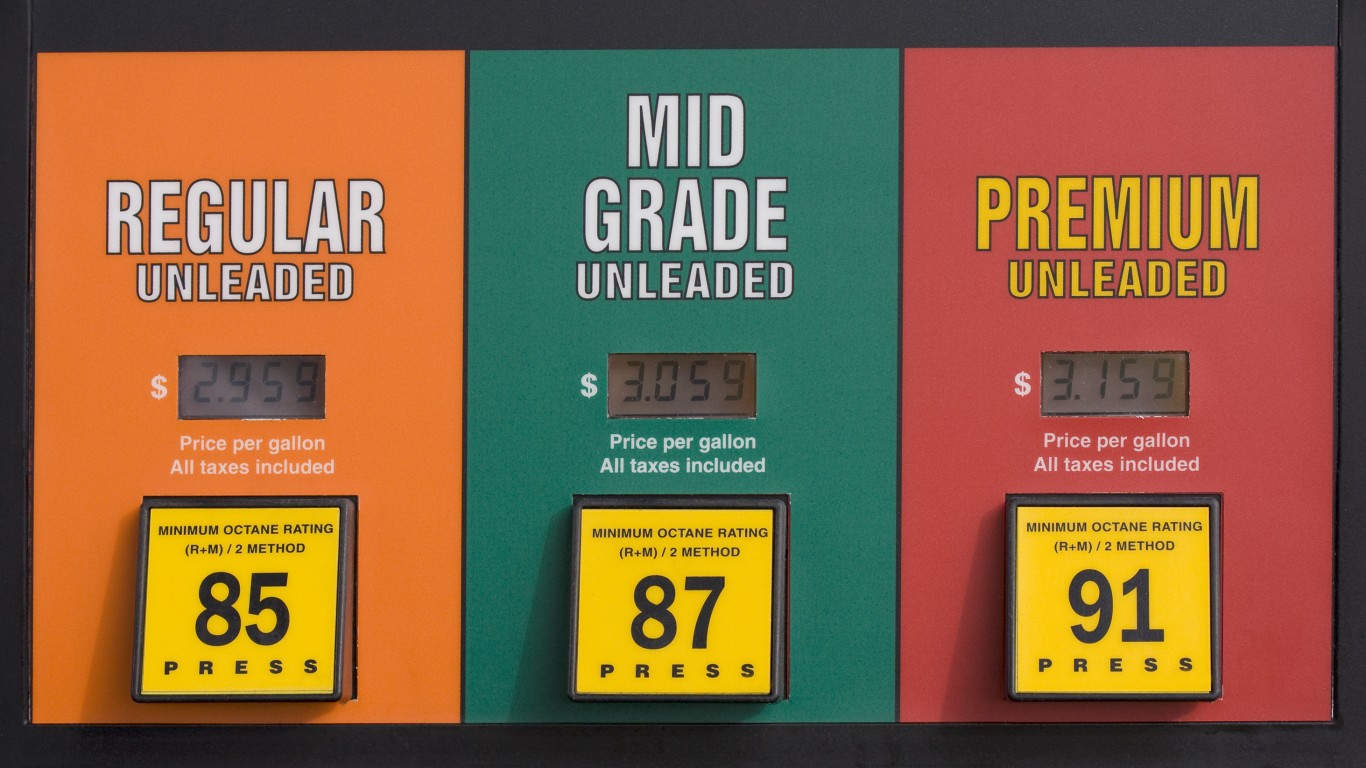
According to AAA, the current national average pump price per gallon of regular gasoline is $2.447, down from $2.556 a week ago and from $2.652 a month ago. Last year at this time, a gallon of regular cost $3.434 on average in the United States.
Here is a look at how share prices for two blue-chip stocks and two exchange traded funds reacted to Wednesday’s report.
Exxon Mobil Corp. (NYSE: XOM) traded up about 0.3%, at $72.30 in a 52-week range of $66.55 to $99.59. Year to date, Exxon stock traded down about 22% and is down about 25% since early November as of Tuesday’s close.
Chevron Corp. (NYSE: CVX) traded down about 0.5%, at $77.80 in a 52-week range of $69.58 to $129.38. As of the most recent close, Chevron shares have dropped about 31% year to date and trade down more than 35% since early November.
The United States Oil ETF (NYSEMKT: USO) traded down about 1.8%, at $14.55 in a 52-week range of $12.37 to $35.76.
The Market Vectors Oil Services ETF (NYSEMKT: OIH) traded down about 1.9%, at $29.77 in a 52-week range of $26.00 to $55.30.
ALSO READ: What Warren Buffett Sees in Phillips 66 That You Don’t
Take Charge of Your Retirement: Find the Right Financial Advisor For You in Minutes (Sponsor)
Retirement planning doesn’t have to feel overwhelming. The key is finding professional guidance—and we’ve made it easier than ever for you to connect with the right financial advisor for your unique needs.
Here’s how it works:
1️ Answer a Few Simple Questions
Tell us a bit about your goals and preferences—it only takes a few minutes!
2️ Get Your Top Advisor Matches
This tool matches you with qualified advisors who specialize in helping people like you achieve financial success.
3️ Choose Your Best Fit
Review their profiles, schedule an introductory meeting, and select the advisor who feels right for you.
Why wait? Start building the retirement you’ve always dreamed of. Click here to get started today!
Thank you for reading! Have some feedback for us?
Contact the 24/7 Wall St. editorial team.


