The U.S. Energy Information Administration (EIA) released its weekly petroleum status report Wednesday morning. U.S. commercial crude inventories decreased by 5.9 million barrels last week, maintaining a total U.S. commercial crude inventory of 484.8 million barrels. The commercial crude inventory remains near levels not seen at this time of year in at least the past 80 years.
Tuesday evening, the American Petroleum Institute (API) reported that crude inventories fell by 3.6 million barrels in the week ending December 18. For the same period, analysts had estimated an increase of 1 million barrels in crude inventories.
Total gasoline inventories increased by 1.1 million barrels last week, according to the EIA, and dropped into the lower half of the five-year average range. Total motor gasoline supplied (the agency’s measure of consumption) averaged 9.3 million barrels a day for the past four weeks, up by 0.7% compared with the same period a year ago.
Crude oil was gaining strength Wednesday following the release of OPEC’s World Oil Outlook. The cartel sees the price rising to around $70 a barrel by 2020 and that has lifted hopes that prices will begin edging higher with just four years to go.
Adding fuel to the outlook is the lifting of the 40-year ban on U.S. crude oil exports. Regardless of the fact that the EIA has estimated only a negligible impact from the action, in the short term, prices are likely to be volatile. That means getting in now may pay off in six months no matter, which direction prices take.
Before the EIA report, benchmark West Texas Intermediate (WTI) crude for February delivery traded up about 2.5% at around $37.05 a barrel. WTI settled at $36.14 on Tuesday and jumped to around $37.30 immediately after the report’s release. The 52-week range on WTI futures is $35.53 to $65.50.
Distillate inventories decreased by 700,000 barrels last week and remained in the upper half of the average range for this time of year. Distillate product supplied averaged 3.6 million barrels a day over the past four weeks, down by 7.4% when compared with the same period last year. Distillate production averaged over 4.9 million barrels a day last week, down about 200,000 barrels a day compared with the prior week’s production.
For the past week, crude imports averaged over 7.3 million barrels a day, down about 986,000 barrels a day compared with the previous week. Refineries were running at 91.3% of capacity, with daily input of averaging about 16.5 million barrels, about 143,000 barrels a day below the previous week’s average.
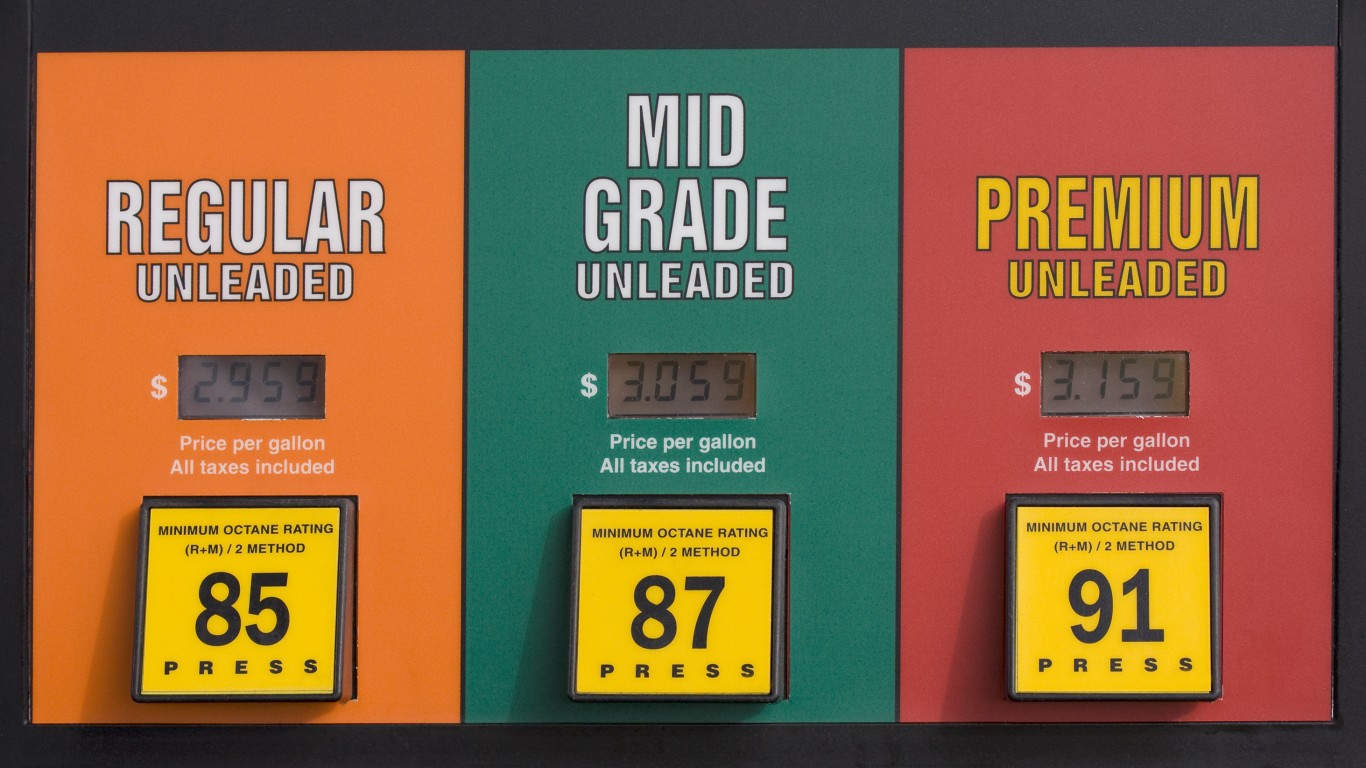
According to AAA, the current national average pump price per gallon of regular gasoline is $2.009, down about 0.1% from $2.011 a week ago and from $2.072 a month ago. Last year at this time, a gallon of regular gasoline cost $2.376 on average in the United States.
Here is a look at how share prices for two blue-chip stocks and two exchange traded funds reacted to this latest report.
Exxon Mobil Corp. (NYSE: XOM) traded up about 1.6%, at $78.96 in a 52-week range of $66.55 to $94.43. Year to date, Exxon stock traded down about 14.7% and is down about 18.4% since early November of 2014, as of Tuesday’s close.
Chevron Corp. (NYSE: CVX) traded up about 2.3%, at $92.38 in a 52-week range of $69.58 to $114.38. As of Tuesday’s close, Chevron shares have dropped about 17.9% year to date and traded down about 23.2% since early November 2014.
The United States Oil ETF (NYSEMKT: USO) traded up about 3.9%, at $11.18 in a 52-week range of $10.52 to $21.50.
The Market Vectors Oil Services ETF (NYSEMKT: OIH) traded up about 3.4% to $27.35, in a 52-week range of $25.40 to $39.80.
Take Charge of Your Retirement In Just A Few Minutes (Sponsor)
Retirement planning doesn’t have to feel overwhelming. The key is finding expert guidance—and SmartAsset’s simple quiz makes it easier than ever for you to connect with a vetted financial advisor.
Here’s how it works:
- Answer a Few Simple Questions. Tell us a bit about your goals and preferences—it only takes a few minutes!
- Get Matched with Vetted Advisors Our smart tool matches you with up to three pre-screened, vetted advisors who serve your area and are held to a fiduciary standard to act in your best interests. Click here to begin
- Choose Your Fit Review their profiles, schedule an introductory call (or meet in person), and select the advisor who feel is right for you.
Why wait? Start building the retirement you’ve always dreamed of. Click here to get started today!
Thank you for reading! Have some feedback for us?
Contact the 24/7 Wall St. editorial team.
 24/7 Wall St.


