
This post may contain links from our sponsors and affiliates, and Flywheel Publishing may receive
compensation for actions taken through them.
The U.S. Energy Information Administration (EIA) released its weekly petroleum status report Wednesday morning. U.S. commercial crude inventories increased by 6.6 million barrels last week, maintaining a total U.S. commercial crude inventory of 536.5 million barrels. The commercial crude inventory remains at historically high levels for this time of year, according to the EIA.
Tuesday evening, the American Petroleum Institute (API) reported that crude inventories rose by 6.2 million barrels in the week ending April 8. For the same period, analysts had estimated an increase of 1.9 million barrels in crude inventories. API also reported gasoline supplies fell by 1.58 million barrels and distillate stockpiles fell by 530,000 barrels.
Total gasoline inventories decreased by 4.2 million barrels last week, according to the EIA, and remain well above the upper limit of the five-year average range. Total motor gasoline supplied (the agency’s measure of consumption) averaged 9.4 million barrels a day for the past four weeks, up by 5.7% compared with the same period a year ago.
Benchmark West Texas Intermediate (WTI) prices have risen more or less steadily over the past week based on a variety of factors. The dollar has weakened, always a plus for crude oil that is priced in dollars. Fed Chair Janet Yellen continues to signal that policy rate hikes will be slow. This Sunday’s scheduled meeting between OPEC members and other oil-producing nations also continues to raise hopes for a production freeze at least, and maybe an agreed production cut. The latter will never happen.
 24/7 Wall St.
Before the EIA report, WTI crude for May delivery traded down about 1.2% at around $41.68 a barrel. WTI settled at $42.17 on Tuesday, its highest level of the year to date, and slipped to around $41.50 shortly after the report’s release. The 52-week range on WTI futures is $29.85 to $65.39.
Distillate inventories increased by 500,000 barrels last week and remain well above the upper limit of the average range for this time of year. Distillate product supplied averaged about 3.7 million barrels a day over the past four weeks, down by 7.1% when compared with the same period last year. Distillate production averaged 4.8 million barrels a day last week, down by about 100,000 barrels a day from the prior week.
For the past week, crude imports averaged over 7.9 million barrels a day, up by 686,000 barrels a day compared with the previous week. Refineries were running at 89.2% of capacity, with daily input averaging over 15.9 million barrels, about 492,000 barrels a day below the previous week’s average.
With refinery utilization down as maintenance and turnarounds continue, the inventories at refineries pretty much have to rise. Including the higher import level last week, the jump in inventories is essentially all accounted for.
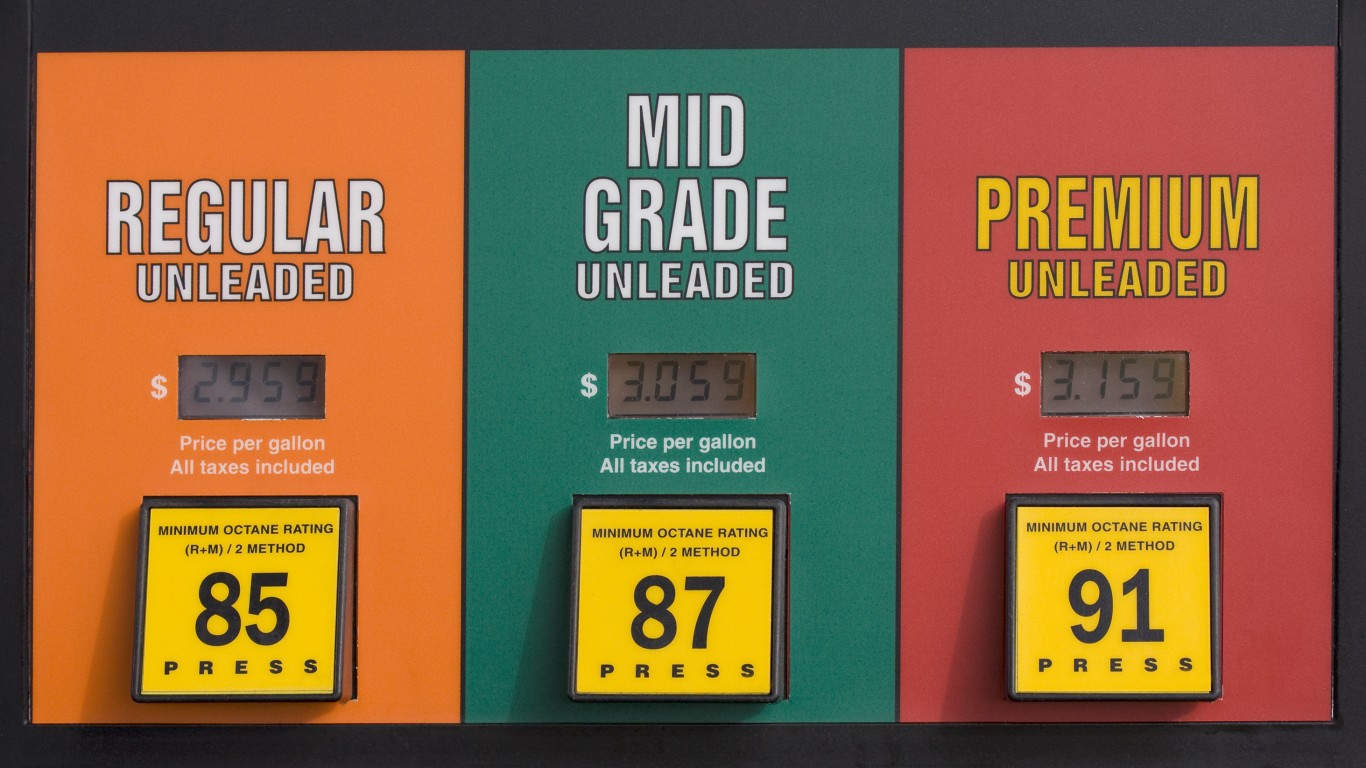
According to AAA, the current national average pump price per gallon of regular gasoline is $2.081, up from $2.047 a week ago and up about 15 cents compared with the month-ago price. Last year at this time, a gallon of regular gasoline cost $2.388 on average in the United States.
Here is a look at how share prices for two blue-chip stocks and two exchange traded funds reacted to this latest report:
Exxon Mobil Corp. (NYSE: XOM) traded down about 0.4%, at $84.34 in a 52-week range of $66.55 to $90.09. Over the past 12 months, Exxon stock has traded down about 1.2% and is down about 18% since August 2014, as of Tuesday’s close.
Chevron Corp. (NYSE: CVX) traded up about 0.2%, at $97.70 in a 52-week range of $69.58 to $112.20. As of Tuesday’s close, Chevron shares have dropped about 8.3% over the past 12 months and trade down nearly 27% since August 2014.
The United States Oil ETF (NYSEMKT: USO) traded flat, at $10.64 in a 52-week range of $7.67 to $21.50.
The Market Vectors Oil Services ETF (NYSEMKT: OIH) traded up about 1% to $27.44, in a 52-week range of $20.46 to $39.80.
Take This Retirement Quiz To Get Matched With An Advisor Now (Sponsored)
Are you ready for retirement? Planning for retirement can be overwhelming, that’s why it could be a good idea to speak to a fiduciary financial advisor about your goals today.
Start by taking this retirement quiz right here from SmartAsset that will match you with up to 3 financial advisors that serve your area and beyond in 5 minutes. Smart Asset is now matching over 50,000 people a month.
Click here now to get started.
Thank you for reading! Have some feedback for us?
Contact the 24/7 Wall St. editorial team.
Latest from 24/7


Our expert who first called NVIDIA in 2009 is predicting 2025 will see a historic AI breakthrough.
You can follow him investing $500,000 of his own money on our top AI stocks for free.