This post may contain links from our sponsors and affiliates, and Flywheel Publishing may receive
compensation for actions taken through them.
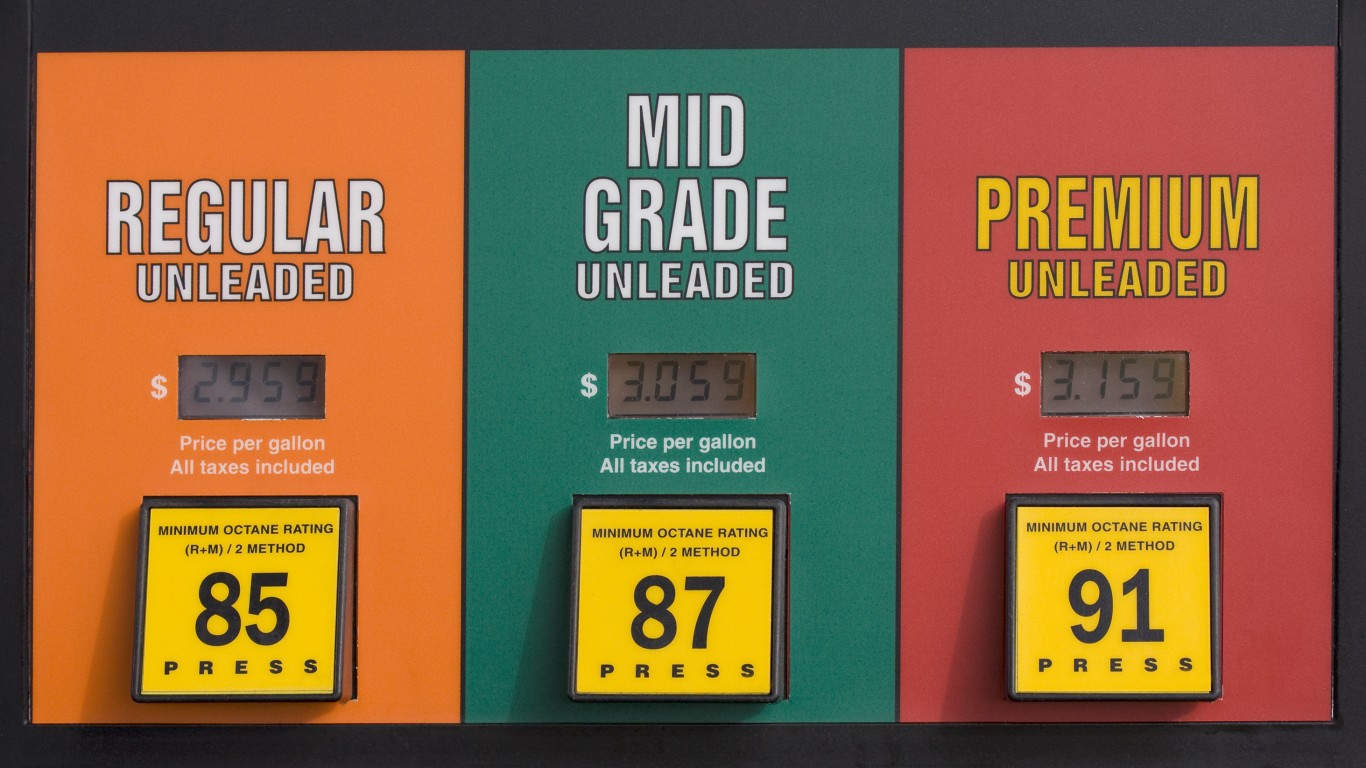
In its March version of the Short Term Energy Outlook (STEO), the U.S. Energy Information Administration (EIA) projected an average summer driving season price of $2.04 per gallon. On Tuesday, that projection was raised to $2.21, 8% higher than last month’s estimate, but still 42 cents a gallon below last summer’s average.
For all of 2016 the EIA is forecasting an average U.S. pump price of $2.08 a gallon, up 14 cents a gallon from last month’s forecast. The agency’s forecast for 2017 now calls for an average pump price of $2.24 per gallon, up 24 cents per gallon since last month.
EIA estimates that crude oil production for the month of April 2016 averaged 9 million barrels a day, 100,000 barrels a day below the March 2016 level, and 700,000 barrels a day below the 9.7 million barrel level reached in April 2015. U.S. crude oil production averaged 9.4 million barrels a day in 2015, and the EIA projects that to decline to 8.6 million barrels a day in 2016 and to 8.2 million barrels a day in 2017. The 2017 average has been raised by about 100,000 barrels a day since the April STEO was published.
Despite recent price increases for both West Texas Intermediate (WTI) and Brent crude oil, global inventories are expected to rise by an average of 900,000 barrels a day in the second and third quarters of 2016. Inventory drawdowns are not forecast to begin until the third quarter of next year. Crude oil prices are expected to start rising in the first half of 2017 and price hikes are expected to accelerate in the second half of the year.
The price for Brent crude is expected to average $42 a barrel in the second and third quarters of 2016, rising to $44 a barrel in the fourth quarter. Prices in 2017 are expected to average about $51 a barrel with the fourth-quarter average up to $57 a barrel.
WTI prices are forecast to be slightly less than Brent prices through this year and then to match Brent prices in 2017.
Regarding oil markets the EIA noted:
The discount of front-month prices to third-month prices for the WTI futures curves narrowed and front-month Brent prices briefly traded at a premium in April. Although global inventories are still building, a reduction in contango signals a tighter near-term crude oil market compared to earlier this year. … For international markets, an uptick in both planned and unplanned supply disruptions, particularly in OPEC countries and more recently from wildfires in Canada, are likely contributing to the tighter conditions. In the United States, the pace of commercial crude oil inventory builds slowed compared to earlier this year. In January and February, commercial crude oil inventories in the United States averaged builds of about 19 million barrels per month but in March and April inventories builds declined to about 14 million barrels per month.
Natural gas working inventories totaled 2.625 trillion cubic feet (Tcf) on April 29, 49% higher than a year earlier and 47% higher than the previous five-year (2011-15) average for that week. April is typically the beginning of the inventory injection season, which runs through October. EIA projects natural gas inventories will reach 4.158 Tcf at the end of October 2016, which would be the highest end-of-October level on record. Spot prices are forecast to average $2.25 per million BTUs in 2016 and $3.02 per million BTUs in 2017, compared with an average of $2.63 per million BTUs in 2015.
Want to Retire Early? Start Here (Sponsor)
Want retirement to come a few years earlier than you’d planned? Or are you ready to retire now, but want an extra set of eyes on your finances?
Now you can speak with up to 3 financial experts in your area for FREE. By simply clicking here you can begin to match with financial professionals who can help you build your plan to retire early. And the best part? The first conversation with them is free.
Click here to match with up to 3 financial pros who would be excited to help you make financial decisions.
Have questions about retirement or personal finance? Email us at [email protected]!
By emailing your questions to 24/7 Wall St., you agree to have them published anonymously on a673b.bigscoots-temp.com.
By submitting your story, you understand and agree that we may use your story, or versions of it, in all media and platforms, including via third parties.
Thank you for reading! Have some feedback for us?
Contact the 24/7 Wall St. editorial team.


