The U.S. Energy Information Administration (EIA) released its weekly petroleum status report Wednesday morning. U.S. commercial crude inventories decreased by 1.8 million barrels last week, maintaining a total U.S. commercial crude inventory of 520.8 million barrels. The commercial crude inventory remained in the upper half of the average range for this time of year.
Tuesday evening the American Petroleum Institute (API) reported that crude inventories rose by 882,000 barrels in the week ending May 12. API also reported gasoline supplies decreased by 1.78 million barrels and distillate inventories increased by 1.79 million barrels.
For the same period, an S&P Global Platts survey of analysts had consensus estimates for a decrease of 2.2 million barrels in crude inventories, a decrease of 500,000 barrels in gasoline inventories, and a drop of 1.3 million barrels in distillate stockpiles.
Total gasoline inventories decreased by 400,000 barrels last week, according to the EIA, and remain above the upper limit of the five-year average range. Total motor gasoline supplied (the agency’s measure of consumption) averaged 9.3 million barrels a day for the past four weeks, down by 2.6% compared with the same period a year ago.
Platts oil futures editor Geoffrey Craig said:
U.S. crude oil stocks have shown a drawdown during the last five weeks by 13 million barrels, compared with a build of 10.4 million barrels from 2012-16 over the same period.
Strong refinery activity has been the main catalyst behind the drawdown, but fewer imports the week that ended May 5 served as another driver.
Imports dropped 644,000 barrels per day (b/d) to 7.62 million b/d, averaging 8.1 million b/d year to date, versus 7.8 million b/d over the same period in 2016, exceeding the year-ago level despite OPEC-led supply cuts being in place.
Because import figures can fluctuate sharply on a weekly basis, traders will be looking for further signs that imports have indeed started trending lower possibly on account of OPEC cuts finally materializing.
Before the EIA report, benchmark West Texas Intermediate (WTI) crude for June delivery traded up about 0.2% at around $48.75 a barrel and rose to $49.22 shortly after the report’s release. WTI crude settled at $48.66 on Tuesday. The 52-week range on June futures is $43.76 to $57.95.
Distillate inventories fell by 1.9 million barrels last week and remain in the upper half of the average range for this time of year. Distillate product supplied averaged about 4.1 million barrels a day over the past four weeks, down by 0.8% compared with the same period last year. Distillate production averaged over 5 million barrels a day last week, roughly flat compared with the prior week’s production.
For the past week, crude imports averaged 8.6 million barrels a day, up by 970,,000 barrels a day compared with the previous week. Refineries were running at 93.4% of capacity, with daily input averaging over 17.1 million barrels a day, about 363,000 barrels a day more than the previous week’s average.
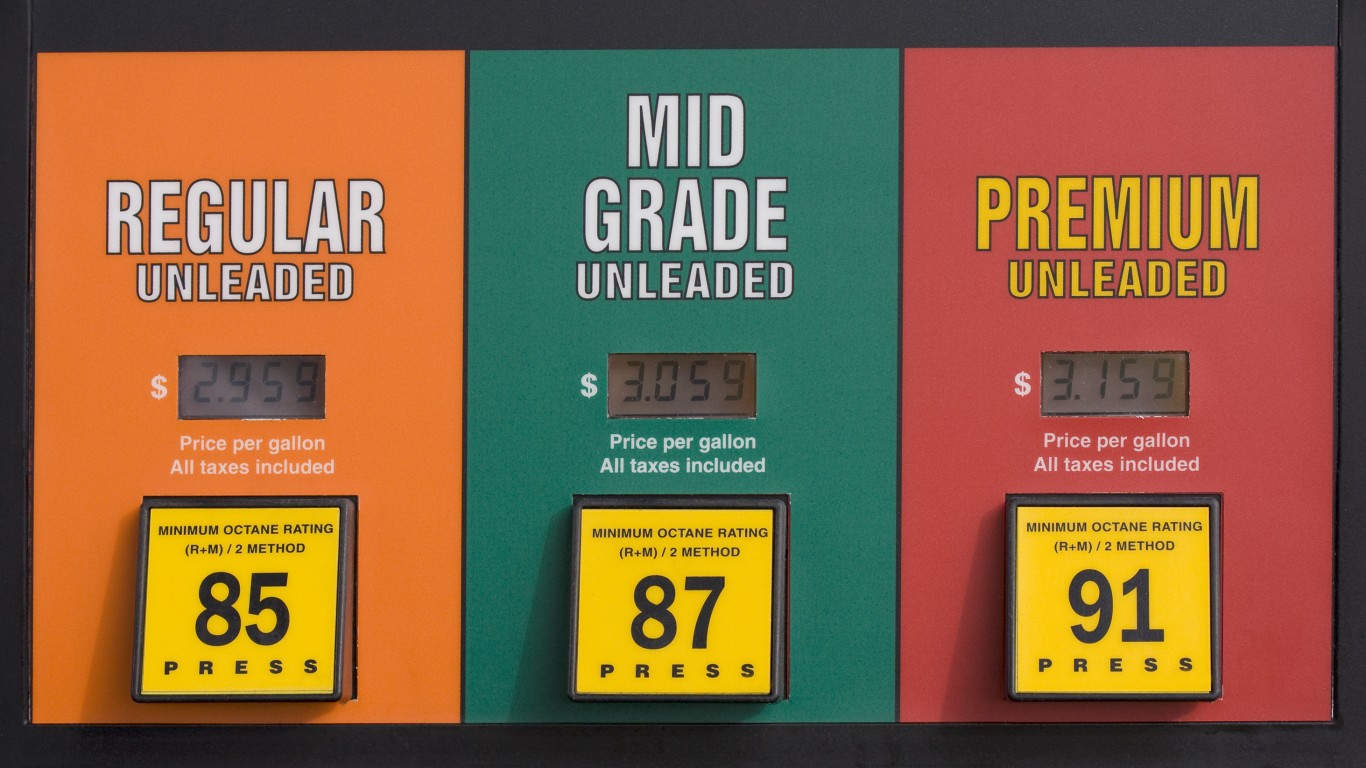
According to AAA, the current national average pump price per gallon of regular gasoline is $2.336, down a fraction of a cent from $2.337 a week ago and down more than seven cents per gallon compared with the month-ago price. Last year at this time, a gallon of regular gasoline cost $2.226 on average in the United States.
Here is a look at how share prices for two blue-chip stocks and two exchange traded funds reacted to this latest report.
Exxon Mobil Corp. (NYSE: XOM) traded down about 0.2%, at $82.41 in a 52-week range of $80.30 to $95.55. Over the past 12 months, Exxon stock has traded down about 7.8% and is down about 20% since August 2014, as of Tuesday’s close.
Chevron Corp. (NYSE: CVX) traded down about 1.7%, at $105.37 in a 52-week range of $97.53 to $119.00. As of last night’s close, Chevron shares have added about 6.5% over the past 12 months and trade down about 20% since August 2014.
The United States Oil ETF (NYSEMKT: USO) traded up about 1.6%, at $10.27 in a 52-week range of $9.23 to $12.45.
The VanEck Vectors Oil Services ETF (NYSEMKT: OIH) traded down about 1%, at $27.30 in a 52-week range of $26.10 to $36.35.
Take Charge of Your Retirement: Find the Right Financial Advisor For You in Minutes (Sponsor)
Retirement planning doesn’t have to feel overwhelming. The key is finding professional guidance—and we’ve made it easier than ever for you to connect with the right financial advisor for your unique needs.
Here’s how it works:
1️ Answer a Few Simple Questions
Tell us a bit about your goals and preferences—it only takes a few minutes!
2️ Get Your Top Advisor Matches
This tool matches you with qualified advisors who specialize in helping people like you achieve financial success.
3️ Choose Your Best Fit
Review their profiles, schedule an introductory meeting, and select the advisor who feels right for you.
Why wait? Start building the retirement you’ve always dreamed of. Click here to get started today!
Thank you for reading! Have some feedback for us?
Contact the 24/7 Wall St. editorial team.


