In 1980, the first year for which the U.S. Energy Information Administration (EIA) has data, 284.7 billion kilowatt-hours (kWh) were generated from renewable sources, and 279.2 billion kWh of those came from hydropower. Solar and wind power generated exactly zero kWh of electricity in 1980. By 2012, total renewable power generation in the United States reached 508.4 billion kWh, of which hydropower accounted for 276.2 billion kWh while wind accounted for 140.8 billion kWh and solar, tidal and wave generation accounted for 4.3 billion kWh.
Overall total generation in the country has risen by about 58% since 1980, while renewable generation has risen by 79%.
ALSO READ: The 10 Best Green Cars of 2015
In the five-year period to 2012, overall revenues in the electric power generation industry fell 1.2% from $121 billion to $119. 5 billion. According to the Census Bureau, the decline was driven by the fossil fuel electric power generation industry, in which revenues declined 6.7% from $85.4 billion to $79.7 billion.
Renewable sources account for a still-small 8.2% of all revenues generated by the electric power generation industry, compared with 25.1% of generation from nuclear power and 66.7% from fossil fuel sources, which would most likely be either coal or natural gas.
The Census Bureau data reflects only utility-scale generation and does not include individual rooftop installations, whether residential or commercial.
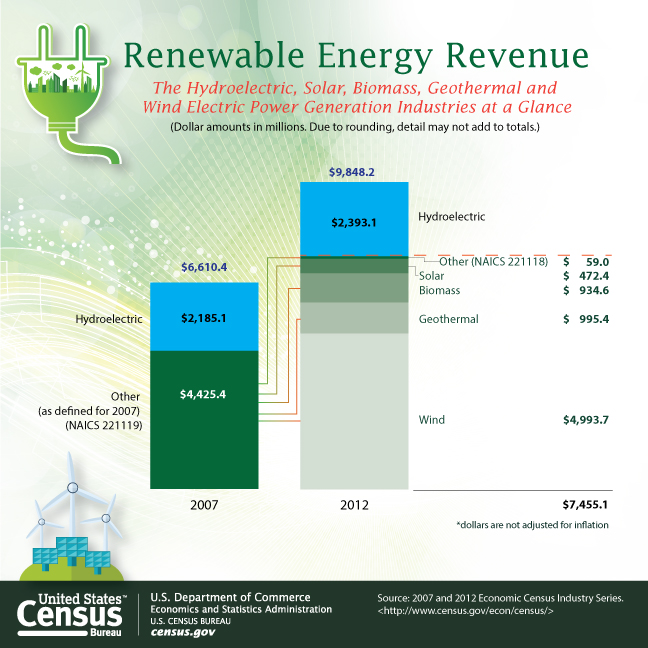
The big changes in the renewable generation industry are quickly apparent in the chart below. In 2007 the Census Bureau lumped all renewable sources except hydropower into an “other” category, which generated revenues totaling $4.43 billion. Just five years later wind power generation alone produced revenues of $4.99 billion.
Hydropower-generated electricity was responsible for $2.19 billion in 2007 revenues and $2.39 billion in 2012, an increase of just 9%. Hydropower still accounts for nearly a quarter of renewable electricity generation, but that is far below the more than 90% of several years ago and well below the 33% of 2007.
The number of non-fossil fuel, non-nuclear utility-scale power generation “establishments” (defined by the Census Bureau as a single physical location of a business that produces or distributes goods or performs a service) grew from 312 in 2007 to 697 in 2012. The annual payroll for workers employed in non-fossil fuel and non-nuclear power generation utilities rose from about $511 million for 5,875 employees to more than $915 million for 10,220 employees.
ALSO READ: Solar Installations in China Could Drive These 4 Solar Stocks Much Higher