This post may contain links from our sponsors and affiliates, and Flywheel Publishing may receive
compensation for actions taken through them.
The U.S. Energy Information Administration (EIA) released its weekly petroleum status report Wednesday morning. U.S. commercial crude inventories increased by a whopping 10.4 million barrels last week, maintaining a total U.S. commercial crude inventory of 518 million barrels. The commercial crude inventory stands at historically high levels for this time of year, according to the EIA.
Tuesday evening the American Petroleum Institute (API) reported that crude inventories rose by 9.9 million barrels in the week ending February 26. For the same period, analysts had estimated an increase of 2.6 million barrels in crude inventories.
Total gasoline inventories decreased by 1.5 million barrels last week, according to the EIA, but remain well above the upper limit of the five-year average range. Total motor gasoline supplied (the agency’s measure of consumption) averaged about 9.3 million barrels a day for the past four weeks, up by 6.9% compared with the same period a year ago.
Crude oil gained about $3 a barrel over the past week as a result of continuing discussions among many producing nations for a production cap. A week or two ago, the cap was called a freeze and generated an equal amount of enthusiasm until people started counting barrels.
Russia, which appears to be leading this latest round of talks, produced a record amount of oil in January, the month being proposed as the benchmark for the cap. That’s better than allowing all producing nations to just continue increasing output, but there is at least one holdout that could snarl any agreement.
Iran has said it will not join the cap movement. The country, just coming off several years of being unable to sell to most world markets, has stated plans to raise production to around 4 million barrels a day. Iraq, desperately in need of hard cash, is also unlikely to agree to a cap.
And as we noted already Wednesday morning, just capping production will not return the demand-supply balance until the end of 2017. It will take years longer to flush the current glut of crude oil through the markets.
Before the EIA report, benchmark West Texas Intermediate (WTI) crude for April delivery traded down about 0.4% at around $34.25 a barrel. WTI settled at $34.40 on Tuesday and tumbled to around $33.90 shortly after the report’s release. The 52-week range on WTI April futures is $28.74 to $65.71.
Distillate inventories increased by 2.9 million barrels last week but remain above the upper limit of the average range for this time of year. Distillate product supplied averaged over 3.4 million barrels a day over the past four weeks, down by 18.8% when compared with the same period last year. Distillate production averaged over 4.8 million barrels a day last week, up by about 400,000 barrels a day from the prior week.
For the past week, crude imports averaged 8.3 million barrels a day, up by 490,000 barrels a day compared with the previous week. Refineries were running at 88.3% of capacity, with daily input of averaging about 15.9 million barrels, about 167,000 barrels a day above the previous week’s average.
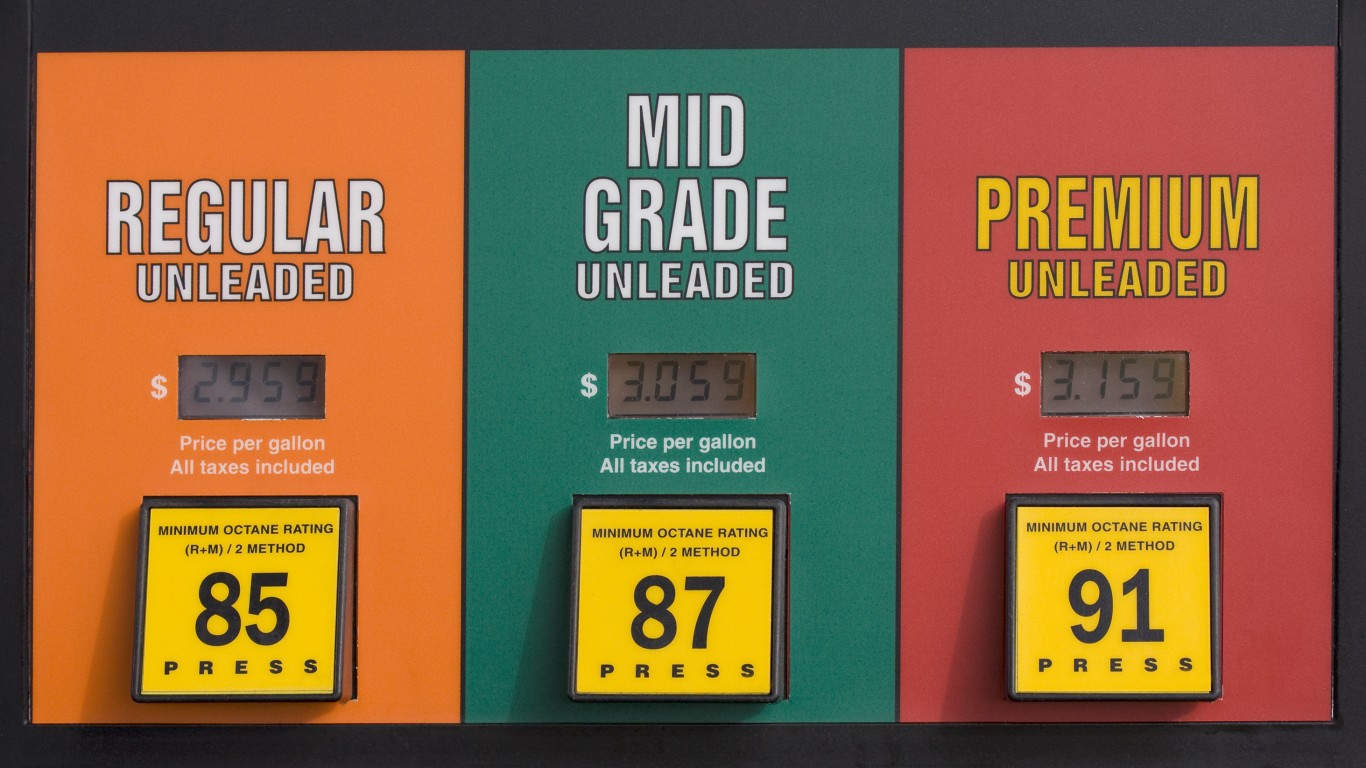
According to AAA, the current national average pump price per gallon of regular gasoline is $1.785, up 4.4% from $1.709 a week ago and down from $1.79 a month ago. Last year at this time, a gallon of regular gasoline cost $2.427 on average in the United States.
Here is a look at how share prices for two blue-chip stocks and two exchange traded funds reacted to this latest report.
Exxon Mobil Corp. (NYSE: XOM) traded down about 0.6%, at $80.83 in a 52-week range of $66.55 to $90.09. Over the past 12 months, Exxon stock traded down about 8.2% and is down about 21.2% since August 2014, as of Tuesday’s close.
Chevron Corp. (NYSE: CVX) traded down about 1.9%, at $84.52 in a 52-week range of $69.58 to $112.20. As of Tuesday’s close, Chevron shares have dropped about 20% over the past 12 months and trade down about 34.5% since August 2014.
The United States Oil ETF (NYSEMKT: USO) traded down about 2.1%, at $8.97 in a 52-week range of $7.67 to $21.50.
The Market Vectors Oil Services ETF (NYSEMKT: OIH) traded down about 1.4% to $24.23, in a 52-week range of $20.46 to $39.80.
Take This Retirement Quiz To Get Matched With An Advisor Now (Sponsored)
Are you ready for retirement? Planning for retirement can be overwhelming, that’s why it could be a good idea to speak to a fiduciary financial advisor about your goals today.
Start by taking this retirement quiz right here from SmartAsset that will match you with up to 3 financial advisors that serve your area and beyond in 5 minutes. Smart Asset is now matching over 50,000 people a month.
Click here now to get started.
Thank you for reading! Have some feedback for us?
Contact the 24/7 Wall St. editorial team.


