The U.S. Energy Information Administration (EIA) released its weekly petroleum status report Wednesday morning. U.S. commercial crude inventories increased by 1.4 million barrels last week, maintaining a total U.S. commercial crude inventory of 541.3 million barrels. The commercial crude inventory remains at historically high levels for this time of year according to the EIA.
Tuesday evening the American Petroleum Institute (API) reported that crude inventories fell by 1.1 million barrels in the week ending May 13. API also reported gasoline supplies rose by 300,000 barrels and distillate stockpiles fell by 1.4 million barrels. For the same period, analysts had estimated a decrease of around 2.4 million barrels in crude inventories, along with a decline of 600,000 barrels in gasoline supplies and an 800,000-barrel decline in distillates.
Total gasoline inventories decreased by 2.5 million barrels last week, according to the EIA, but remain well above the upper limit of the five-year average range. Total motor gasoline supplied (the agency’s measure of consumption) averaged 9.6 million barrels a day for the past four weeks, up by 5.7% compared with the same period a year ago.
Crude oil continues trading near six-month highs on supply disruptions from Nigeria, Libya and Canada, where an out-of-control wildfire has burned an area larger than the size of Rhode Island and has extended the closure of oil sands production. Analysts at Goldman Sachs have also claimed that crude supply has fallen below demand and that the glut is now behind us.
Hedge funds had likewise placed heavy bets on rising crude prices. In the first four months of the year, the hedgies have raised the long positions by 133 million barrels and cut their short positions by 208 million barrels, according to a report at Reuters. Those positions have changed somewhat in the past two weeks, though, as hedge funds have cut their net long positions by nearly 90 million barrels.
With crude prices approaching $50 a barrel, most of the anticipated increase for all of 2016 and even into 2017 has already been put on the board, and gauging the direction of oil markets in the near term becomes more uncertain. Has the rebalancing of the market really begun? Will demand hold up or even increase? When will prices reach a level that brings idled U.S. producers back into play?
Before the EIA report, benchmark West Texas Intermediate (WTI) crude for June delivery traded up about 0.1% at around $48.63 a barrel, and it slipped to around $48.35 shortly after the report’s release. WTI crude settled at $48.31 on Tuesday. The 52-week range on June futures is $30.79 to $64.00.
Distillate inventories decreased by 3.2 million barrels last week but also remain well above the upper limit of the average range for this time of year. Distillate product supplied averaged 4.1 million barrels a day over the past four weeks, down by 0.9% when compared with the same period last year. Distillate production averaged about 4.8 million barrels a day last week, up about 200,000 barrels a day from the prior week.
For the past week, crude imports averaged 7.7 million barrels a day, up about 22,000 barrels a day compared with the previous week. Refineries were running at 90.5% of capacity, with daily input averaging 16.4 million barrels, about 192,000 barrels a day more than the previous week’s average.
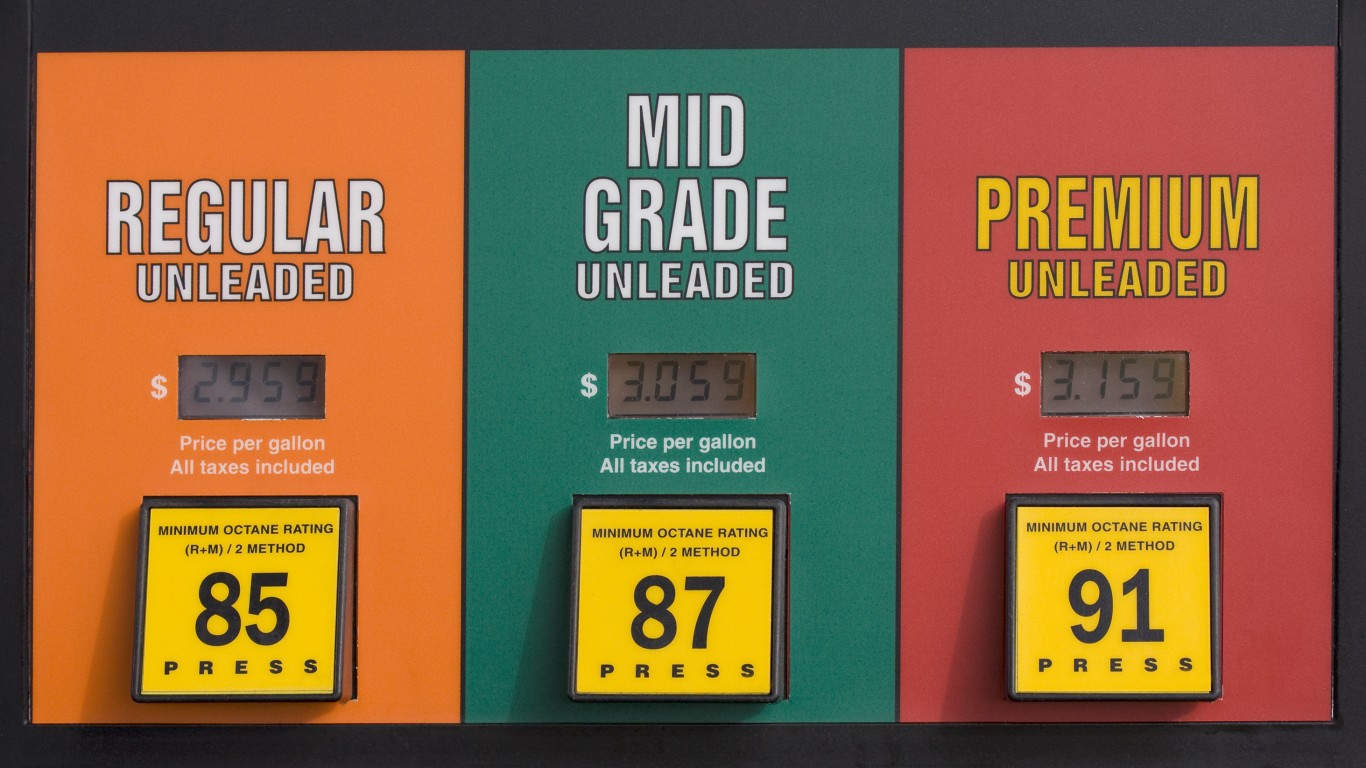
According to AAA, the current national average pump price per gallon of regular gasoline is $2.24, up from $2.20 a week ago and up about 13 cents compared with the month-ago price. Last year at this time, a gallon of regular gasoline cost $2.705 on average in the United States.
Here is a look at how share prices for two blue-chip stocks and two exchange traded funds reacted to this latest report.
Exxon Mobil Corp. (NYSE: XOM) traded up about 0.1%, at $89.55 in a 52-week range of $66.55 to $90.00. Over the past 12 months, Exxon stock has traded up about 3.1%, and it is down about 13.2% since August 2014, as of Tuesday’s close.
Chevron Corp. (NYSE: CVX) traded down about 0.5%, at $100.30 in a 52-week range of $69.58 to $106.27. As of Tuesday’s close, Chevron shares have dropped about 5.5% over the past 12 months and trade down about 24.6% since August 2014.
The United States Oil ETF (NYSEMKT: USO) traded down about 0.3%, at $11.89 in a 52-week range of $7.67 to $20.80.
The Market Vectors Oil Services ETF (NYSEMKT: OIH) traded down about 1% at $27.53, in a 52-week range of $20.46 to $38.24.
Travel Cards Are Getting Too Good To Ignore (sponsored)
Credit card companies are pulling out all the stops, with the issuers are offering insane travel rewards and perks.
We’re talking huge sign-up bonuses, points on every purchase, and benefits like lounge access, travel credits, and free hotel nights. For travelers, these rewards can add up to thousands of dollars in flights, upgrades, and luxury experiences every year.
It’s like getting paid to travel — and it’s available to qualified borrowers who know where to look.
We’ve rounded up some of the best travel credit cards on the market. Click here to see the list. Don’t miss these offers — they won’t be this good forever.
Thank you for reading! Have some feedback for us?
Contact the 24/7 Wall St. editorial team.
 24/7 Wall St.


