The U.S. Energy Information Administration (EIA) released its weekly petroleum status report Wednesday morning. U.S. commercial crude inventories decreased by 600,000 barrels last week, maintaining a total U.S. commercial crude inventory of 510.8 million barrels. The commercial crude inventory remains at historically high levels for this time of year, according to the EIA.
Tuesday evening, the American Petroleum Institute (API) reported that crude inventories rose by 1.4 million barrels in the week ending September 9. API also reported gasoline supplies decreased by 2.4 million barrels and distillate inventories saw an increase of 5.3 million barrels. For the same period, analysts had estimated an increase of 4 million barrels in crude inventories and a drop of 1.1 million barrels in gasoline supplies.
Total gasoline inventories rose by 600,000 barrels last week, according to the EIA, and remain well above the upper limit of the five-year average range. Total motor gasoline supplied (the agency’s measure of consumption) averaged over 9.5 million barrels a day for the past four weeks, up by 4.2% compared with the same period a year ago.
Last week’s massive drawdown in crude oil stockpiles was due primarily to shut-ins due to Hurricane Hermine, which also disrupted imports to the Gulf Coast. Once the storm passed, wells in the Gulf of Mexico came back online and tankers that had been waiting to reach port were able to complete their journeys.
On Tuesday, the International Energy Agency (IEA) revised its demand forecast saying that current oversupply conditions will remain until well into next year. That forecast is also in line with a projection Monday from OPEC.
Combined with an increase in last week’s rig count (again, primarily the result of Gulf wells returning to production), the price of crude has been volatile, but mostly trending down.
U.S. exports of crude oil, since the ban on exports was lifted in December, reached 662,000 barrels a day, according to the EIA, and contrary to warnings that increased exports would raise pump prices in the United States, the opposite appears to be the case, at least so far. In its most recent revision to the Short-Term Energy Outlook, the EIA’s chief said:
U.S. retail gasoline prices are expected to continue falling through the end of 2016, even though gasoline demand this year is expected to be the highest ever. … The average pump price for December is on track to be the lowest for the month in eight years. … Gasoline retail prices are down this year because of a combination of modest crude oil prices and abundant supplies of gasoline from high levels of refinery production.
Before the EIA report, benchmark West Texas Intermediate (WTI) crude for October delivery traded down about 1.2% at around $44.40 a barrel, and it rose to around $44.80 shortly after the report’s release. WTI crude settled at $44.90 on Tuesday. The 52-week range on October futures is $33.28 to $54.34.
Distillate inventories increased by 4.6 million barrels last week and remain above the upper limit of the average range for this time of year. Distillate product supplied averaged over 3.6 million barrels a day over the past four weeks, up by 1.3% compared with the same period last year. Distillate production averaged over 4.9 million barrels a day last week, down by about 100,000 barrels compared with the prior week’s production.
For the past week, crude imports averaged about 8.1 million barrels a day, up by 993,000 barrels a day compared with the previous week. Refineries were running at 92.9% of capacity, with daily input averaging over 16.7 million barrels, about 200,000 barrels a day less than the previous week’s average.
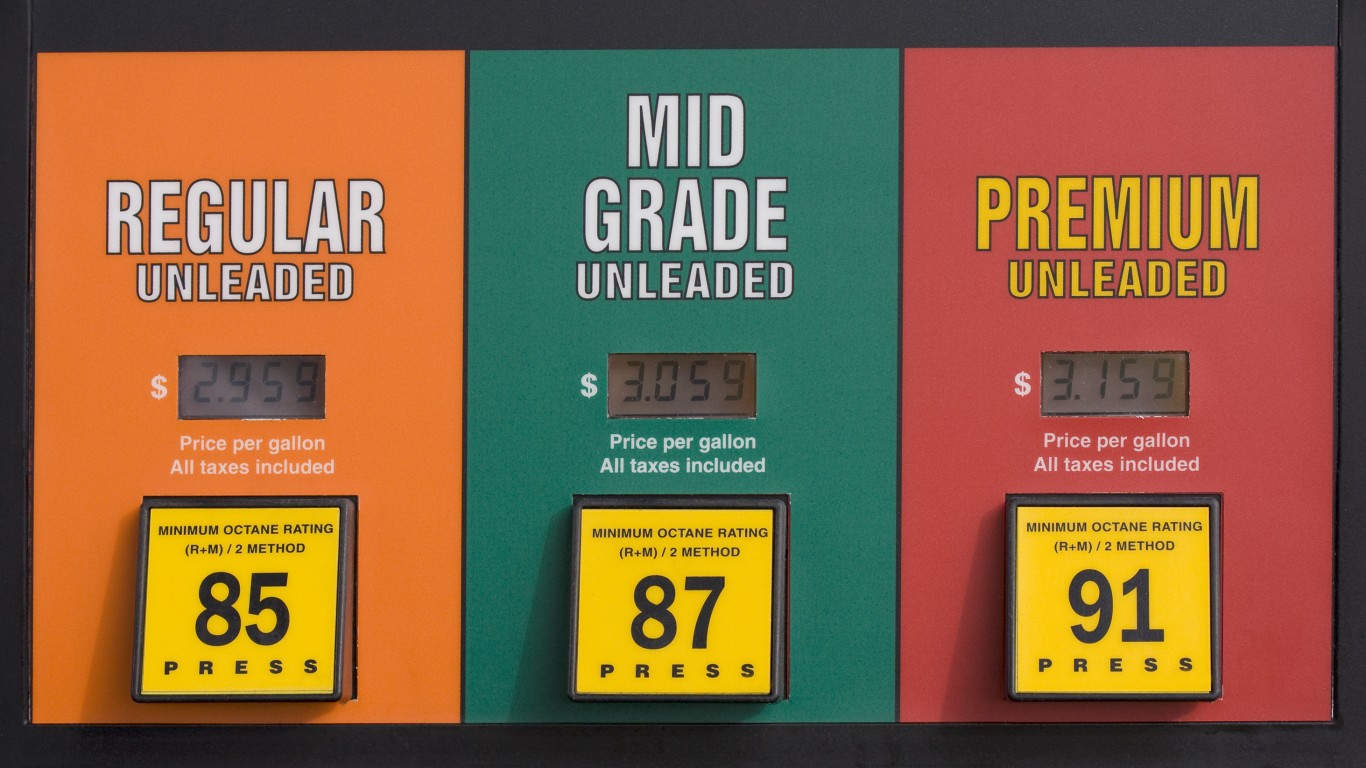
According to AAA, the current national average pump price per gallon of regular gasoline is $2.18, down from $2.192 a week ago and up more than five cents compared with the month-ago price. Last year at this time, a gallon of regular gasoline cost $2.334 on average in the United States.
Here is a look at how share prices for two blue-chip stocks and two exchange traded funds reacted to this latest report.
Exxon Mobil Corp. (NYSE: XOM) traded up about 0.6%, at $85.72 in a 52-week range of $71.55 to $95.55. Over the past 12 months, Exxon stock has traded up nearly 18% and is down more than 17% since August 2014, as of Tuesday’s close.
Chevron Corp. (NYSE: CVX) traded up 0.5%, at $99.91 in a 52-week range of $75.10 to $107.58. As of the most recent close, Chevron shares have added more than 31% over the past 12 months and trade down more than 25% since August 2014.
The United States Oil ETF (NYSEMKT: USO) traded down around 0.8%, at $10.29 in a 52-week range of $7.67 to $16.20.
The VanEck Vectors Oil Services ETF (NYSEMKT: OIH) traded down about 0.2% to $26.81, in a 52-week range of $20.46 to $32.78.
Are You Ahead, or Behind on Retirement? (sponsor)
If you’re one of the over 4 Million Americans set to retire this year, you may want to pay attention.
Finding a financial advisor who puts your interest first can be the difference between a rich retirement and barely getting by, and today it’s easier than ever. SmartAsset’s free tool matches you with up to three fiduciary financial advisors that serve your area in minutes. Each advisor has been carefully vetted, and must act in your best interests. Start your search now.
Don’t waste another minute; get started right here and help your retirement dreams become a retirement reality.
Thank you for reading! Have some feedback for us?
Contact the 24/7 Wall St. editorial team.


