The U.S. Energy Information Administration (EIA) released its weekly petroleum status report Wednesday morning. U.S. commercial crude inventories decreased by 2.6 million barrels last week, maintaining a total U.S. commercial crude inventory of 483.2 million barrels. The commercial crude inventory is now near the upper limit of the average range for this time of year.
Tuesday evening the American Petroleum Institute (API) reported that crude inventories rose by 4.7 million barrels in the week ending December 9. API also reported gasoline supplies increased by 3.9 million barrels and distillate inventories rose by 230,000 barrels. For the same period, analysts had estimated a decrease of 1.7 million barrels in crude inventories.
Total gasoline inventories increased by 500,000 barrels last week, according to the EIA, and are now near the upper limit of the five-year average range. Total motor gasoline supplied (the agency’s measure of consumption) averaged over 8.9 million barrels a day for the past four weeks, down 3% compared with the same period a year ago.
In its monthly report released on Tuesday, the International Energy Agency (IEA) said it believes the global market for crude could reach a point where demand outstrips supply as early as the first half of 2017. The IEA made that projection despite the fact that OPEC member nations pumped a record high 34.2 million barrels a day in October.
To reach the agreed 32.5 million barrels a day of production cuts the cartel agreed to last month, that means production from OPEC members will have to fall about 1.9 million barrels a day rather than the 1.2 million barrels specified in the agreement. That also means that Saudi Arabia, and maybe Kuwait, will have to suck it up and take one for the team.
In its monthly oil market report, OPEC revised its forecast for global oil markets in 2017. Non-OPEC supply is projected to fall by 780,000 barrels a day in 2016 led by lower production in the United States, China, Mexico, Columbia, and other OECD countries in Europe. For 2017, non-OPEC supply is forecast to rise by 300,000 barrels a day mainly due to higher price expectations.
In July the cartel had forecast that non-OPEC supply would fall by 110,000 barrels a day in 2017. OPEC does not expect U.S. production to increase next year.
2017 demand for OPEC crude is forecast at 32.6 million barrels a day, just 100,000 barrels above the agreed level of production following the cuts that take effect next month. OPEC forecasts a rebalancing of the crude market in the second half of the year.
Before the EIA report, benchmark West Texas Intermediate (WTI) crude for January delivery traded down about 1.8% at around $52.00 a barrel and rose to around $52.35 after the report’s release. WTI crude settled at $52.98 on Tuesday. The 52-week range on January futures is $34.55 to $54.51.
Distillate inventories decreased by 800,000 barrels last week and remain above the upper limit of the average range for this time of year. Distillate product supplied averaged over 3.9 million barrels a day over the past four weeks, up 11% compared with the same period last year. Distillate production averaged about 5 million barrels a day last week, down about 100,000 barrels compared with the prior week’s production.
For the past week, crude imports averaged over 7.4 million barrels a day, down by 934,000 barrels a day compared with the previous week. Refineries were running at 90.5% of capacity, with daily input averaging 16.5 million barrels, about 57,000 barrels a day more than the previous week’s average.
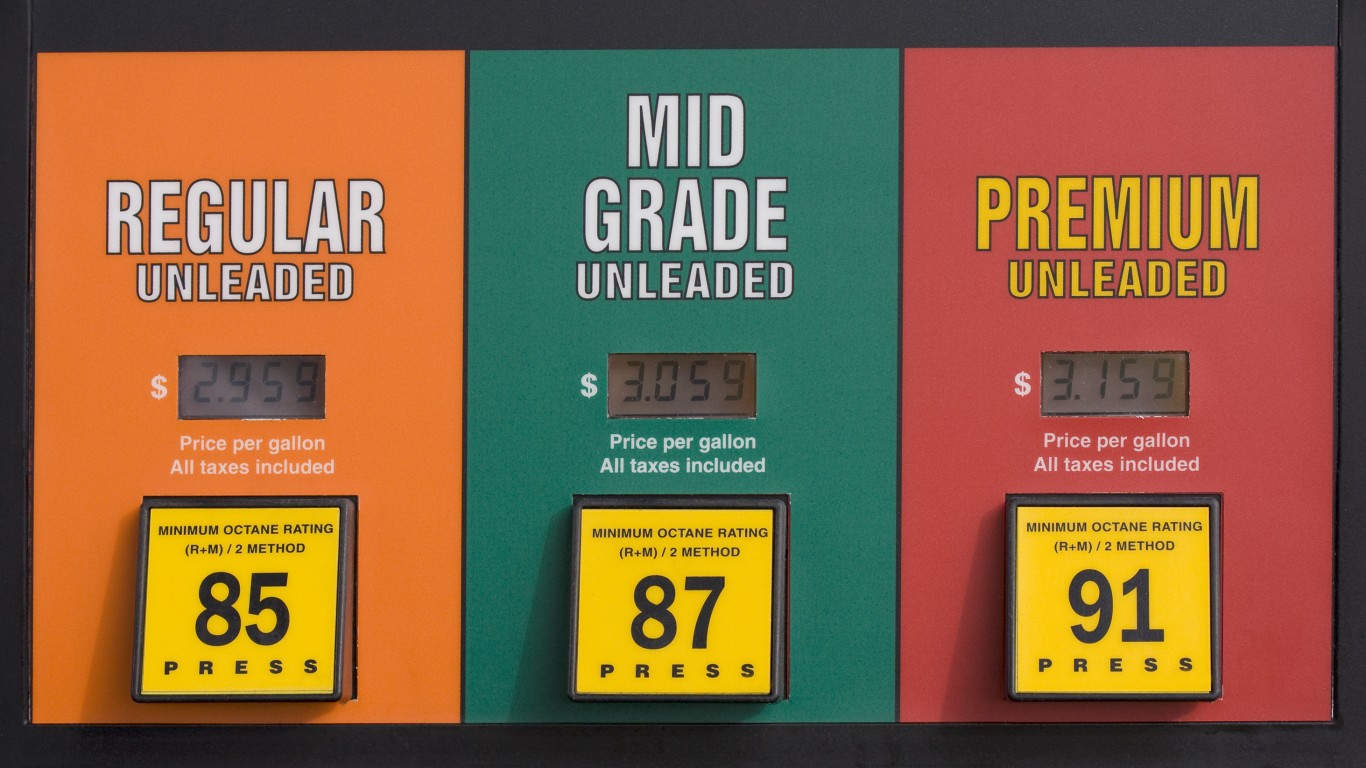
According to AAA, the current national average pump price per gallon of regular gasoline is $2.220, up from $2.192 a week ago and up more than five cents compared with the month-ago price. Last year at this time, a gallon of regular gasoline cost $2.014 on average in the United States.
Here is a look at how share prices for two blue-chip stocks and two exchange traded funds reacted to this latest report.
Exxon Mobil Corp. (NYSE: XOM) traded down about 1%, at $91.72 in a 52-week range of $71.55 to $95.55. Over the past 12 months, Exxon stock has traded up about 22% and is down about 10% since August 2014, as of Tuesday’s close.
Chevron Corp. (NYSE: CVX) traded up about 0.1%, at $117.49 in a 52-week range of $75.33 to $118.99. As of last night’s close, Chevron shares have added nearly 30% over the past 12 months and trade down about 8.6% since August 2014.
The United States Oil ETF (NYSEMKT: USO) traded down about 0.6%, at $11.66 in a 52-week range of $7.67 to $12.45.
The VanEck Vectors Oil Services ETF (NYSEMKT: OIH) traded down about 0.8% to $34.82, in a 52-week range of $20.46 to $36.35.
It’s Your Money, Your Future—Own It (sponsor)
Are you ahead, or behind on retirement? For families with more than $500,000 saved for retirement, finding a financial advisor who puts your interest first can be the difference, and today it’s easier than ever. SmartAsset’s free tool matches you with up to three fiduciary financial advisors who serve your area in minutes. Each advisor has been carefully vetted and must act in your best interests. Start your search now.
If you’ve saved and built a substantial nest egg for you and your family, don’t delay; get started right here and help your retirement dreams become a retirement reality.
Thank you for reading! Have some feedback for us?
Contact the 24/7 Wall St. editorial team.


