The U.S. Energy Information Administration (EIA) released its weekly petroleum status report Wednesday morning. U.S. commercial crude inventories decreased by 200,000 barrels last week, maintaining a total U.S. commercial crude inventory of 528.2 million barrels. The commercial crude inventory remained above the upper limit of the average range for this time of year.
Tuesday evening the American Petroleum Institute (API) reported that crude inventories fell by 530,000 barrels in the week ending March 10. API also reported gasoline supplies decreased by 3.9 million barrels and distillate inventories decreased by 4.1 million barrels. For the same period, analysts had estimated an increase of 3.2 million barrels in crude inventories, a decline of 2 million barrels in gasoline inventories and a drop of 1.5 million barrels in distillate stockpiles.
Total gasoline inventories decreased by 3.1 million barrels last week, according to the EIA, and remain above in the upper half of the five-year average range. Total motor gasoline supplied (the agency’s measure of consumption) averaged about 9 million barrels a day for the past four weeks, down by 4.5% compared with the same period a year ago.
In its monthly Oil Market Report released Wednesday morning, the International Energy Agency (IEA) projected that oil demand would rise by 1.4 million barrels a day in 2017, down from demand growth of 1.6 million barrels a day in 2016. The worse news is that production rose by 260,000 barrels a day in February. The even worse news is that global stockpiles rose back above 3 billion barrels last month.
None of that, however, seemed to weigh too heavily on traders who pushed prices higher early Wednesday, likely based on the API’s larger-than-expected drawdowns in crude oil, gasoline and distillates.
Other recent data points we have are OPEC’s monthly oil market report, released Tuesday, and the EIA’s monthly Drilling Productivity Report released Monday. These two reports combined to send crude prices down sharply on Tuesday because the former indicated that Saudi production rose month over month in February, and the latter indicated that production from seven major U.S. shale plays is expected to rise by 109,000 barrels a day in April.
What all this means is that rebalancing of the global oil markets is likely to take longer than the oil bulls have bet on, and we should see some dumping of long positions in this week’s report on oil market futures and options trading.
Before the EIA report, benchmark West Texas Intermediate (WTI) crude for April delivery traded up about 2% at around $48.70 a barrel and slipped to $48.61 shortly after the report’s release. WTI crude settled at $47.72 on Tuesday. The 52-week range on April futures is $40.97 to $56.92.
Distillate inventories fell by 4.2 million barrels last week but remain near the upper limit of the average range for this time of year. Distillate product supplied averaged about 4.2 million barrels a day over the past four weeks, up 5.6% compared with the same period last year. Distillate production averaged 4.7 million barrels a day last week, down about 100,000 barrels a day compared with the prior week’s production.
For the past week, crude imports averaged about 7.4 million barrels a day, down by about 745,000 barrels a day compared with the previous week. Refineries were running at 85.1% of capacity, with daily input averaging about 15.5 million barrels, about 20,000 barrels a day less than the previous week’s average.
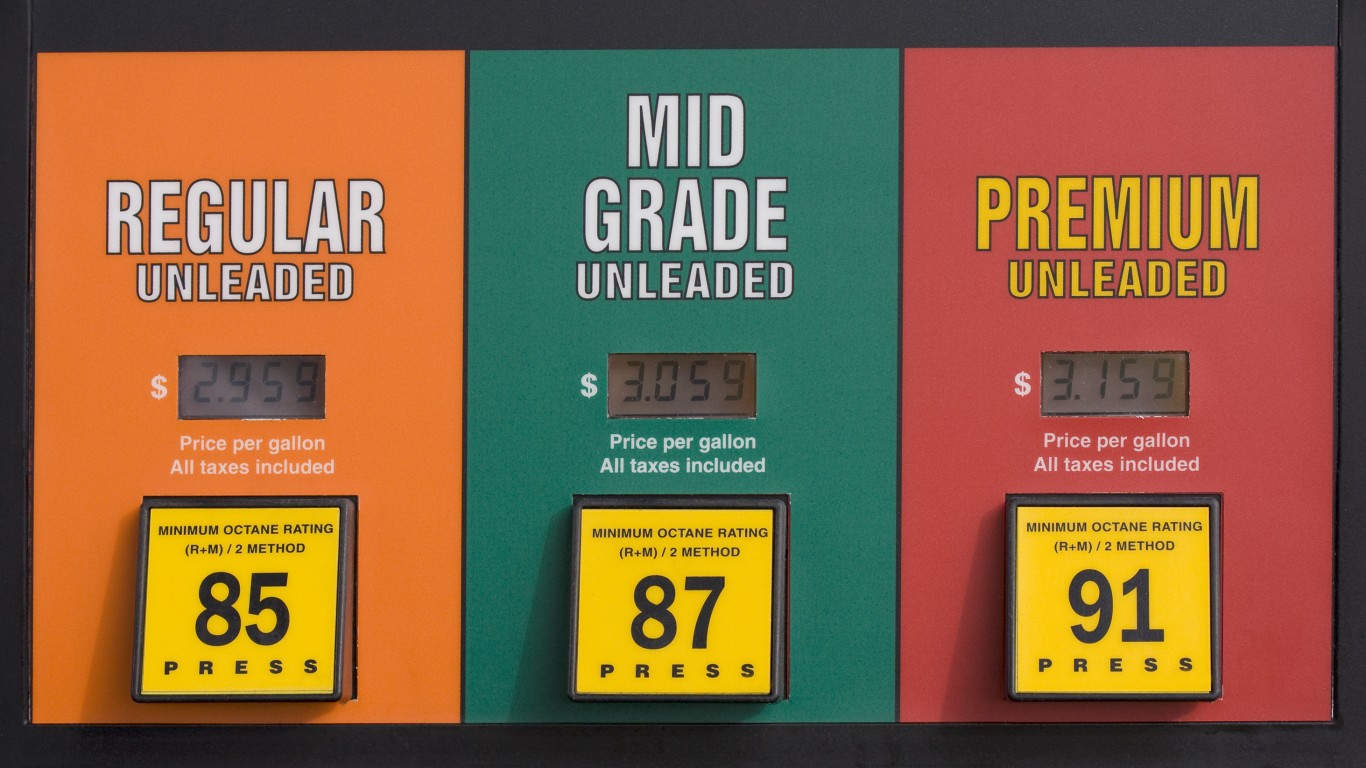
According to AAA, the current national average pump price per gallon of regular gasoline is $2.29, down from $2.306 a week ago and up less than a penny compared with the month-ago price. Last year at this time, a gallon of regular gasoline cost $1.945 on average in the United States.
Here is a look at how share prices for two blue-chip stocks and two exchange traded funds reacted to this latest report.
Exxon Mobil Corp. (NYSE: XOM) traded up about 0.6%, at $81.47 in a 52-week range of $80.31 to $95.55. Over the past 12 months, Exxon stock has traded down about 2.2% and is down about 21.5% since August 2014, as of Tuesday’s close.
Chevron Corp. (NYSE: CVX) traded up about 0.4%, at $107.74 in a 52-week range of $92.25 to $119.00. As of last night’s close, Chevron shares have added nearly 14% over the past 12 months and trade down more than 19.6% since August 2014.
The United States Oil ETF (NYSEMKT: USO) traded up about 1.1%, at $10.30 in a 52-week range of $8.99 to $12.45.
The VanEck Vectors Oil Services ETF (NYSEMKT: OIH) traded up about 2% to $30.57, in a 52-week range of $25.13 to $36.35.
It’s Your Money, Your Future—Own It (sponsor)
Retirement can be daunting, but it doesn’t need to be.
Imagine having an expert in your corner to help you with your financial goals. Someone to help you determine if you’re ahead, behind, or right on track. With SmartAsset, that’s not just a dream—it’s reality. This free tool connects you with pre-screened financial advisors who work in your best interests. It’s quick, it’s easy, so take the leap today and start planning smarter!
Don’t waste another minute; get started right here and help your retirement dreams become a retirement reality.
Thank you for reading! Have some feedback for us?
Contact the 24/7 Wall St. editorial team.


