The U.S. Energy Information Administration (EIA) released its weekly petroleum status report Thursday morning, showing that U.S. commercial crude inventories decreased by 2.8 million barrels last week, maintaining a total U.S. commercial crude inventory of 462.2 million barrels. The commercial crude inventory remained near the upper limit of the average range for this time of year.
Wednesday evening the American Petroleum Institute (API) reported that crude inventories rose by 3.1 million barrels in the week ending October 6. API also reported gasoline supplies fell by 1.6 million barrels and distillate inventories rose by 2.04 million barrels. For the same period, analysts surveyed by S&P Global Platts had consensus estimates for a decrease of 400,000 barrels in crude inventories, a decrease of 1.4 million barrels in gasoline inventories, and a drop of 1.64 million barrels in distillate stockpiles.
Total gasoline inventories rose by 2.5 million barrels last week, according to the EIA, and remain in the upper half of the five-year average range. U.S. refineries produced over 10 million barrels of gasoline a day last week, up about 100,000 barrels a day compared to the prior week. Total motor gasoline supplied (the agency’s proxy for demand) averaged over 9.4 million barrels a day for the past four weeks, down by about 100,000 barrels a day compared with the prior week.
S&P Global Platts Oil Futures Editor Geoffrey Craig underscored what’s happening with U.S. crude oil exports, beginning with the unusual decline of 6 million barrels in crude stockpiles in the week ending September 29:
This divergence away from seasonal norms was initially driven by Hurricane Harvey, which made landfall on the U.S. Gulf Coast (USGC) in late August. But the storm has had a lasting influence on trade flows and refinery operations.
Crude exports offer the most telling example. After initially dipping with Gulf Coast export ports shuttered, the amount of crude shipped overseas has since exploded, setting marks for all-time highs in consecutive weeks.
This massive outflow of U.S. crude isn’t surprising in light of the shifting economics that has provided a strong incentive for exports.
The ICE Brent/West Texas Intermediate (WTI) price spread blew out in September reaching nearly $7/b at the end of the month, its widest level since August 2015 a few months before the legal restrictions were lifted on exports.
That spread has fallen to $5/b-$6/b since the start of October, but remains well above the $3/b level that had represented the upper end of the range since January 2016.
The forces of arbitrage should eventually cause the Brent/WTI spread to narrow further, but until then exports will likely remain elevated based on U.S. crude’s competitiveness with rival grades.
Before the EIA report, benchmark West Texas Intermediate (WTI) crude for November delivery traded down about 2% at around $50.25 a barrel, and it traded at $50.44 shortly after the report’s release. WTI settled at $51.30 on Wednesday and opened at $51.00 Thursday morning. The 52-week range on November futures is $42.84 to $58.37.
Distillate inventories decreased by 1.5 million barrels last week and remain in the lower half of the average range for this time of year. Distillate product supplied averaged over 3.9 million barrels a day over the past four weeks, up by 2.1% compared with the same period last year. Distillate production averaged over 4.9 million barrels a day last week, flat compared to the prior week’s production.
For the past week, crude imports averaged over 7.6 million barrels a day, up by about 403,000 barrels a day compared with the previous week. Refineries were running at 89.2% of capacity, with daily input averaging over 16.2 million barrels a day, about 229,000 barrels a day more than the previous week’s average. Analysts were looking for a utilization drop to 87.7%.
Week over week, U.S. crude oil exports dropped by 714,000 barrels a day last week and U.S. production fell by 81,000 barrels a day.
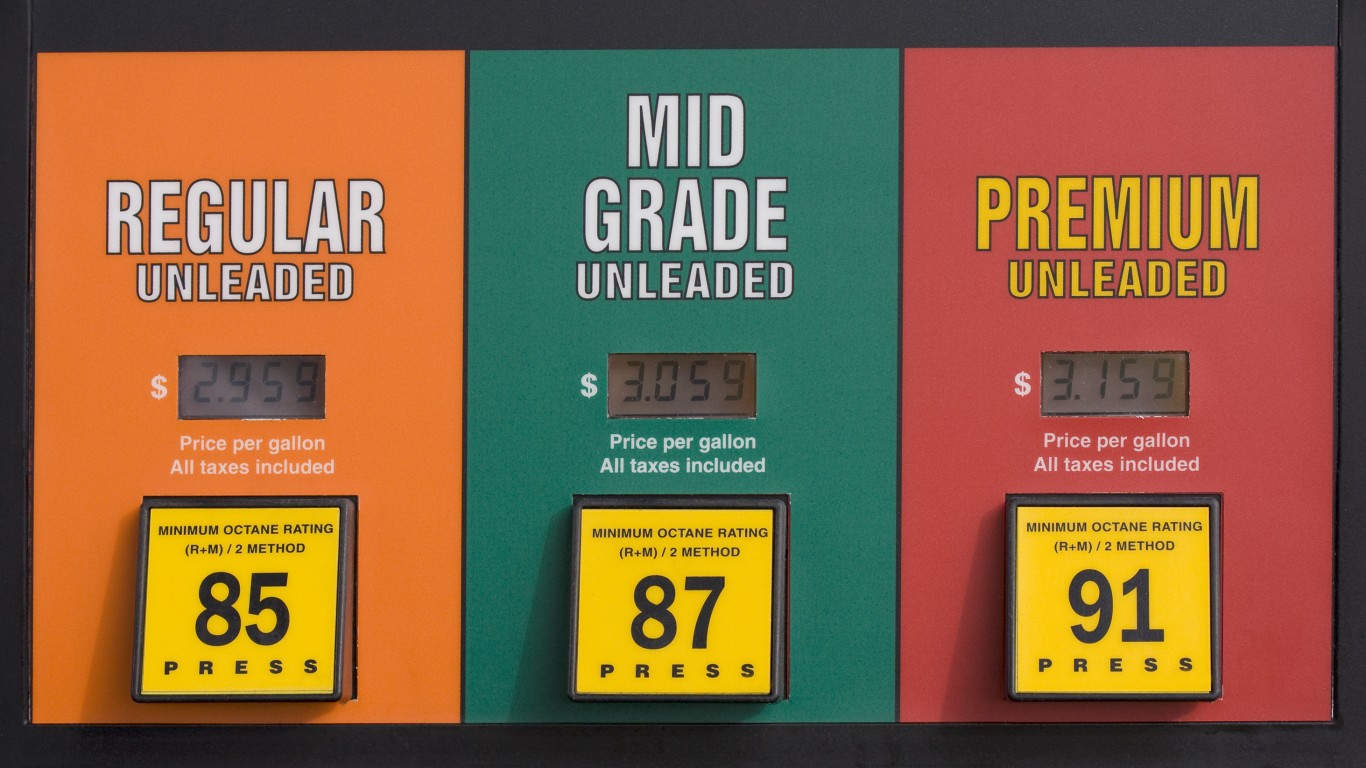
According to AAA, the current national average pump price per gallon of regular gasoline is $2.478, down 3.5 cents from $2.523 a week ago and up about 18 cents per gallon compared with the month-ago price. Last year at this time, a gallon of regular gasoline cost $2.254 on average in the United States.
Here is a look at how share prices for two blue-chip stocks and two exchange traded funds reacted to this latest report.
Exxon Mobil Corp. (NYSE: XOM) traded down about 0.3%, at $82.36 in a 52-week range of $76.05 to $93.22. Over the past 12 months, Exxon stock has traded down about 5.6%.
Chevron Corp. (NYSE: CVX) traded down about 0.1%, at $119.18 in a 52-week range of $99.61 to $119.82. As of last night’s close, Chevron shares are trading up about 16.3% over the past 12 months.
The United States Oil ETF (NYSEMKT: USO) traded down about 1.5%, at $10.20 in a 52-week range of $8.65 to $12.00.
The VanEck Vectors Oil Services ETF (NYSEMKT: OIH) traded down about 3.1%, at $25.03 in a 52-week range of $21.70 to $36.35.
Are You Ahead, or Behind on Retirement?
If you’re one of the over 4 Million Americans set to retire this year, you may want to pay attention. Many people have worked their whole lives preparing to retire without ever knowing the answer to the most important question: am I ahead, or behind on my goals?
Don’t make the same mistake. It’s an easy question to answer. A quick conversation with a financial advisor can help you unpack your savings, spending, and goals for your money. With Zoe Financial’s free matching tool, you can connect with trusted financial advisors in minutes.
Why wait? Click here to get started today!
Thank you for reading! Have some feedback for us?
Contact the 24/7 Wall St. editorial team.
 24/7 Wall St.


