
24/7 Wall St. Insights
- To mitigate the effects of climate change, the Biden Administration is aiming to make the U.S. power grid emissions-free by 2035.
- However, state governments have broad discretion over their energy policy, while some are prioritizing emissions reduction, others remain heavily dependent on fossil fuels.
- Currently, Illinois stands out as a leader in clean energy production, but still remains a heavy polluter.
- Also: 2 Dividend Legends to Hold Forever
One of the largest and most developed countries in the world, the United States is also one of the worst polluters globally. Each year, the U.S. generates more harmful greenhouse gasses than every other country, except China. According to the Environmental Protection Agency, America’s total greenhouse gas emissions topped 6.3 billion metric tons in 2022 — about 25% of which was attributable to electricity production.
With climate change ranking as a leading global threat, many countries are taking action to reduce emissions. In the United States, President Joe Biden set a goal of achieving a 100% emissions-free power grid by 2035 — largely by cutting U.S. dependence on dirty power sources, like coal, and increasing our reliance on clean, renewable sources. (Here is a look at 11 American companies on the cutting edge of renewable technology.)
In the last 10 years alone, the amount of electricity produced in coal-fired power plants has fallen by over 57% in the United States, from 1.6 billion megawatt-hours in 2014 to 675.1 million megawatt-hours in 2023. Over the same period, electricity production from wind and solar farms nearly tripled, from 199.3 million megawatt-hours to 586.7 megawatt-hours. The shift has had a meaningful impact, as emissions from electric power generation have fallen by nearly 24% in the U.S. since 2014, according to the U.S. Energy Information Administration.
The federal government has a long way to go to achieve its ambitious energy goals, and doing so will require the cooperation of states. Every state has broad authority over its power grid — and policies are often a product of a given state’s unique climate, geography, and natural resource availability. Partially as a result, some states are doing far more to reduce the climate impact of their power grid than others. (Here is a look at the states where carbon emissions are skyrocketing.)
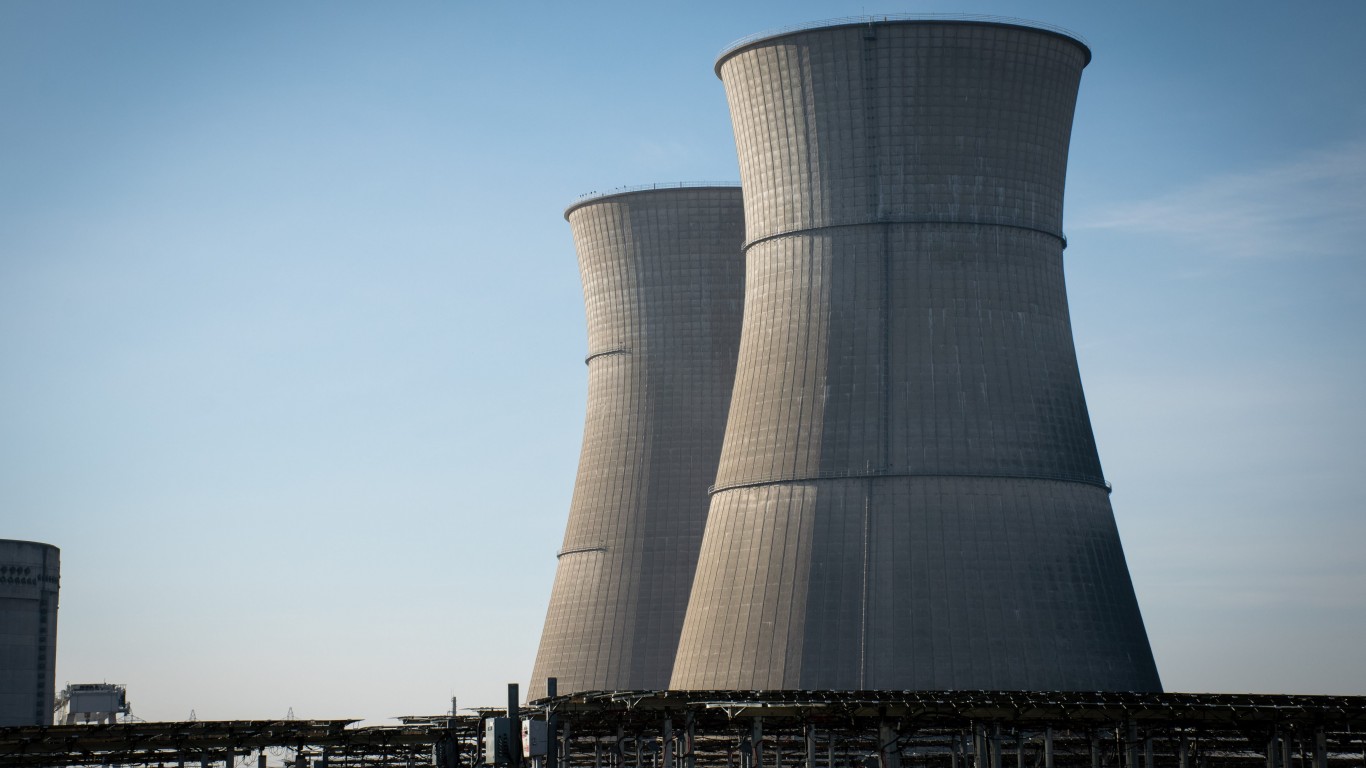
Among the 50 states, Illinois stands out for generating the most electricity with nuclear power plants. Unlike power plants that burn fossil fuels, nuclear plants do not generate harmful greenhouse gas emissions while operating. Nuclear plants also generate power more efficiently than fossil fuel plants or solar and wind farms, and can generate far more electricity in a smaller physical space. However, because of the presence of radioactive materials, each nuclear plant presents a risk of widespread air and water contamination, and therefore requires stringent building codes and highly skilled operators. Nuclear facilities also generate waste that can remain radioactive for thousands of years, necessitating highly regulated transportation and storage protocols for safe disposal.
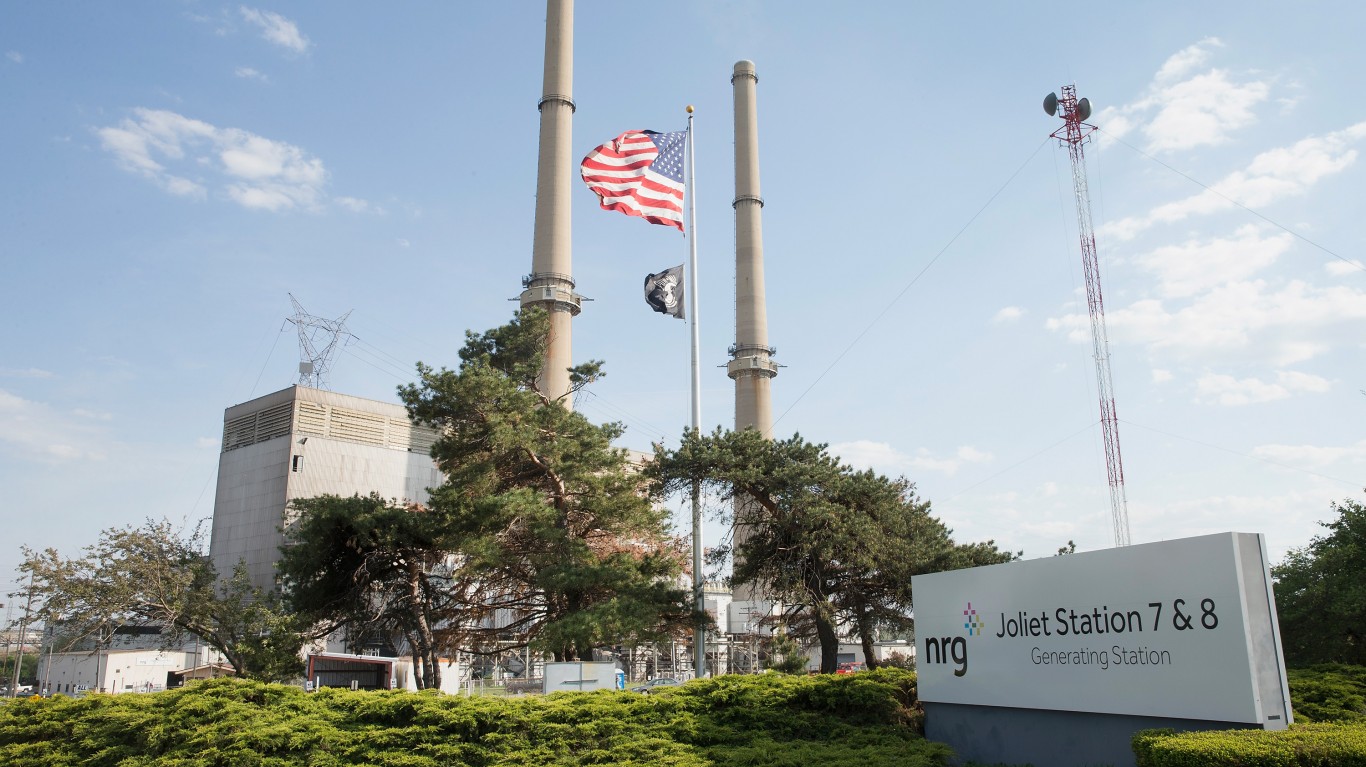
Home to multiple facilities, including the Braidwood, Byron, and Clinton Nuclear Power Plants, as well as the Dresden, La Salle, and Quad Cities Generating Stations, Illinois is a national leader in nuclear energy, producing 97.6 million megawatt-hours of electricity in 2023 alone — over half of the state’s total energy mix. Illinois is also heavily dependent on coal and natural gas, however, and partially as a result, it ranks among the 10 states with the heaviest polluting power grids.
This is how Illinois generates electricity — and how much pollution its power grid generates. Electricity output is measured in megawatt-hours and harmful gas emissions are measured in metric tons. For context, a single megawatt-hour is enough to power an average American home for just over a month, and a metric ton is equal to about 2,205 pounds. All data is from the EIA.
Why It Matters
Electricity production is one of the heaviest polluting sectors in the United States. As demand for electricity continues to rise, much of the country is transitioning away from fossil fuels and toward clean and renewable energy sources to meet the Biden Administration’s climate change mitigation goals. Illinois generates the bulk of its electric power from nuclear reactors, which do not emit harmful gasses. However, the state remains heavily dependent on fossil-fuel burning plants.
Coal

- Net-electricity production in 2023: 27.1 million megawatt-hours
- Coal as share of Illinois’ power grid: 15.28% of net-electricity production
- Harmful gas emissions from coal in 2022: 44.5 million metric-tons of nitric oxide, nitrogen dioxide, carbon dioxide, and sulfur dioxide
- Coal as share of harmful gas emissions from electricity production in Illinois: 82.62%
- Illinois’ coal infrastructure in 2023: 22 generators, 9 facilities
Hydroelectric

- Net-electricity production in 2023: 92,063 megawatt-hours
- Hydroelectric as share of Illinois’ power grid: 0.05% of net-electricity production
- Harmful gas emissions from hydroelectric in 2022: None
- Hydroelectric as share of harmful gas emissions from electricity production in Illinois: 0%
- Illinois’ hydroelectric infrastructure in 2023: 25 generators, 8 facilities
Natural gas

- Net-electricity production in 2023: 28.4 million megawatt-hours
- Natural gas as share of Illinois’ power grid: 16.00% of net-electricity production
- Harmful gas emissions from natural gas in 2022: 9.3 million metric-tons of nitric oxide, nitrogen dioxide, carbon dioxide, and sulfur dioxide
- Natural gas as share of harmful gas emissions from electricity production in Illinois: 17.31%
- Illinois’ natural gas infrastructure in 2023: 298 generators, 75 facilities
Nuclear

- Net-electricity production in 2023: 97.6 million megawatt-hours
- Nuclear energy as share of Illinois’ power grid: 54.89% of net-electricity production
- Harmful gas emissions from nuclear energy in 2022: None
- Nuclear energy as share of harmful gas emissions from electricity production in Illinois: 0%
- Illinois’ nuclear energy infrastructure in 2023: 11 generators, 6 facilities
Petroleum

- Net-electricity production in 2023: 26,288 megawatt-hours
- Petroleum as share of Illinois’ power grid: 0.01% of net-electricity production
- Harmful gas emissions from petroleum in 2022: 36,809 metric-tons of nitric oxide, nitrogen dioxide, carbon dioxide, and sulfur dioxide
- Petroleum as share of harmful gas emissions from electricity production in Illinois: 0.07%
- Illinois’ petroleum infrastructure in 2023: 176 generators, 37 facilities
Pumped storage

- Net-electricity production in 2023: None
- Pumped storage as share of Illinois’ power grid: 0% of net-electricity production
- Harmful gas emissions from pumped storage in 2022: None
- Pumped storage as share of harmful gas emissions from electricity production in Illinois: 0%
- Illinois’ pumped storage infrastructure in 2023: None
Solar (thermal and photovoltaic)

- Net-electricity production in 2023: 1.9 million megawatt-hours
- Solar as share of Illinois’ power grid: 1.08% of net-electricity production
- Harmful gas emissions from solar in 2022: None
- Solar as share of harmful gas emissions from electricity production in Illinois: 0%
- Illinois’ solar infrastructure in 2023: 153 generators, 150 facilities
Wind

- Net-electricity production in 2023: 21.8 million megawatt-hours
- Wind as share of Illinois’ power grid: 12.27% of net-electricity production
- Harmful gas emissions from wind in 2022: None
- Wind as share of harmful gas emissions from electricity production in Illinois: 0%
- Illinois’ wind infrastructure in 2023: 60 generators, 55 facilities
Wood and wood derived fuels

- Net-electricity production in 2023: None
- Wood fuels as share of Illinois’ power grid: 0% of net-electricity production
- Harmful gas emissions from wood fuels in 2022: None
- Wood fuels as share of harmful gas emissions from electricity production in Illinois: 0%
- Illinois’ wood fuels infrastructure in 2023: None
Other biomass (incl. agricultural byproducts, landfill gas, and sludge waste)

- Net-electricity production in 2023: 242,251 megawatt-hours
- Other biomass as share of Illinois’ power grid: 0.14% of net-electricity production
- Harmful gas emissions from other biomass in 2022: 2,114 metric-tons of nitric oxide, nitrogen dioxide, carbon dioxide, and sulfur dioxide
- Other biomass as share of harmful gas emissions from electricity production in Illinois: 0%
- Illinois’ other biomass infrastructure in 2023: 32 generators, 12 facilities
Other gasses (incl. propane, blast furnace gas, and waste gas from fossil fuels)

- Net-electricity production in 2023: 248,088 megawatt-hours
- Other gasses as share of Illinois’ power grid: 0.14% of net-electricity production
- Harmful gas emissions from other gasses in 2022: 139 metric-tons of nitric oxide, nitrogen dioxide, carbon dioxide, and sulfur dioxide
- Other gasses as share of harmful gas emissions from electricity production in Illinois: 0%
- Illinois’ other gasses infrastructure in 2023: 3 generators, 1 facility
All other (incl. municipal solid waste, batteries, chemicals, and hydrogen)

- Net-electricity production in 2023: 256,114 megawatt-hours
- All other sources as share of Illinois’ power grid: 0.14% of net-electricity production
- Harmful gas emissions from all other sources in 2022: 291 metric-tons of nitric oxide, nitrogen dioxide, carbon dioxide, and sulfur dioxide
- All other sources as share of harmful gas emissions from electricity production in Illinois: 0%
- Illinois’ all other sources infrastructure in 2023: 7 generators, 6 facilities
All sources

- Net-electricity production in 2023: 177.7 million megawatt-hours
- Harmful gas emissions from all sources in 2022: 53.9 million metric-tons of nitric oxide, nitrogen dioxide, carbon dioxide, and sulfur dioxide
- Illinois’ all sources infrastructure in 2023: 787 generators, 341 facilities
100 Million Americans Are Missing This Crucial Retirement Tool
The thought of burdening your family with a financial disaster is most Americans’ nightmare. However, recent studies show that over 100 million Americans still don’t have proper life insurance in the event they pass away.
Life insurance can bring peace of mind – ensuring your loved ones are safeguarded against unforeseen expenses and debts. With premiums often lower than expected and a variety of plans tailored to different life stages and health conditions, securing a policy is more accessible than ever.
A quick, no-obligation quote can provide valuable insight into what’s available and what might best suit your family’s needs. Life insurance is a simple step you can take today to help secure peace of mind for your loved ones tomorrow.
Click here to learn how to get a quote in just a few minutes.
Thank you for reading! Have some feedback for us?
Contact the 24/7 Wall St. editorial team.
Latest from 24/7


Our expert who first called NVIDIA in 2009 is predicting 2025 will see a historic AI breakthrough.
You can follow him investing $500,000 of his own money on our top AI stocks for free.