In 2025, gun background checks are down compared to the same four-month period last year. Between January and April of 2024, firearm checks were at 4.6 million. However, during the first quarter of 2025, they are at 4.4 million, revealing a 4.3% decrease. Interestingly, this drop is a trend continuing from years prior. Figures from 2023 were below those of 2022. In 2024, 9.3 million background checks were conducted during quarter one, compared to 10.7 million in 2023 during the same timeframe. This represented a 13.4% drop. It is important to note that while background checks are the best proxy to gun sales, they remain but an estimate.
To determine the states where the most people have bought guns so far this year, 24/7 Wall St. reviewed data from the FBI’s National Instant Criminal Background Check System. States were ranked based on the number of firearm background checks initiated through the NICS from January 2025 through April 2025 per 1,000 residents. Background rechecks for existing gun permits were excluded. Population data is from the Census Bureau’s Population and Housing Unit Estimates program, while data on the number of age-adjusted deaths due to firearms per 100,000 residents in 2023 is from the Centers for Disease Control and Prevention’s WONDER database.
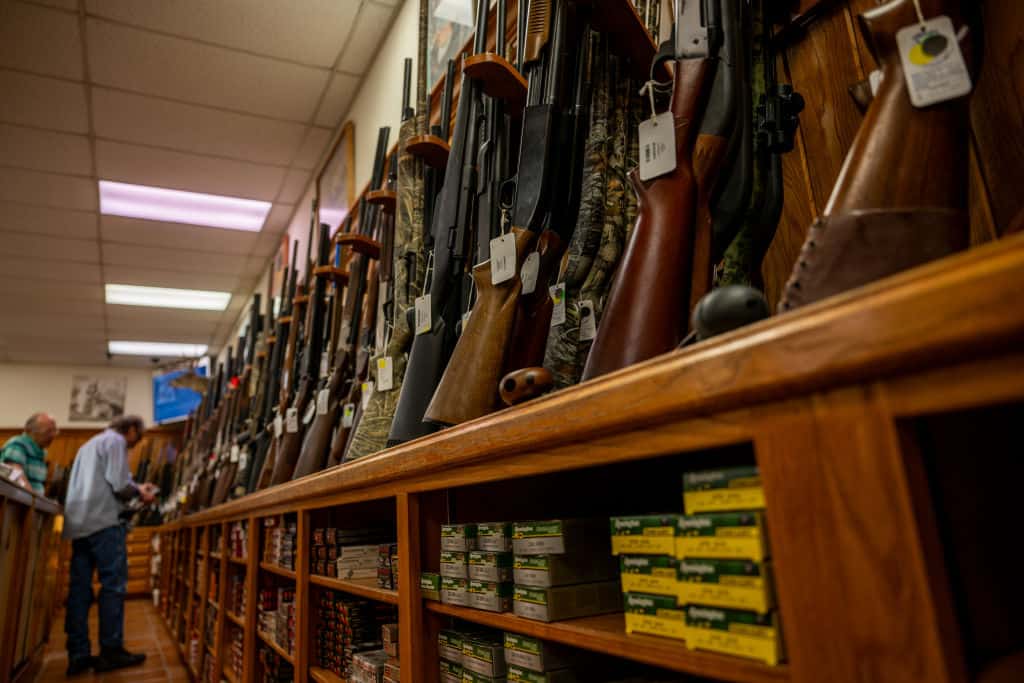
The adjusted national firearm background check figure amounts to 20.5 checks per 1,000 residents. This figure varies considerably by state, from 2.9 per 1,000 residents in Hawaii to 35.4 per 1,000 in Idaho. Hawaii also has the fewest checks at just over 4,300, while Texas has the most checks at nearly 610,000 so far this year. Despite this, Texas has lower background checks per capita than the national average at 19.4 checks per 1,000 residents. (Also see: States With the Most Firearm Retailers.)
On the other hand, several states have a higher background check per capita figure than the national average, with checks in 10 states reaching over 30 per 1,000 residents. When it comes to gun deaths per capita, Mississippi has the most deaths per 100,000 residents at 28.6, while Massachusetts has the fewest at 3.8.
This post was updated on May 28, 2025 to provide the most up-to-date data.
Why This Matters

50. Hawaii

- Firearm background checks per capita, Jan-Apr 2025: 2.98 per 1,000 residents
- Total firearm background checks, Jan-Apr 2025: 4,312
- Firearm mortality rate, 2023: 4.5 deaths per 100,000 residents
- Total population, 2024: 1,446,146
49. New York

- Firearm background checks per capita, Jan-Apr 2025: 4.43 per 1,000 residents
- Total firearm background checks, Jan-Apr 2025: 88,000
- Firearm mortality rate, 2023: 4.7 deaths per 100,000 residents
- Total population, 2024: 19,867,248
48. New Jersey
- Firearm background checks per capita, Jan-Apr 2025: 4.42 per 1,000 residents
- Total firearm background checks, Jan-Apr 2025: 42,000
- Firearm mortality rate, 2023: 4.5 deaths per 100,000 residents
- Total population, 2024: 9,500,851
47. Rhode Island
- Firearm background checks per capita, Jan-Apr 2025: 5.39 per 1,000 residents
- Total firearm background checks, Jan-Apr 2025: 6,000
- Firearm mortality rate, 2023: 5.2 deaths per 100,000 residents
- Total population, 2024: 1,112,308
46. California

- Firearm background checks per capita, Jan-Apr 2025: 10.1 per 1,000 residents
- Total firearm background checks, Jan-Apr 2025: 400,000
- Firearm mortality rate, 2023: 8.6 deaths per 100,000 residents
- Total population, 2024: 39,431,263
45. Nebraska

- Firearm background checks per capita, Jan-Apr 2025: 14.96 per 1,000 residents
- Total firearm background checks, Jan-Apr 2025: 30,000
- Firearm mortality rate, 2023: 10.6 deaths per 100,000 residents
- Total population, 2024: 2,005,465
44. Massachusetts

- Firearm background checks per capita, Jan-Apr 2025: 4.90 per 1,000 residents
- Total firearm background checks, Jan-Apr 2025: 35,000
- Firearm mortality rate, 2023: 3.8 deaths per 100,000 residents
- Total population, 2024: 7,136,171
43. Iowa

- Firearm background checks per capita, Jan-Apr 2025: 21.85 per 1,000 residents
- Total firearm background checks, Jan-Apr 2025: 70,808
- Firearm mortality rate, 2023: 10.5 deaths per 100,000 residents
- Total population, 2024: 3,241,488
42. Nevada
- Firearm background checks per capita, Jan-Apr 2025: 55.33 per 1,000 residents
- Total firearm background checks, Jan-Apr 2025: 180,730
- Firearm mortality rate, 2023: 17.0 deaths per 100,000 residents
- Total population, 2024: 3,267,467
41. Maryland
- Firearm background checks per capita, Jan-Apr 2025: 9.93 per 1,000 residents
- Total firearm background checks, Jan-Apr 2025: 62,215
- Firearm mortality rate, 2023: 11.8 deaths per 100,000 residents
- Total population, 2024: 6,263,220
40. Georgia
- Firearm background checks per capita, Jan–Apr 2025: 20.0 per 1,000 residents
- Total firearm background checks, Jan–Apr 2025: 223,617
- Firearm mortality rate, 2023: 19.7 deaths per 100,000 people
- Total population, 2024: 11,180,878
39. Ohio
- Firearm background checks per capita, Jan–Apr 2025: 44.4 per 1,000 residents
- Total firearm background checks, Jan–Apr 2025: 527,579
- Firearm mortality rate, 2023: 15.6 deaths per 100,000 people
- Total population, 2024: 11,883,304
38. Texas
- Firearm background checks per capita, Jan–Apr 2025: 19.4 per 1,000 residents
- Total firearm background checks, Jan–Apr 2025: 610,000
- Firearm mortality rate, 2023: 15.3 deaths per 100,000 people
- Total population, 2024: 31,290,831
37. Delaware

- Firearm background checks per capita, Jan–Apr 2025: 18.7 per 1,000 residents
- Total firearm background checks, Jan–Apr 2025: 20,000
- Firearm mortality rate, 2023: 11.9 deaths per 100,000 people
- Total population, 2024: 1,067,410
36. Washington
- Firearm background checks per capita, Jan–Apr 2025: 4.7 per 1,000 residents
- Total firearm background checks, Jan–Apr 2025: 37,858
- Firearm mortality rate, 2023: 11.2 deaths per 100,000 people
- Total population, 2024: 8,035,700
35. Louisiana

- Firearm background checks per capita, Jan–Apr 2025: 7.6 per 1,000 residents
- Total firearm background checks, Jan–Apr 2025: 35,000
- Firearm mortality rate, 2023: 28.4 deaths per 100,000 people
- Total population, 2024: 4,597,740
34. Florida
- Firearm background checks per capita, Jan–Apr 2025: 26.2 per 1,000 residents
- Total firearm background checks, Jan–Apr 2025: 623,000
- Firearm mortality rate, 2023: 14.1 deaths per 100,000 people
- Total population, 2024: 23,839,600
33. Kansas
- Firearm background checks per capita, Jan–Apr 2025: 32.3 per 1,000 residents
- Total firearm background checks, Jan–Apr 2025: 96,000
- Firearm mortality rate, 2023: 15.9 deaths per 100,000 people
- Total population, 2024: 2,970,606
32. Virginia

- Firearm background checks per capita, Jan–Apr 2025: 12.6 per 1,000 residents
- Total firearm background checks, Jan–Apr 2025: 109,143
- Firearm mortality rate, 2023: 13.7 deaths per 100,000 people
- Total population, 2024: 8,657,365
31. Kentucky
- Firearm background checks per capita, Jan–Apr 2025: 9.7 per 1,000 residents
- Total firearm background checks, Jan–Apr 2025: 43,488
- Firearm mortality rate, 2023: 18.8 deaths per 100,000 people
- Total population, 2024: 4,486,310
30. Vermont

- Firearm background checks per capita, Jan–Apr 2025: 7.6 per 1,000 residents
- Total firearm background checks, Jan–Apr 2025: 4,045
- Firearm mortality rate, 2023: 12.8 deaths per 100,000 people
- Total population, 2024: 534,000
29. Arizona

- Firearm background checks per capita, Jan–Apr 2025: Data not available
- Total firearm background checks, Jan–Apr 2025: Data not available
- Firearm mortality rate, 2023: 17.8 deaths per 100,000 people
- Total population, 2024: 7,852,000
28. Connecticut
- Firearm background checks per capita, Jan–Apr 2025: 4.6 per 1,000 residents
- Total firearm background checks, Jan–Apr 2025: 16,905
- Firearm mortality rate, 2023: 6.2 deaths per 100,000 people
- Total population, 2024: 3,675,069
27. Indiana
- Firearm background checks per capita, Jan–Apr 2025: 10.1 per 1,000 residents
- Total firearm background checks, Jan–Apr 2025: 70,276
- Firearm mortality rate, 2023: 18.7 deaths per 100,000 people
- Total population, 2024: 6,924,275
26. North Carolina

- Firearm background checks per capita, Jan–Apr 2025: 22.5 per 1,000 residents
- Total firearm background checks, Jan–Apr 2025: 248,535
- Firearm mortality rate, 2023: 16.4 deaths per 100,000 people
- Total population, 2024: 11,046,024
25. South Carolina

- Firearm background checks per capita, Jan–Apr 2025: 6.4 per 1,000 residents
- Total firearm background checks, Jan–Apr 2025: 35,000
- Firearm mortality rate, 2023: 19.1 deaths per 100,000 people
- Total population, 2024: 5,479,000
24. Arkansas
- Firearm background checks per capita, Jan–Apr 2025: 24.0 per 1,000 residents
- Total firearm background checks, Jan–Apr 2025: 72,000
- Firearm mortality rate, 2023: 21.9 deaths per 100,000 people
- Total population, 2024: 3,000,000
23. Maine

- Firearm background checks per capita, Jan–Apr 2025: Data not available
- Total firearm background checks, Jan–Apr 2025: Data not available
- Firearm mortality rate, 2023: 14.2 deaths per 100,000 people
- Total population, 2024: 1,405,012
22. Michigan
- Firearm background checks per capita, Jan–Apr 2025: 10.4 per 1,000 residents
- Total firearm background checks, Jan–Apr 2025: 105,000
- Firearm mortality rate, 2023: 15.4 deaths per 100,000 people
- Total population, 2024: 10,140,459
21. Missouri
- Firearm background checks per capita, Jan–Apr 2025: Data not available
- Total firearm background checks, Jan–Apr 2025: Data not available
- Firearm mortality rate, 2023: 20.8 deaths per 100,000 people
- Total population, 2024: 6,245,466
20. New Mexico

- Firearm background checks per capita, Jan–Apr 2025: Data not available
- Total firearm background checks, Jan–Apr 2025: Data not available
- Firearm mortality rate, 2023: 27.3 deaths per 100,000 people
- Total population, 2024: 2,130,256
19. Mississippi

- Firearm background checks per capita, Jan–Apr 2025: Data not available
- Total firearm background checks, Jan–Apr 2025: Data not available
- Firearm mortality rate, 2023: 28.6 deaths per 100,000 people
- Total population, 2024: 2,943,045
18. South Dakota

- Firearm background checks per capita, Jan–Apr 2025: 13.2 per 1,000 residents
- Total firearm background checks, Jan–Apr 2025: 12,200
- Firearm mortality rate, 2023: 12.3 deaths per 100,000 people
- Total population, 2024: 924,669
17. Minnesota

- Firearm background checks per capita, Jan–Apr 2025: 12.0 per 1,000 residents
- Total firearm background checks, Jan–Apr 2025: 69,518
- Firearm mortality rate, 2023: 9.6 deaths per 100,000 people
- Total population, 2024: 5,793,151
16. Utah

- Firearm background checks per capita, Jan–Apr 2025: 74.1 per 1,000 residents
- Total firearm background checks, Jan–Apr 2025: 259,730
- Firearm mortality rate, 2023: 14.8 deaths per 100,000 people
- Total population, 2024: 3,506,838
15. Tennessee
- Firearm background checks per capita, Jan–Apr 2025: 41.3 per 1,000 residents
- Total firearm background checks, Jan–Apr 2025: 298,425
- Firearm mortality rate, 2023: 22.1 deaths per 100,000 people
- Total population, 2024: 7,227,750
14. Oklahoma

- Firearm background checks per capita, Jan–Apr 2025: 5.3 per 1,000 residents
- Total firearm background checks, Jan–Apr 2025: 22,761
- Firearm mortality rate, 2023: 19.9 deaths per 100,000 people
- Total population, 2024: 4,095,393
13. North Dakota

- Firearm background checks per capita, Jan–Apr 2025: 29.0 per 1,000 residents
- Total firearm background checks, Jan–Apr 2025: 23,090
- Firearm mortality rate, 2023: 13.0 deaths per 100,000 people
- Total population, 2024: 796,568
12. Pennsylvania

- Firearm background checks per capita, Jan–Apr 2025: 23.2 per 1,000 residents
- Total firearm background checks, Jan–Apr 2025: 304,000
- Firearm mortality rate, 2023: 14.0 deaths per 100,000 people
- Total population, 2024: 13,078,751
11. Colorado
- Firearm background checks per capita, Jan–Apr 2025: 34.7 per 1,000 residents
- Total firearm background checks, Jan–Apr 2025: 206,116
- Firearm mortality rate, 2023: 17.1 deaths per 100,000 people
- Total population, 2024: 5,957,493
10. Alaska

- Firearm background checks per capita, Jan–Apr 2025: 44.3 per 1,000 residents
- Total firearm background checks, Jan–Apr 2025: 32,857
- Firearm mortality rate, 2023: 22.4 deaths per 100,000 people
- Total population, 2024: 741,147
9. Wisconsin
- Firearm background checks per capita, Jan–Apr 2025: 5.6 per 1,000 residents
- Total firearm background checks, Jan–Apr 2025: 33,308
- Firearm mortality rate, 2023: 12.7 deaths per 100,000 people
- Total population, 2024: 5,989,256
8. Illinois

- Firearm background checks per capita, Jan–Apr 2025: 24.0 per 1,000 residents
- Total firearm background checks, Jan–Apr 2025: 305,281
- Firearm mortality rate, 2023: 13.5 deaths per 100,000 people
- Total population, 2024: 12,710,158
7. West Virginia

- Firearm background checks per capita, Jan–Apr 2025: 15.0 per 1,000 residents
- Total firearm background checks, Jan–Apr 2025: 26,626
- Firearm mortality rate, 2023: 16.2 deaths per 100,000 people
- Total population, 2024: 1,769,979
6. Oregon

- Firearm background checks per capita, Jan–Apr 2025: 7.3 per 1,000 residents
- Total firearm background checks, Jan–Apr 2025: 31,000
- Firearm mortality rate, 2023: 14.4 deaths per 100,000 people
- Total population, 2024: 4,272,371
5. New Hampshire

- Firearm background checks per capita, Jan–Apr 2025: 17.5 per 1,000 residents
- Total firearm background checks, Jan–Apr 2025: 24,658
- Firearm mortality rate, 2023: 10.1 deaths per 100,000 people
- Total population, 2024: 1,409,032
4. Alabama
- Firearm background checks per capita, Jan–Apr 2025: 27.1 per 1,000 residents
- Total firearm background checks, Jan–Apr 2025: 140,000
- Firearm mortality rate, 2023: 25.1 deaths per 100,000 people
- Total population, 2024: 5,157,699
3. Montana

- Firearm background checks per capita, Jan–Apr 2025: 32.9 per 1,000 residents
- Total firearm background checks, Jan–Apr 2025: 37,519
- Firearm mortality rate, 2023: 23.9 deaths per 100,000 people
- Total population, 2024: 1,137,233
2. Wyoming

- Firearm background checks per capita, Jan–Apr 2025: 55.4 per 1,000 residents
- Total firearm background checks, Jan–Apr 2025: 32,857
- Firearm mortality rate, 2023: 22.1 deaths per 100,000 people
- Total population, 2024: 587,618
1. Idaho

- Firearm background checks per capita, Jan–Apr 2025: 35.4 per 1,000 residents
- Total firearm background checks, Jan–Apr 2025: 70,808
- Firearm mortality rate, 2023: 17.9 deaths per 100,000 people
- Total population, 2024: 2,001,619